Inhibition of the serine protease HtrA1 by SerpinE2 suggests an extracellular proteolytic pathway in the control of neural crest migration
- Vertebrate Developmental Biology Laboratory, Department of Laboratory Medicine, Lund Stem Cell Center, University of Lund, Sweden
- iPSC Laboratory for CNS Disease Modeling, Department of Experimental Medical Science, Lund Stem Cell Center, Strategic Research Area MultiPark, Lund University, Sweden
Figures
Figure 1 with 1 supplement
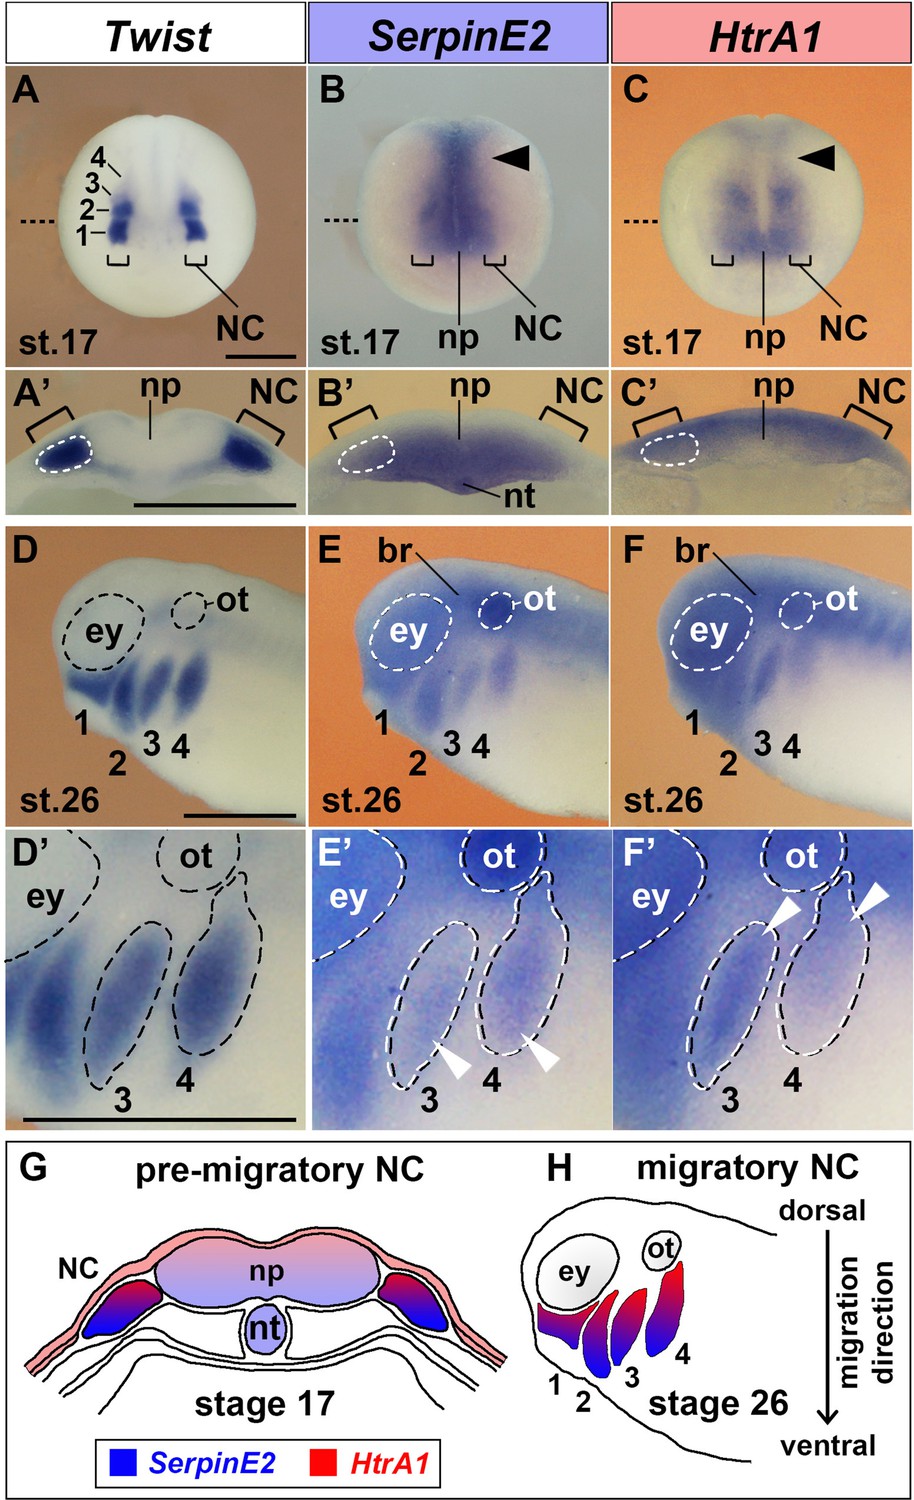
SerpinE2 and HtrA1 are expressed in the neural crest.
Xenopus embryos were analyzed by whole-mount in situ hybridization. (A–C) Anterior view of embryos at stage 17. The brackets point to pre-migratory NC cells on each side of the neural plate. The numbers label the Twist-expressing cranial NC segments: 1, mandibular; 2, hyoid; 3, anterior branchial; 4, posterior branchial. Arrowheads show SerpinE2 and HtrA1 transcripts in the trunk NC. The stippled lines indicate the level of sections in A’–C’. (A’–C’) Transversally hemisectioned embryos. SerpinE2 and HtrA1 signals appear in the NC (strippled circle lines). Note that SerpinE2 is also expressed in the inner sensorial layer of the neural plate and underlying notochord, whereas HtrA1 expression is more abundant in the outer ependymal layer of the neural plate. (D–F) Lateral view of embryos at stage 26. SerpinE2 and HtrA1 are expressed in Twist+ NC cell streams (1–4). Transcripts of both genes can also be seen in the brain, eye, and otic placode. (D’–F’) Magnification of embryos. Arrowheads demarcate SerpinE2 transcripts near the front (E’) and HtrA1 transcripts at the rear end (F’) of the migrating NC cell collectives in the branchial arches. (G, H) Summary of gene expression domains. At stage 17, SerpinE2 is transcribed in ventral and HtrA1 in dorsal cells of the pre-migratory NC (G). At stage 26, SerpinE2 is expressed in leader cells and HtrA1 in follower cells of migrating NC streams (H).br, brain; ey, eye; NC, neural crest; np, neural plate; nt, notochord; ot, otic placode. Scale bars, 0.5 mm.
Figure 1—figure supplement 1
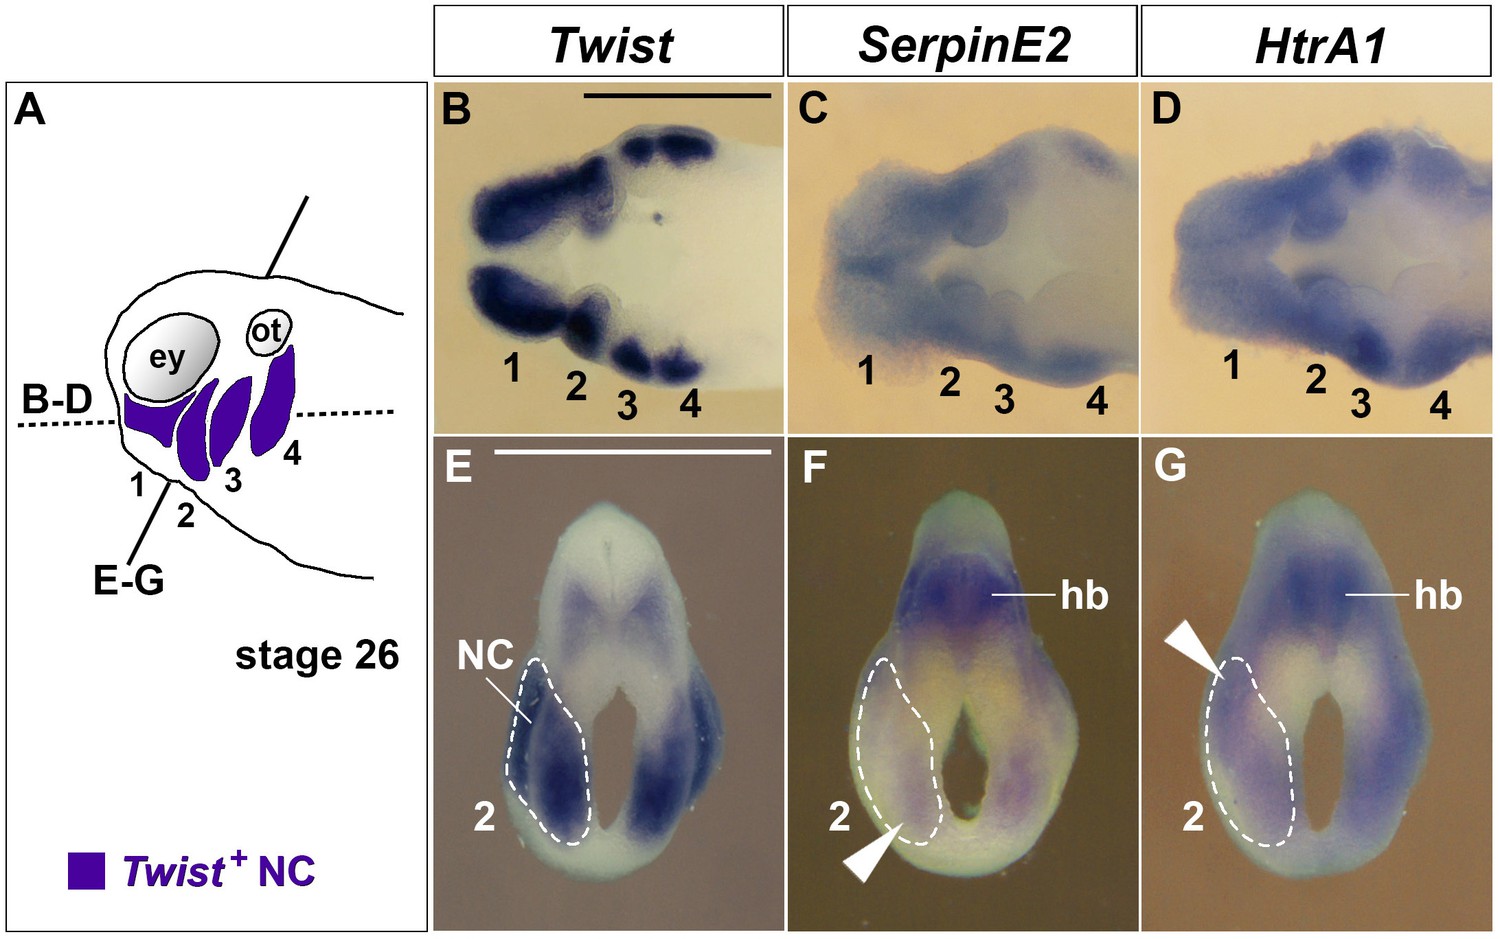
Twist, SerpinE2, and HtrA1 gene expression in sections of tailbud stage embryos after whole-mount in situ hybridization.
(A) Schematic of embryo at stage 26. Labeled in violet are the Twist-positive NC cells in the mandibular arch (1), hyoid arch (2), anterior branchial arch (3), and posterior branchial arch (4). Indicated are the level of horizontal sections in panels B–D (strippled line) and the level of transversal sections in panels E–G (continuous line). (B–D) Horizontal hemisections viewed from dorsal. (E–G) Transversal sections. The strippled line labels the Twist+ NC. Note the arrowheads indicating the ventral SerpinE2 and the dorsal HtrA1 expression domains in the NC of the hyoid arch. ey, eye; hb, hindbrain; NC, neural crest; ot, otic placode. Scale bars, 0.5mm.
Figure 2 with 1 supplement
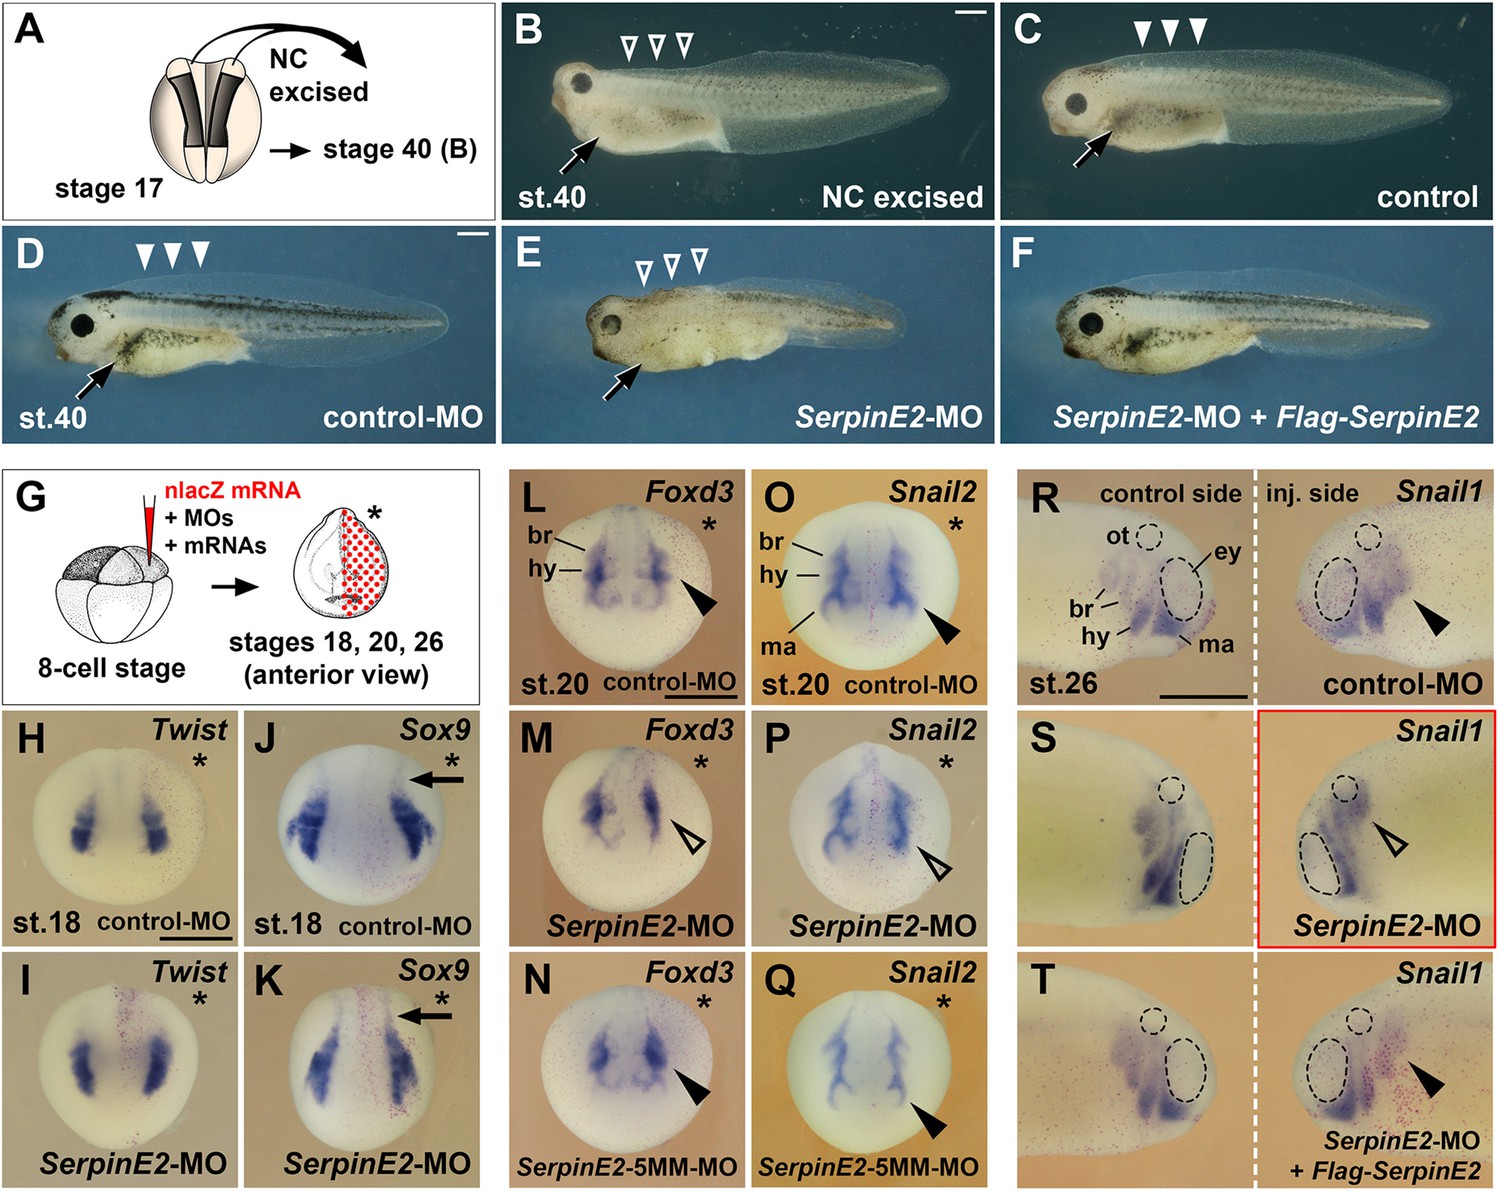
Knockdown of SerpinE2 mimics the phenotype of neural excision and inhibits migration of neural crest cells.
(A) Scheme of extirpation. Dorsal view of Xenopus embryo at stage 17, from which NC tissue was removed on both sides. (B, C) Tadpole embryo at stage 40 following NC excision (B) and sibling control (C). Note the small head, absence of dorsal fin tissue (open arrowheads), and the reduced number of melanocytes (arrow) resulting from NC extirpation in A. (D) Unaffected tadpole after microinjection with control-MO into all animal blastomeres at the eight-cell stage. Highlighted are the pigmented melanocytes (arrow) and the intact dorsal fin (filled arrowheads). (E) SerpinE2-MO causes a reduction of head tissue, dorsal fin structures (open arrowheads), and melanocytes (arrow). (F) Co-injection of SerpinE2-MO and 2 ng non-targeted Flag-SerpinE2 mRNA restores a normal phenotype. (G) Scheme for microinjections in H–T. MOs and mRNAs were injected together with 100 pg nlacZ mRNA as lineage tracer (red nuclei) into one dorsal animal blastomere of embryos at the eight-cell stage. The injected side is marked with a star. (H–K) Anterior view of neurula embryos at stage 18. Neither control-MO nor SerpinE2-MO affect Twist and Sox9 expression in NC cells in the head and trunk (arrows) . (L–Q) SerpinE2-MO inhibits the epithelial-mesenchymal transition (EMT) of Foxd3+ and Snail2+ NC cells (open arrowheads) at stage 20, whereas the control-MO and SerpinE2-5MM-MO have no effect (filled arrowheads). (R–T) Lateral view of stage 26 embryos. A single injection of control-MO does not affect the migration of Snail1+ NC cells (filled arrowhead). SerpinE2-MO leads to a migration defect on the injected side (open arrowhead). 333 pg Flag-SerpinE2 mRNA rescues NC migration in the SerpinE2-morphant embryo. br, branchial crest segment; ey, eye primordium; hy, hyoid crest segment; ma, mandibular crest segment; MO, morpholino oligonucleotide; NC, neural crest; ot, otic vesicle. Doses of injected MOs per embryo were 40 ng (D–F) and 10 ng (H–T). Indicated phenotypes were shown in B, 10/11; D, 89/90; E, 64/83; F, 122/132; H, 29/29; I, 24/26; J, 7/7; K, 10/11; L, 9/9; M, 7/7; N, 7/9; O, 7/8; P, 8/9; Q, 9/11; R, 10/10; S, 13/15; T, 9/9. Scale bars, 0.5 mm.
Figure 2—figure supplement 1
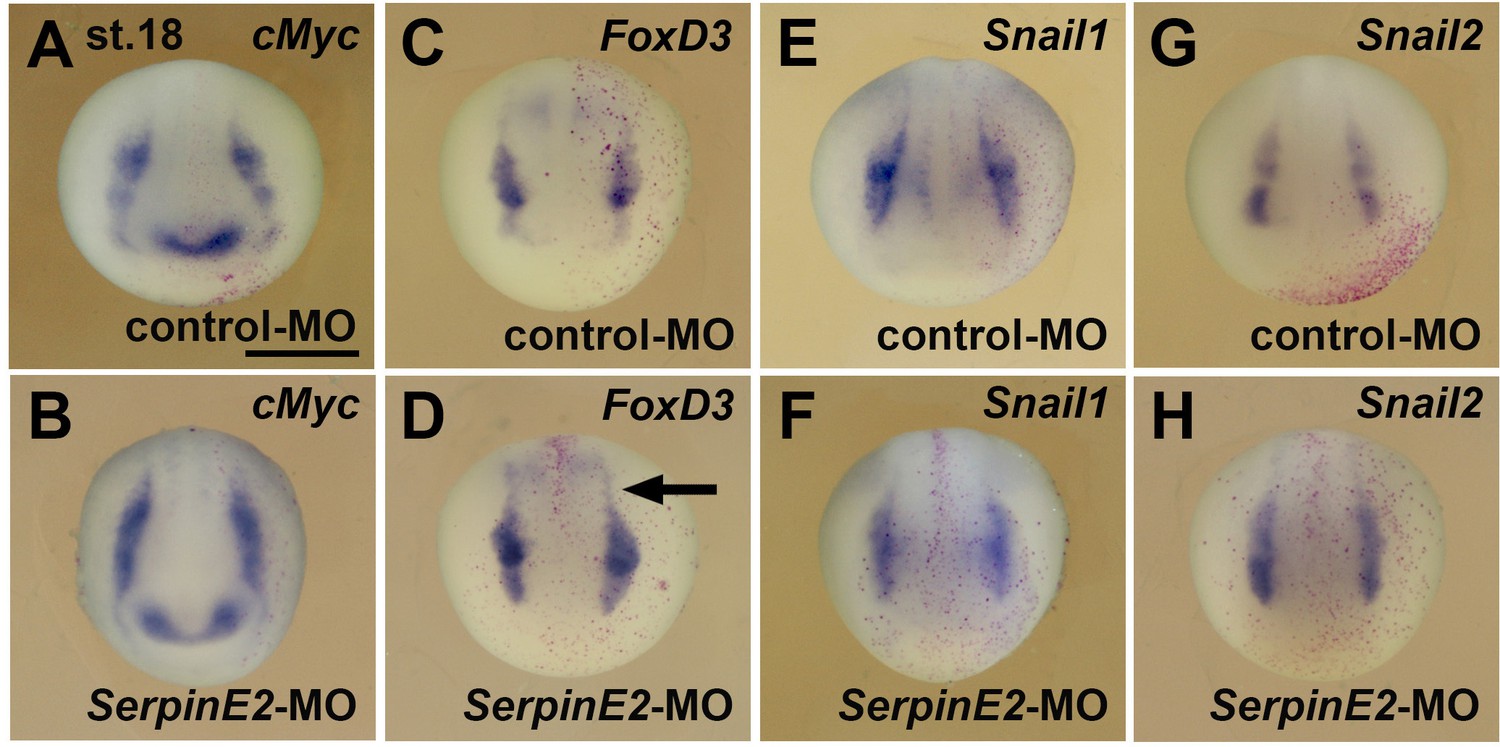
SerpinE2 depletion does not affect the specification of neural crest cells.
(A–H) Anterior view of embryos at stage 18 after whole-mount in situ hybridization. Note that neither control-MO (A, C, E, G) nor SerpinE2-MO (B, D, F, H) affect the expression of the neural crest cell markers cMyc, FoxD3, Snail1, and Snail2. The arrow demarcates the trunk neural crest. Embryos were injected into a single animal blastomere at the eight-cell stage with 10 ng morpholino oligonucleotide (MO) and 100 pg nlacZ mRNA as lineage tracer (red nuclei). Indicated phenotypes were shown in A, 5/5; B, 9/9; C, 8/8; D, 9/9; E, 6/6; F, 6/7; G, 8/8; H, 5/6. Scale bar, 0.5mm.
Figure 3
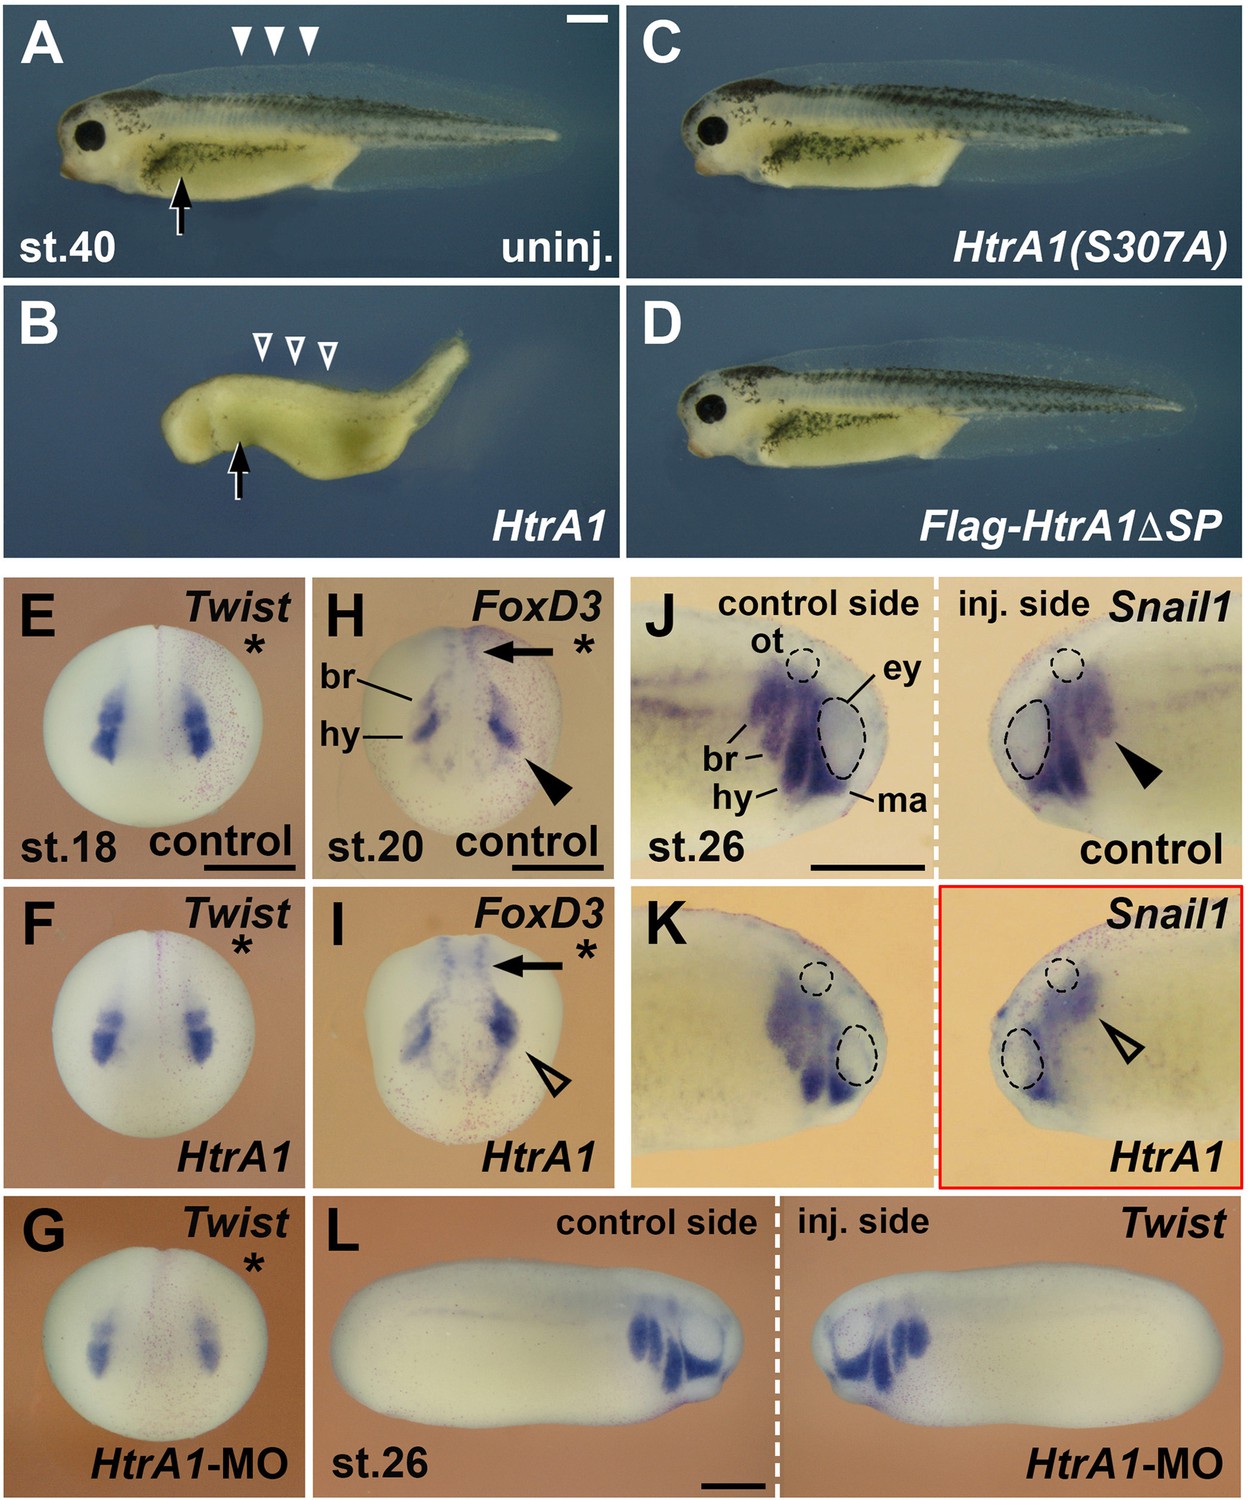
HtrA1 protease inhibits the formation of neural crest (NC)-derived structures and reduces NC migration.
Embryos were injected into all animal blastomeres (A–D) or a single dorsal animal blastomere (E–L) at the eight-cell stage. (A–D) Tadpoles at stage 40. HtrA1 mRNA causes reduction of head tissue, dorsal fin structures (arrowheads), and melanocytes (arrow), whereas HtrA1(S307A) and Flag-HtrA1ΔSP mRNA have no effect. (E–G) Anterior view of embryos at stage 18. Stars demarcate the injected sides. Neither 65 pg HtrA1 mRNA nor 10 ng HtrA1-MO do affect the specification of Twist+ cranial NC cells. (H, I) Anterior view of embryos at stage 20. 65 pg HtrA1 mRNA reduces the epithelial-mesenchymal transition (EMT) of Foxd3+ cranial NC cells (arrowheads) but does not affect the specification of trunk NC cells (arrows). (J–L) Lateral view of embryos at stage 26. The migration of NC cells (arrowheads) is reduced by 65 pg HtrA1 mRNA but not affected by 10 ng HtrA1-MO. br, branchial crest segments; ey, eye; hy, hyoid crest segment; ma, mandibular crest segment; ot, otic vesicle. Unless otherwise noted, the mRNA doses of HtrA1 and derived constructs per embryo were 100 pg. Indicated phenotypes were shown in B, 98/100; C, 74/83; D, 84/87; E, 31/31; F, 51/53; G, 59/60; H, 28/31; I, 23/26; J, 9/10; K, 21/21; L, 58/79 embryos; at least two independent experiments. Scale bars, 0.5 mm.
Figure 4 with 2 supplements
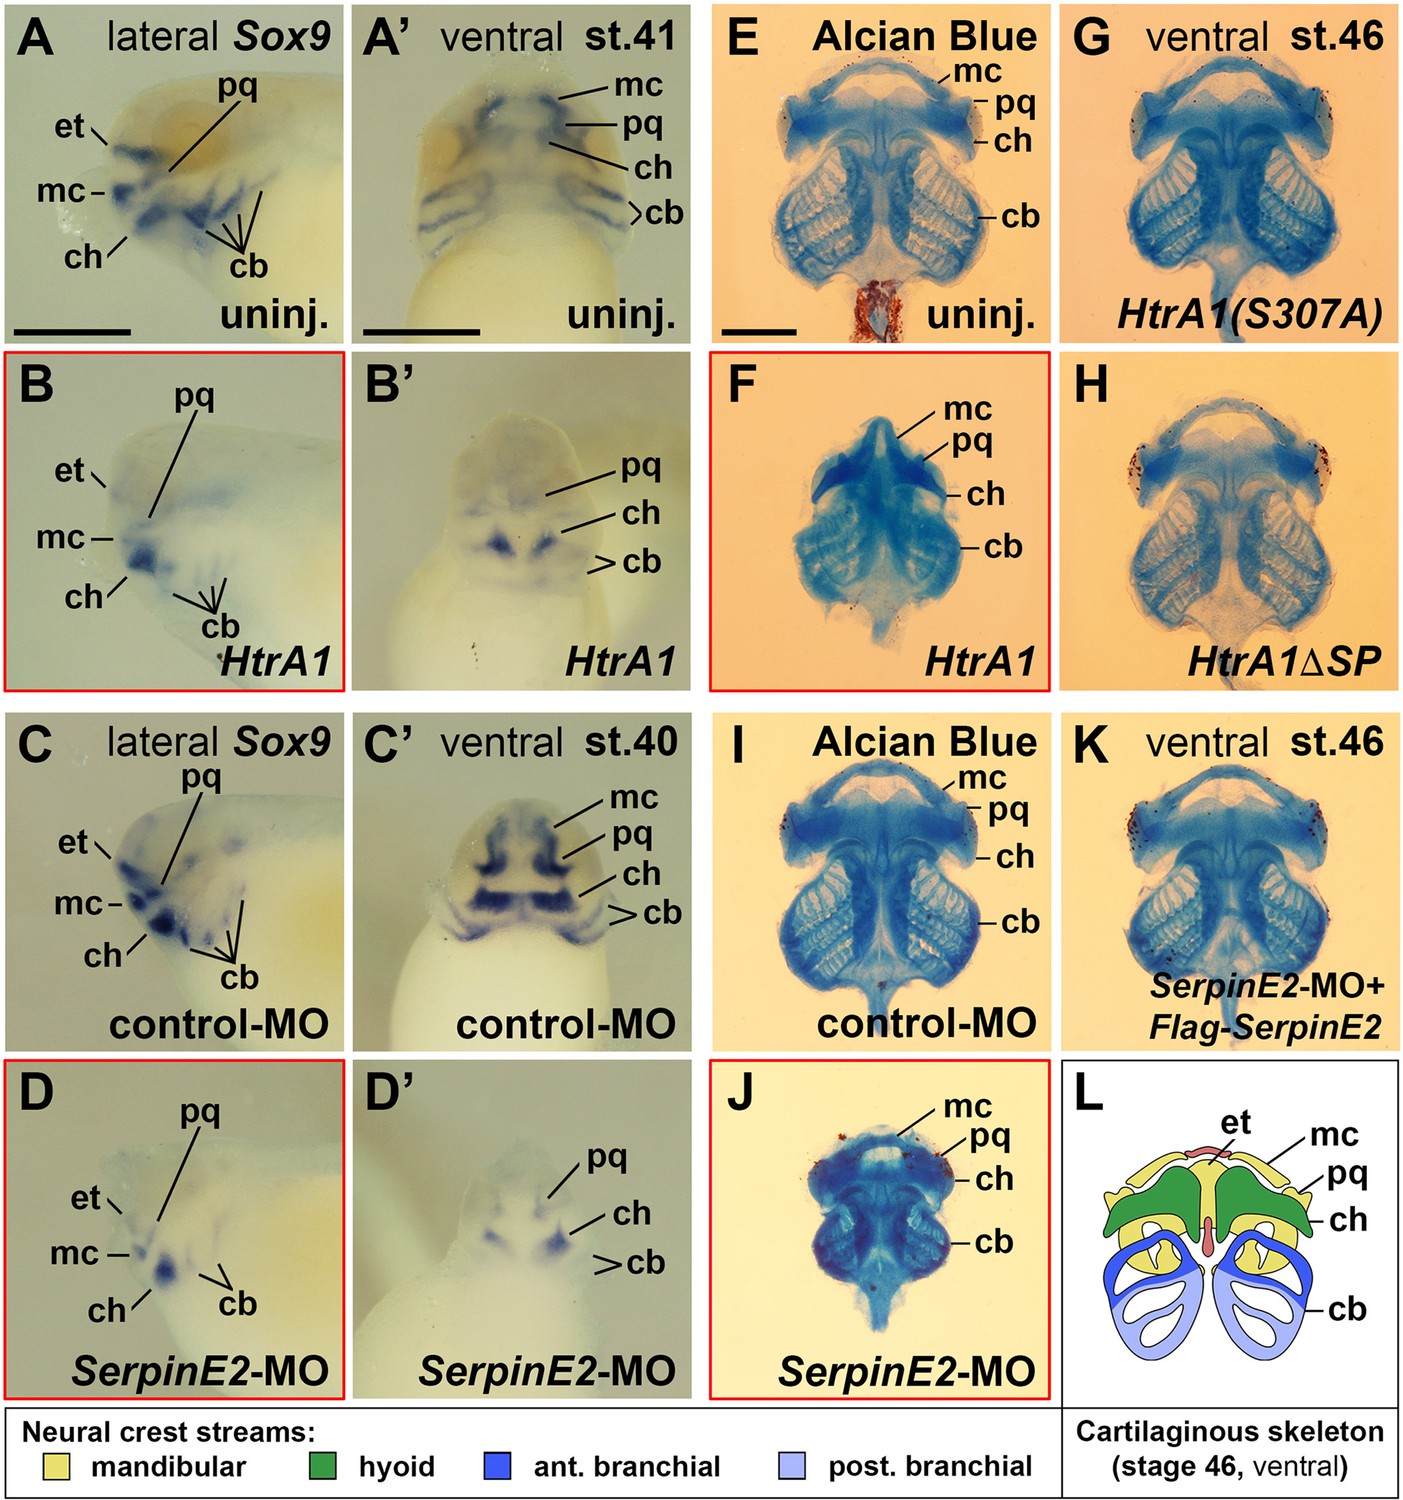
HtrA1 overexpression and SerpinE2 knockdown decrease cartilaginous elements and craniofacial structures.
Xenopus embryos were injected into four animal blastomeres at the eight-cell stage with a total of 100 pg mRNA and 40 ng morpholino oligonucleotides (MOs). (A–D’) Tadpoles at stages 40/41 after whole-mount in situ hybridization in lateral (A–D) and ventral view (A’–D’). Note that HtrA1 mRNA and SerpinE2-MO reduce Sox9 expression, whereas control-MO has no effect on the labeled cartilaginous elements. (E–K) Ventral view of cartilaginous skeleton extracted from embryos at stage 46 after Alcian Blue staining. The dorsal ethmoid-trabecular cartilage was removed for better visibility. Note that HtrA1 mRNA, but not HtrA1(S307A) and Flag-HtrA1ΔSP mRNAs, diminishes craniofacial structures (E–H). SerpinE2-MO, but not control-MO nor a combination of SerpinE2-MO and Flag-SerpinE2 mRNA, reduce head skeleton structures (I–K). (L) Scheme of the cartilaginous skeleton at stage 46 in ventral view. Indicated is the contribution of neural crest streams to the craniofacial skeleton elements. cb, ceratobranchial; ch, ceratohyal; et, ethmoid-trabecular; mc, Meckel’s cartilage; pq, palatoquadrate. Indicated phenotypes were shown in A, 11/11; B, 17/19; C, 12/13; D, 15/17; E, 57/58; F, 17/21; G, 72/77; H, 67/78; I, 83/88; J, 73/77; K, 77/87 embryos; at least two independent experiments. Scale bars, 0.5mm.
Figure 4—figure supplement 1

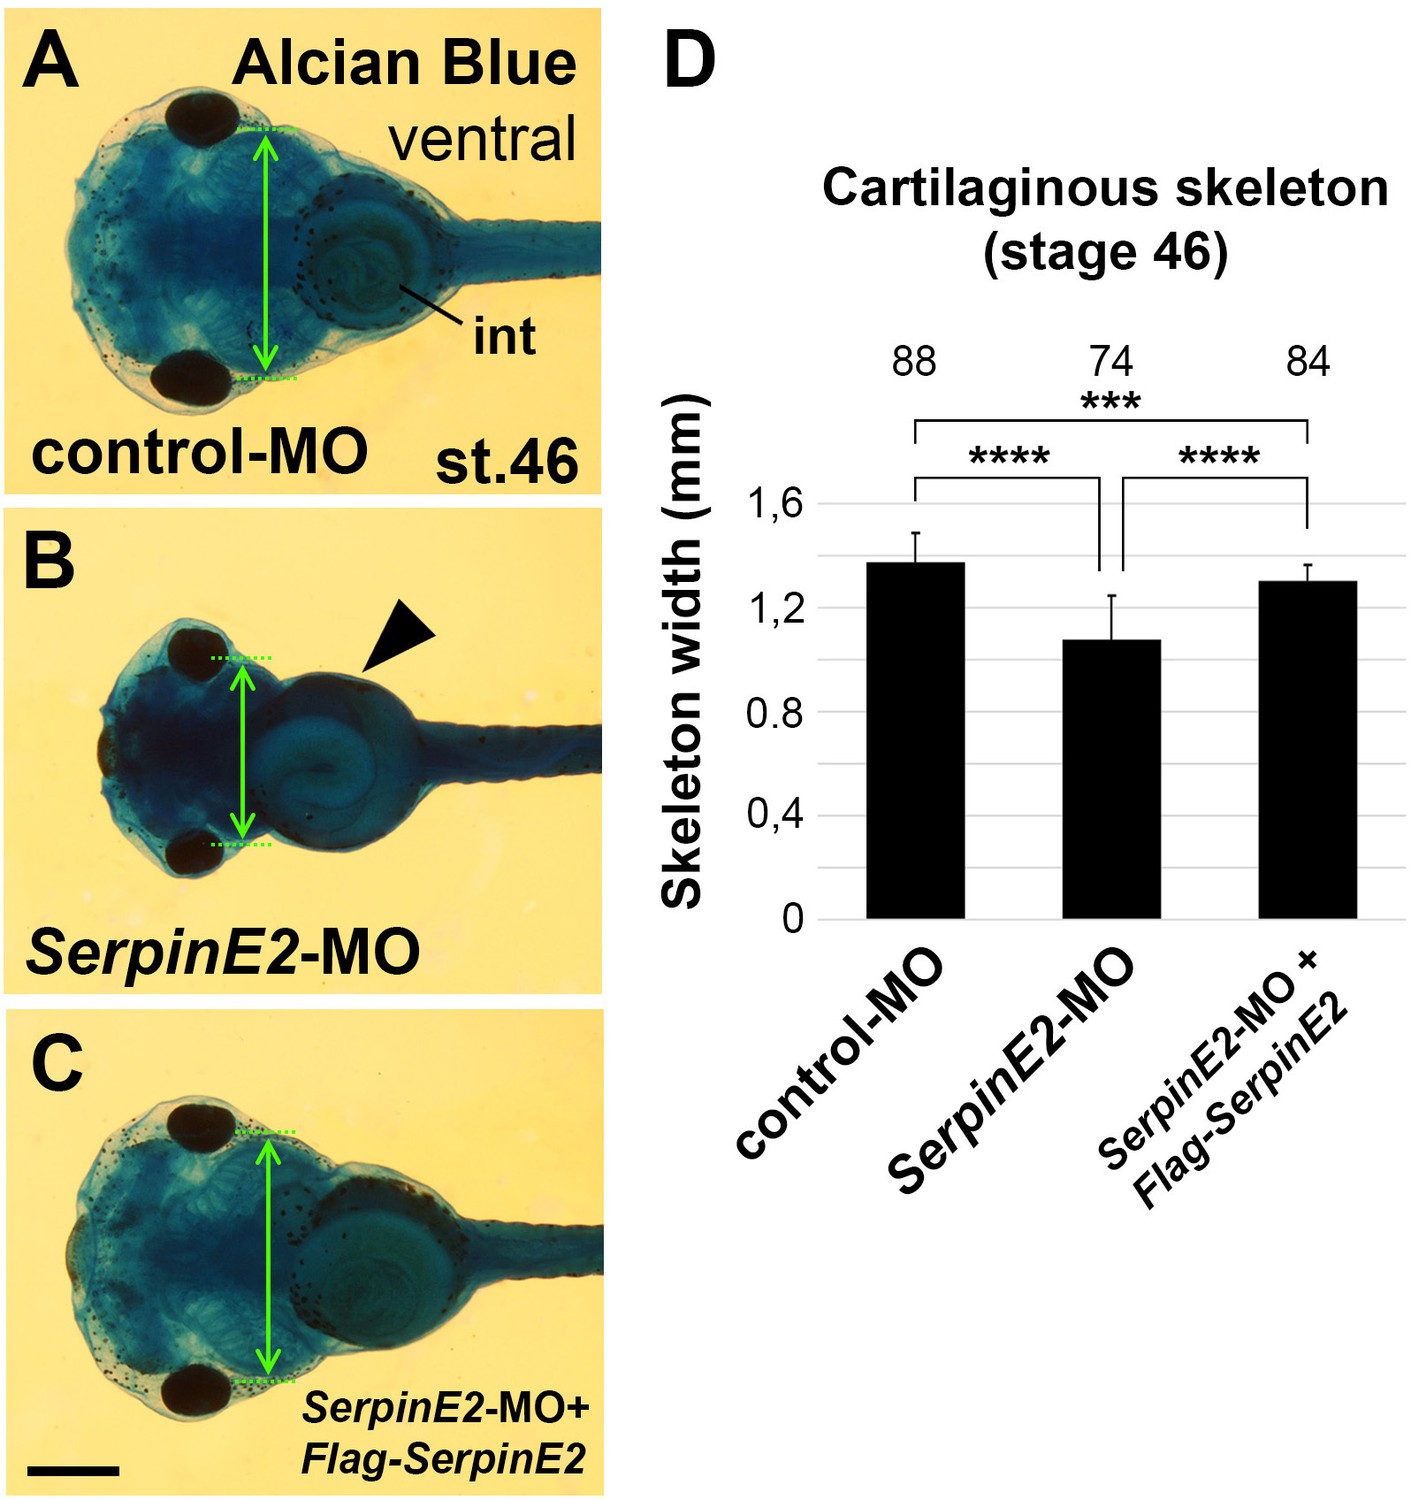
Overexpression of HtrA1 decreases cartilaginous elements and craniofacial structures.
Embryos were injected into four animal blastomeres at the eight-cell stage with a total of 100 pg mRNA. (A–D) Ventral view of embryos at stage 46 after Alcian Blue staining. Note that HtrA1 mRNA decreases the skeleton width (double arrow at the level of the ceratobranchial cartilage structures) but does not affect gut coiling (arrowhead). HtrA1(S307A) and HtrA1ΔSP mRNAs have no effects. (E) Quantification of the skeleton width. The number of analyzed specimen is indicated above each column. int, intestine. Indicated phenotypes were shown in A, 73/74; B, 58/62; C, 73/77; D, 67/78 embryos. Scale bar, 0.5mm. Data in all graphs are displayed as mean ± SD, n ≥ 2; ****p<0.0001, one-way ANOVA followed by Tukey’s post hoc test.
Figure 4—figure supplement 2
Knockdown of SerpinE2 reduces craniofacial skeleton formation.
Morpholino oligonucleotides (MOs) were injected into Xenopus embryos at the eight-cell stage. (A–C) Ventral view of tadpoles at stage 46 after Alcian Blue staining. Note that SerpinE2-MO decreases the branchial skeleton width (double arrow) but does not affect gut coiling (arrowhead). The control-MO and a combination of SerpinE2-MO and Flag-SerpinE2 mRNA have no effects. (D) Quantification of the skeleton width. The number of analyzed specimen is indicated above each column. Embryos were injected into four animal blastomeres with a total of 40 ng MO. int, intestine. Indicated phenotypes were shown in A, 76/88; B, 72/74; C, 78/85. Scale bar, 0.5mm. Data in all graphs are displayed as mean ± SD, n ≥ 3; ***p<0.001, ****p<0.0001, one-way ANOVA followed by Tukey’s post hoc test.
Figure 5 with 2 supplements
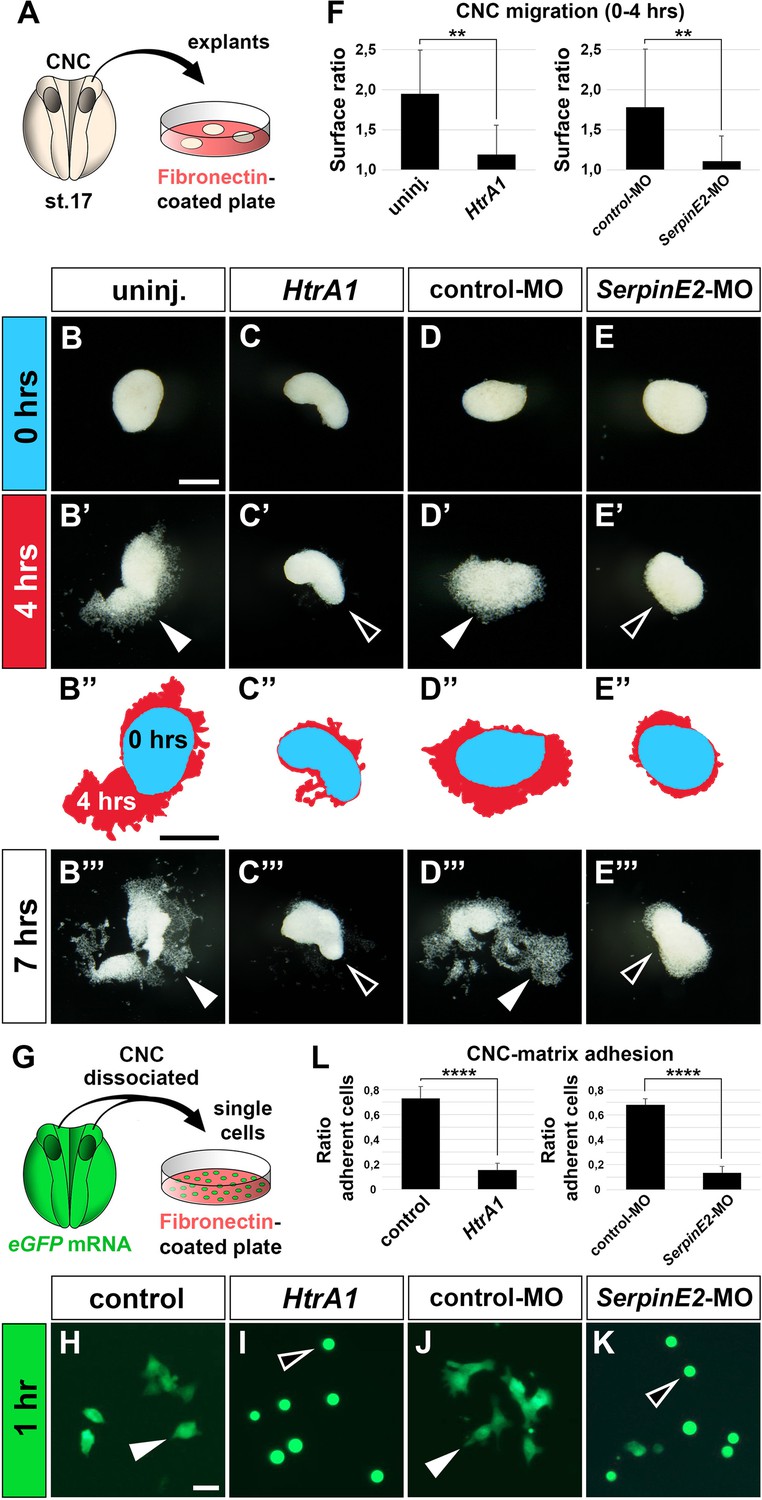
HtrA1 overexpression and SerpinE2 knockdown inhibit cranial neural crest cell migration and adhesion to fibronectin in vitro.
(A) Scheme of migration experiment. The cranial neural crest was explanted from uninjected or injected embryos at stage 17 and cultured on a fibronectin-covered plastic plate. (B–E’’’) Time-lapse of cell migration in CNC explants after culturing for 0, 4, or 7 hr. Note collective cell migration (filled arrowheads) in uninjected controls and explants injected with control-MO, whereas HtrA1 mRNA and SerpinE2-MO block migration (open arrowheads). In B’’–E’’, the surface areas of explants at 0 hr (blue) and 4 hr (red) were determined by ImageJ and superimposed. Scale bar, 0.2 mm. (F) Quantification of initial CNC migration. Indicated is the surface ratio of explants 4 hr versus 0 hr after plating. 12 explants were analyzed per sample. (G) Scheme of adhesion experiment. Upon injection of eGFP mRNA, CNC explants were dissociated in Ca2+- and Mg2+-free medium, and single cells were cultured on a fibronectin plate. (H–K) Single eGFP-labeled CNC cells after 1 hr culture. Note adhering cells with extended cytoplasmic processes (filled arrowheads) in control sample and after co-injection with control-MO, whereas HtrA1 mRNA and SerpinE2-MO prevent adhesion causing injected cells to acquire a round phenotype (open arrowheads). Scale bar, 0.02 mm. (L) Quantification of CNC adhesion. Indicated is the ratio of adherent cells relative to the control. Analysis of n>1600 cells from at least six explants per sample. CNC, cranial neural crest; eGFP, enhanced green fluorescent protein. Embryos were injected with 100 pg mRNAs and 40 ng MOs. Data in all graphs are displayed as mean ± SD, n = 2; **p<0.01, ****p<0.0001, unpaired t-test.
Figure 5—video 1
Collective migration of neural crest (NC) cells in vitro.
Embryos were injected into the animal pole at the four-cell stage with 40 ng standard control morpholino oligonucleotide. The cranial NC was explanted at stage 16/17, plated on fibronectin and imaged 7 hr after culture. Filming was done for 20 min. Note that cells at the leader front of the cluster extend lamellipodia and filopodia. Scale bar, 10 μm.
Figure 5—video 2
Knockdown of SerpinE2 prevents adhesion and migration of neural crest (NC) cells.
Embryos were injected into the animal pole at the four-cell stage with 40 ng SerpinE2 morpholino oligonucleotides. The cranial NC was explanted at stage 16/17, plated on fibronectin and imaged 7 hr after culture. Filming was done for 10 min. Note that cells acquire a ball-like shape and freely float around. Scale bar, 10 μm.
Figure 6 with 2 supplements
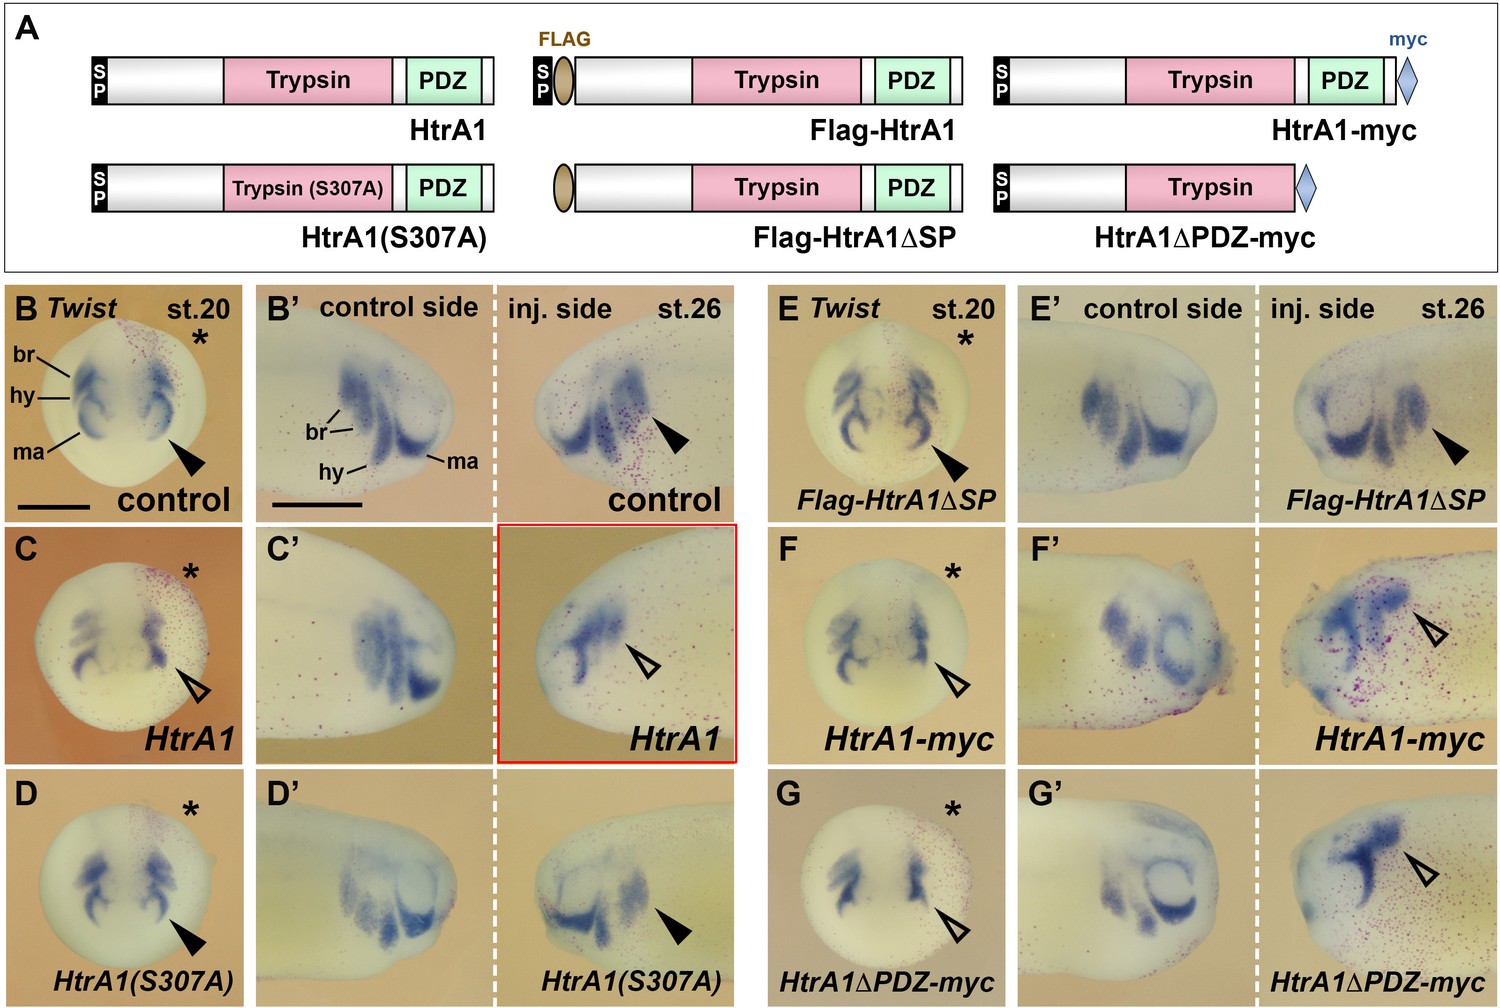
HtrA1 inhibits neural crest (NC) migration as an extracellular protease.
Embryos were injected into a single dorsal animal blastomere at the eight-cell stage. A star labels the injected side.Twist expression demarcates the NC in embryos at stage 20 (B–G; anterior view) and stage 26 (B’–G’; lateral view). (A) Overview of wild-type (top) and mutant (bottom) HtrA1 protein constructs. (B–E’) HtrA1 mRNA, but neither HtrA1(S307A) nor Flag-HtrA1ΔSP mRNAs, reduces epithelial-mesenchymal transition (EMT) and migration of NC cells on the injected side (arrowheads). Note that the diffusible HtrA1 protein reduces NC cell migration to a lower extent also on the non-injected side. (F–G’) Both HtrA1-myc and HtrA1ΔPDC-myc mRNAs reduce NC EMT and migration. br, branchial segments; hy, hyoid segment; ma, mandibular segment. Injected mRNA doses per embryos are 65 pg. Scale bars, 0.5mm. For quantification of NC migration defects, see Figure 6—figure supplement 1A and B.
Figure 6—figure supplement 1

HtrA1 mRNA inhibits neural crest (NC) migration in a concentration-dependent manner.
If not otherwise indicated, embryos were injected with 65 pg HtrA1-derived mRNAs into a single dorsal animal blastomere at the eight-cell stage. Quantification of epithelial-mesenchymal transition (EMT) and migration of Twist+ NC cells in embryos at stages 20 and 26. Defects were assessed based on a comparison of injected embryos and non-injected control siblings. Normal phenotypes are distinguished from phenotypes with either mild or strong defects in NC cell migration. A mild defect is defined as a reduction by more than 25% in at least one NC segment. A strong defect is a reduction by more than 50% in all NC segments. The number of analyzed embryos per sample is indicated above the columns. At least two experiments were done. (A, B) Following dorsal injection, HtrA1 mRNA blocks EMT and cell migration of NC cells in a dose-dependent manner. Note that HtrA1-myc and HtrA1ΔPDZ-myc mRNAs cause migration defects with a similar strength, whereas HtrA1(S307A) and Flag-HtrA1ΔSP mRNAs have only little effects. (C, D) Ventral injection of HtrA1 mRNA cause relatively mild NC migration defects.
Figure 6—figure supplement 2
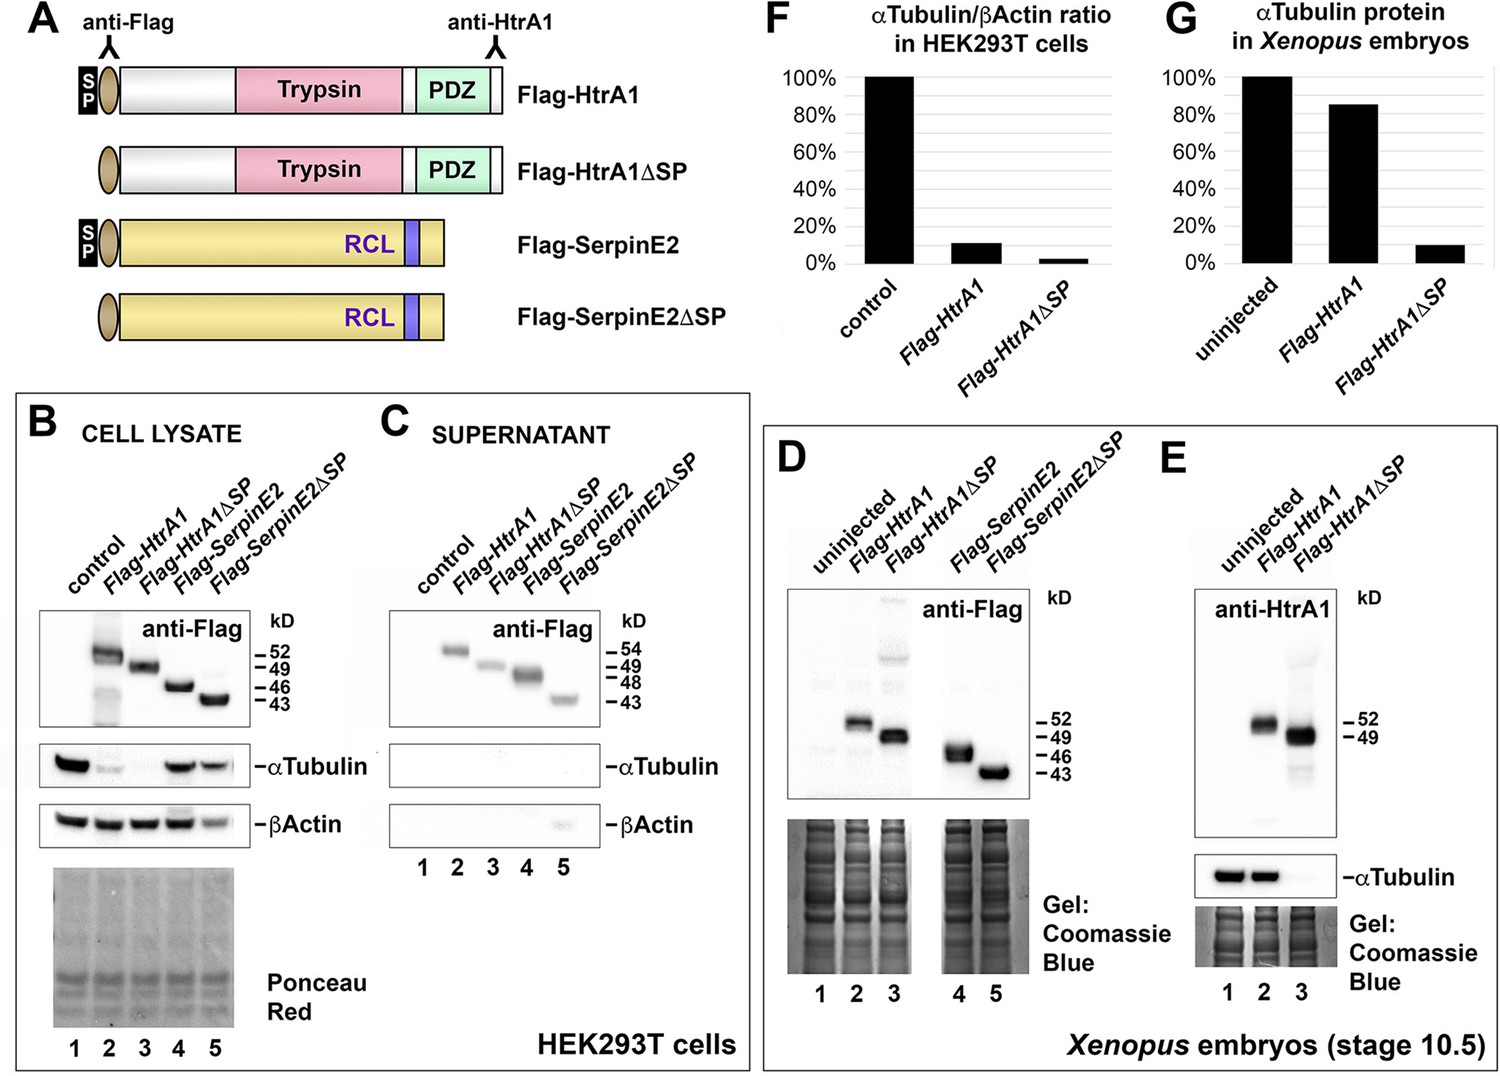
Cytoplasmic HtrA1 causes reduction of αTubulin protein levels in mammalian cells and Xenopus embryos.
(A) Schematic representation of the protein constructs. Indicated are antibody binding sites. RCL, reactive center loop; SP, signal peptide. (B, C) Western blot analysis of cell lysate and culture supernatants. HEK293T cells were transiently transfected with pCS2 vector constructs containing Flag epitope-tagged cDNAs encoding HtrA1, HtrA1ΔSP, SerpinE2, and SerpinE2ΔSP. Note that Flag-HtrA1 and Flag-SerpinE2 have higher molecular weights in the supernatant (54 and 48 kD) than in the cell lysate (52 and 46 kD), indicating that these proteins are glycosylated in the secretory pathway. Flag-HtrA1ΔSP and Flag-SerpinE2ΔSP are less abundant in the supernatant, and their molecular weights (49 and 43 kD) the same as in the cell lysate, suggesting that these signal peptide-deficient proteins are not secreted and their low levels in the supernatant likely due to cell lysis. Empty vector was used as negative control. Ponceau Red staining of membrane shows equal amounts of protein in the lysate samples. (D, E) Western blot analysis of Xenopus embryos at stage 10.5. Embryos were injected into the animal pole at the four- to eight-cell stage. Injected mRNA doses per embryo were 320 pg (HtrA1-derived) and 4 ng (SerpinE2-derived). Coomassie blue staining shows equal protein loading in the gels. (F, G) Quantification of αTubulin protein levels relative to βActin in HEK293T cells (F) and relative to Ponceau Red staining in Xenopus embryos at stage 10.5 (G). Experiments were done at least twice.
-
Figure 6—figure supplement 2—source data 1
Uncropped western blots of HEK293T cell lysates after transfection of Flag-tagged HtrA1, HtrA1ΔSP, SerpinE2, and SerpinE2ΔSP cDNAs.
- https://cdn.elifesciences.org/articles/91864/elife-91864-fig6-figsupp2-data1-v1.pdf
-
Figure 6—figure supplement 2—source data 2
Uncropped western blots of HEK293T cell supernatants after transfection of Flag-tagged HtrA1, HtrA1ΔSP, SerpinE2, and SerpinE2ΔSP cDNAs.
- https://cdn.elifesciences.org/articles/91864/elife-91864-fig6-figsupp2-data2-v1.pdf
-
Figure 6—figure supplement 2—source data 3
Uncropped gels and western blots of Xenopus embryo lysates after injection of Flag-tagged HtrA1, HtrA1ΔSP, SerpinE2, and SerpinE2ΔSP mRNAs.
- https://cdn.elifesciences.org/articles/91864/elife-91864-fig6-figsupp2-data3-v1.pdf
Figure 7 with 1 supplement

SerpinE2 and HtrA1 interact with Syndecan-4 (Sdc4) in neural crest (NC) cell migration.
mRNAs were injected into one dorsal animal blastomere at the eight-cell stage. Embryos are shown in anterior view (stage 20, injected side labeled with a star, B–G) and lateral view (stage 26, B’–G’). (A) Overview of wild-type (left) and mutant (right) SerpinE2 protein constructs. (B, B’) 4 ng Flag-SerpinE2 mRNA has no effect on the migration of Twist+ NC cells (filled arrowheads). (C, C’) Flag-HtrA1 inhibits NC cell migration robustly on the injected sides (open arrowheads). (D–F’) SerpinE2 mRNA, but neither Flag-SerpinE2ΔSP nor SerpinE2pm mRNA, rescues normal epithelial-mesenchymal transition (EMT) and migration of NC cells upon co-injection with Flag-HtrA1. (G, G’) Sdc4 mRNA restores normal NC migration in Flag-HtrA1-injected embryos. If not otherwise indicated, injected mRNA doses per embryos are 65 pg (Flag-HtrA1), 333 pg (Flag-SerpinE2 derived constructs), and 450 pg (Sdc4). Scale bars, 0.5mm. For quantification of NC migration defects, see Figure 7—figure supplement 1A and B.
Figure 7—figure supplement 1
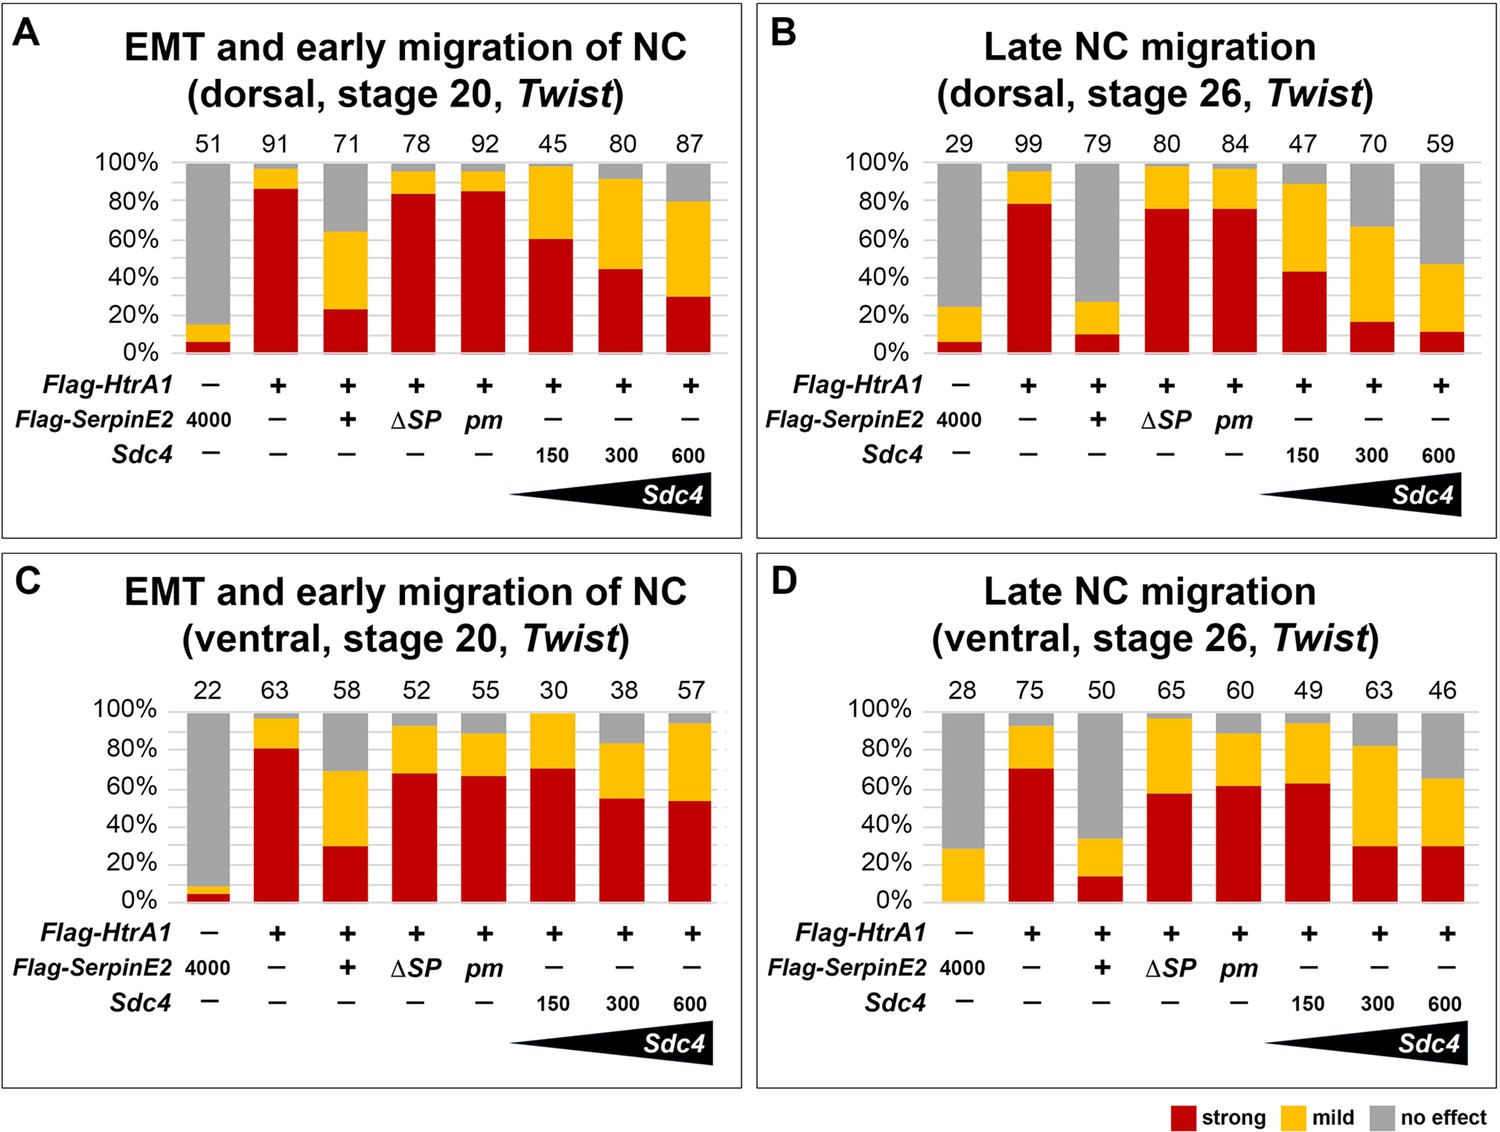
SerpinE2 and Sdc4 mRNAs partially rescue neural crest (NC) migration defects that are induced by HtrA1 overexpression.
Quantification of epithelial-mesenchymal transition (EMT) and migration of Twist+ NC cells in embryos at stages 20 and 26. Defects were assessed based on a comparison of injected embryos and non-injected control siblings. The number of analyzed embryos per sample is indicated above the columns. Note that secreted Flag-SerpinE2, but not the cytosolic Flag-SerpinE2ΔSP and mutant Flag-SerpinE2pm constructs, revert NC migration defects in Flag-HtrA1 mRNA-injected embryos. (A, B) Dorsal injection of Sdc4 mRNA rescues Flag-HtrA1-induced migration defects in a dose-dependent manner. (C, D) Sdc4 mRNA is less efficient in rescuing NC migration upon ventral co-injection with Flag-HtrA1 mRNA. Embryos were injected into one animal blastomere at the eight-cell stage with mRNA doses of 65 pg (Flag-HtrA1) and 200 pg (SerpinE2-derived). Indicated Sdc4 mRNA amounts per embryo are in pg. Experiments were done at least three times. Sdc4, Syndecan-4.
Figure 8 with 1 supplement
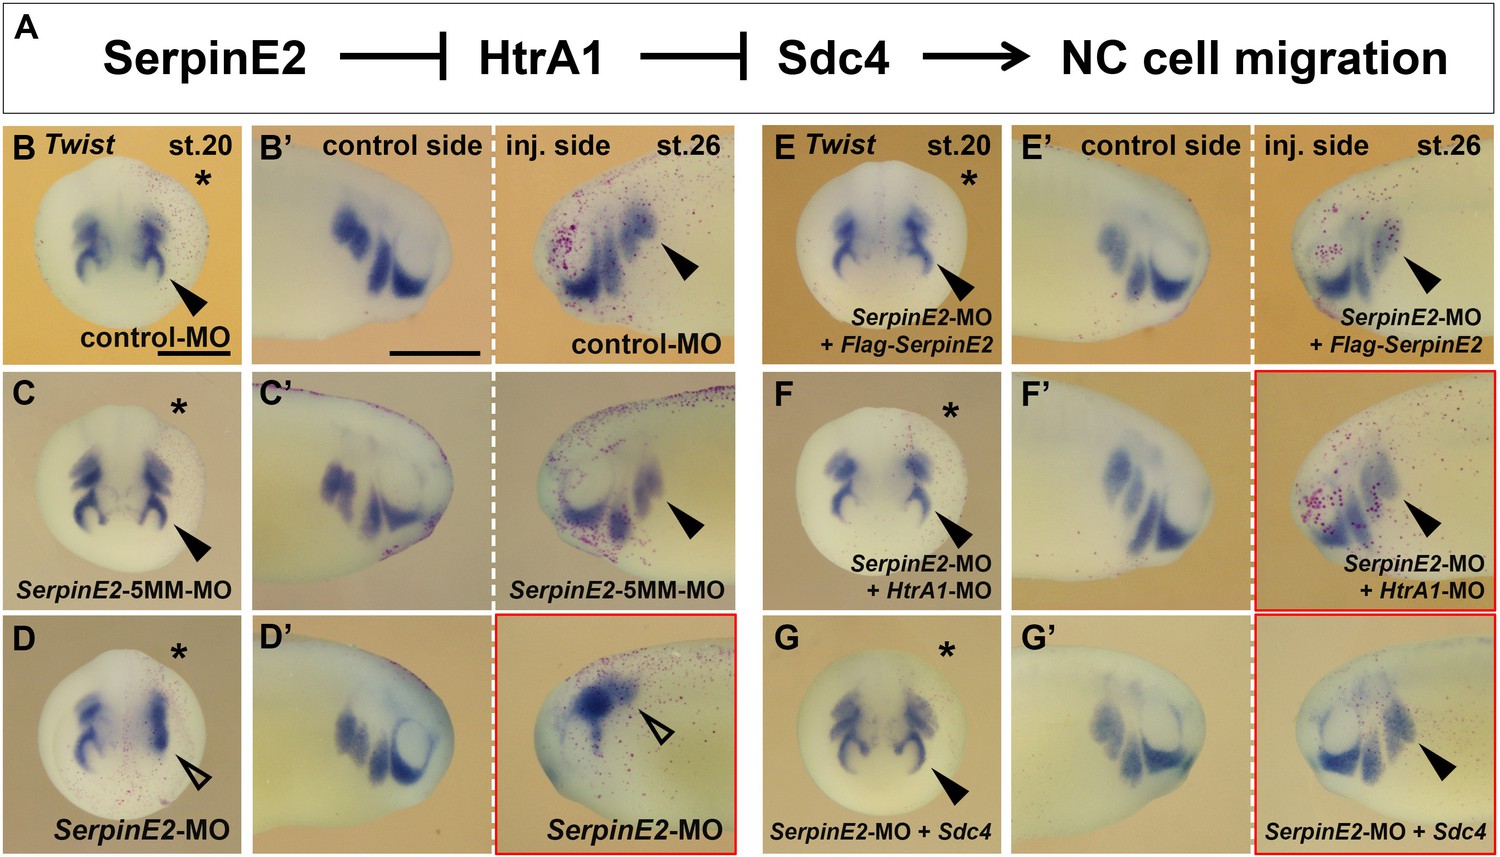
SerpinE2 functions in neural crest (NC) cell migration in an HtrA1- and Syndecan-4 (Sdc4)-dependent manner.
mRNAs and morpholino oligonucleotides (MOs, 10 ng) were injected into one dorsal animal blastomere at the eight-cell stage. Embryos are shown in anterior view (stage 20, injected side labeled with a star, B–G) and lateral view (stage 26, B’–G’). (A) Proposed mechanism for the regulation of NC migration by SerpinE2, HtrA1, and Sdc4. (B–D’) SerpinE2-MO blocks epithelial-mesenchymal transition (EMT) and migration of Twist+ NC cells (arrow) on the injected side, while control-MO and SerpinE2-5MM-MO have no effect. (E–G’) Flag-SerpinE2 mRNA, HtrA1-MO, and Sdc4 mRNA restore normal NC migration in SerpinE2-morphant embryos. Injected mRNA doses per embryos are 333 pg (Flag-SerpinE2) and 450 pg (Sdc4). Scale bars, 0.5mm. For quantification of NC migration defects, see Figure 8—figure supplement 1A and B.
Figure 8—figure supplement 1
SerpinE2-MO causes neural crest (NC) migration defects which are rescued by HtrA1-MO and Sdc4 mRNA.
Epithelial-mesenchymal transition (EMT) and NC migration defects were quantified in embryos at stages 22 and 26 after whole-mount in situ hybridization with the NC marker Twist. Defects were assessed based on a comparison between the injected and non-injected side within the same specimen. Normal phenotypes were distinguished from phenotypes with either mild or strong defects in NC cell migration. A mild defect is defined as a reduction by more than 25% in at least one NC segment. A strong defect is a reduction by more than 50% in all NC segments. The number of analyzed embryos per sample is indicated above the columns. (A, B) Dorsal injection of SerpinE2-MO blocks EMT and migration of NC cells, while control-MO and SerpinE2-5MM-MO have no or only little effect. Flag-SerpinE2 mRNA, HtrA1-MO, and Sdc4 mRNA restore normal NC migration in SerpinE2-morphant embryos. (C, D) Upon ventral injection, SerpinE2-MO mildly blocks EMT and migration of NC cells. Morpholino oligonucleotides (MOs, 10 ng) and mRNAs were injected into one animal blastomere at the eight-cell stage. Injected mRNA doses per embryos were 333 pg (Flag-SerpinE2) and 300 pg (Sdc4). Experiments were done at least three times. Sdc4, Syndecan-4.
Figure 9
Model for a proteolytic pathway of SerpinE2 and HtrA1 that regulates collective neural crest migration.
(A) SerpinE2 stimulates collective NC migration by a double-inhibitory mechanism involving the secreted serine protease HtrA1 and its proteolytic substrates Syndecan-4 and fibronectin. (B) Opposing gradients of SerpinE2 and HtrA1 activities regulate the directed migration in a collective of NC cells. The SerpinE2/HtrA1 pair contributes to the formation of a chemoattractant gradient that guides the NC stream toward a source of FGF signals in the target tissue. High SerpinE2 and low HtrA1 levels coincide with abundant focal adhesion sites and polymerized actin that drive mesenchymal migration at the leading edge. (C) SerpinE2 anchored to the heparan sulfate chains of the transmembrane proteoglycan Syndecan-4 protects the integrity of focal adhesions at the leading front and allows collective cell migration to occur (left side). Unbound HtrA1 triggers the proteolytic cleavage of Syndecan-4 and degrades the matrix protein fibronectin (middle), causing loss of cell-matrix adhesion at the rear end of the NC cell collective (right side). FGF, fibroblast growth factor; HS, heparan sulfate; NC, neural crest; Sdc4, Syndecan-4.
Tables
Key resources table
| Reagent type (species) or resource | Designation | Source or reference | Identifiers | Additional information |
|---|---|---|---|---|
| Cell line (Homo sapiens) | HEK293T | TakaraBio | Cat# 632180 | Used for transient transfection and protein production |
| Biological sample (X. laevis, male) | Sperm | Nasco | Cat# LM00715M | Used for in vitro fertilization |
| Biological sample (X. laevis, male) | Sperm | Xenopus 1 | Cat# 5215 | Albino; used for in vitro fertilization |
| Biological sample (X. laevis, female) | Egg | Nasco | Cat# LM00535M | Used for in vitro fertilization |
| Biological sample (X. laevis, female) | Egg | Nasco | Cat# LM00510M | Albino; used for in vitro fertilization |
| Biological sample (X. laevis, female) | Egg | Xenopus 1 | Cat# 4280 | Used for in vitro fertilization |
| Antibody | Anti-flag M2-Peroxidase (HRP) (Mouse monoclonal) | Sigma-Aldrich | Cat# A8592 | WB (1:1000) |
| Antibody | Anti-αTubulin (Mouse monoclonal) | Sigma-Aldrich | Cat# T5168 clone B-5-1-2 | WB (1:1000) |
| Antibody | Anti-βActin (Mouse monoclonal) | Sigma-Aldrich | Cat# A5441 clone AC-15 | WB (1:10,000) |
| Antibody | Anti-HtrA1 (Rabbit polyclonal) | Hou et al., 2007 PMID:17681134 | Immuno-purified GST5057, G22-7 | WB (1:2500) |
| Antibody | Mouse IgG HRP (Goat polyclonal) | R&D Systems | Cat# AF007 | WB (1:2000) |
| Antibody | Rabbit IgG HRP (Goat polyclonal) | R&D Systems | Cat# HAF008 | WB (1:2000) |
| Commercial assay or kit | NucleoBond PC 100, Midi Kit | Macherey-Nagel | Cat# 740573.100 | DNA purification |
| Commercial assay or kit | NucleoSpin Gel and PCR Clean-up, Mini kit | Macherey-Nagel | Cat# 740609.50 | DNA purification |
| Commercial assay or kit | mMessage mMachine SP6 Transcription kit | Invitrogen | Cat# AM1340 | mRNA synthesis |
| Commercial assay or kit | RNeasy Mini Kit | QIAGEN | Cat# 74104 | RNA purification |
| Commercial assay or kit | Pierce BCA Protein Assay Kit | Thermo Fisher Scientific | Cat# 23225 | Protein measurement |
| Chemical compound, drug | Pfu DNA Polymerase | Thermo Fisher Scientific | Cat# EP0572 | DNA synthesis |
| Chemical compound, drug | Lipofectamin 3000 Transfection Reagent | Thermo Fisher Scientific | Cat# L3000001 | Transfection |
| Chemical compound, drug | RIPA Lysis and Extraction Buffer | Thermo Fisher Scientific | Cat# 89901 | Protein purification |
| Chemical compound, drug | Halt Protease and Phosphatase Inhibitor Cocktail | Thermo Fisher Scientific | Cat# 78442 | Protein purification |
| Chemical compound, drug | cOmplete, EDTA-free Protease Inhibitor Cocktail | Roche | Cat# 11873580001 | Protein purification |
| Chemical compound, drug | Bolt Bis-Tris Plus Mini Protein Gels, 4–12% | Thermo Fisher Scientific | Cat# NW04125BOX | Protein electrophoresis |
| Chemical compound, drug | Bolt Sample Reducing Agent (10×) | Thermo Fisher Scientific | Cat# B0009 | Protein electrophoresis |
| Chemical compound, drug | Bolt LDS Sample Buffer (4×) | Thermo Fisher Scientific | Cat# B0007 | Protein electrophoresis |
| Chemical compound, drug | Bolt MES SDS Running Buffer (20×) | Thermo Fisher Scientific | Cat# B0002 | Protein electrophoresis |
| Chemical compound, drug | PageRuler Prestained Protein Ladder, 10–180 kDa | Thermo Fisher Scientific | Cat# 26616 | Protein electrophoresis |
| Chemical compound, drug | Ponceau S Solution | Sigma-Aldrich | Cat# P7170 | Western blotting |
| Chemical compound, drug | Pierce ECL Western Blotting Substrate | Thermo Fisher Scientific | Cat# 32106 | Western blotting |
| Chemical compound, drug | Restore PLUS Western Blot Stripping Buffer | Thermo Fisher Scientific | Cat# 46430 | Western blotting |
| Chemical compound, drug | Human Plasma Fibronectin Purified Protein | Sigma-Aldrich | Cat# FC010 | Neural crest explant culture |
| Chemical compound, drug | Gentamycin Solution | Sigma-Aldrich | Cat# G1272 | Embryo culture |
| Software, algorithm | ImageJ | NIH https://imagej.net/ij/ | RRID:SCR_003070 | Neural crest explant measurement |
| Software, algorithm | AxioVision 4.8 | Zeiss https://www.zeiss.com/ | RRID:SCR_002677 | Neural crest explant imaging |
| Other | 35 mm Dish, No. 0 Coverslip, 10 mm Glass Diameter, uncoated | MatTek | Cat# P35G-0-10C | Neural crest explant culture, time-lapse imaging |
| Other | Vivaspin 2 MWCO 10,000 | Cytiva | Cat# 28932247 | Protein concentration |
| Other | iBlot Transfer Stack, PVDF, mini | Thermo Fisher Scientific | Cat# IB401002 | Western blotting |
Additional files
Download links
A two-part list of links to download the article, or parts of the article, in various formats.
Downloads (link to download the article as PDF)
Open citations (links to open the citations from this article in various online reference manager services)
Cite this article (links to download the citations from this article in formats compatible with various reference manager tools)
Inhibition of the serine protease HtrA1 by SerpinE2 suggests an extracellular proteolytic pathway in the control of neural crest migration
eLife 12:RP91864.
https://doi.org/10.7554/eLife.91864.3


