MELK is an oncogenic kinase essential for mitotic progression in basal-like breast cancer cells
- Dana-Farber Cancer Institute, United States
- Harvard Medical School, United States
- Novartis Institutes for Biomedical Research, United States
- Harvard University, United States
Figures
Figure 1 with 2 supplements
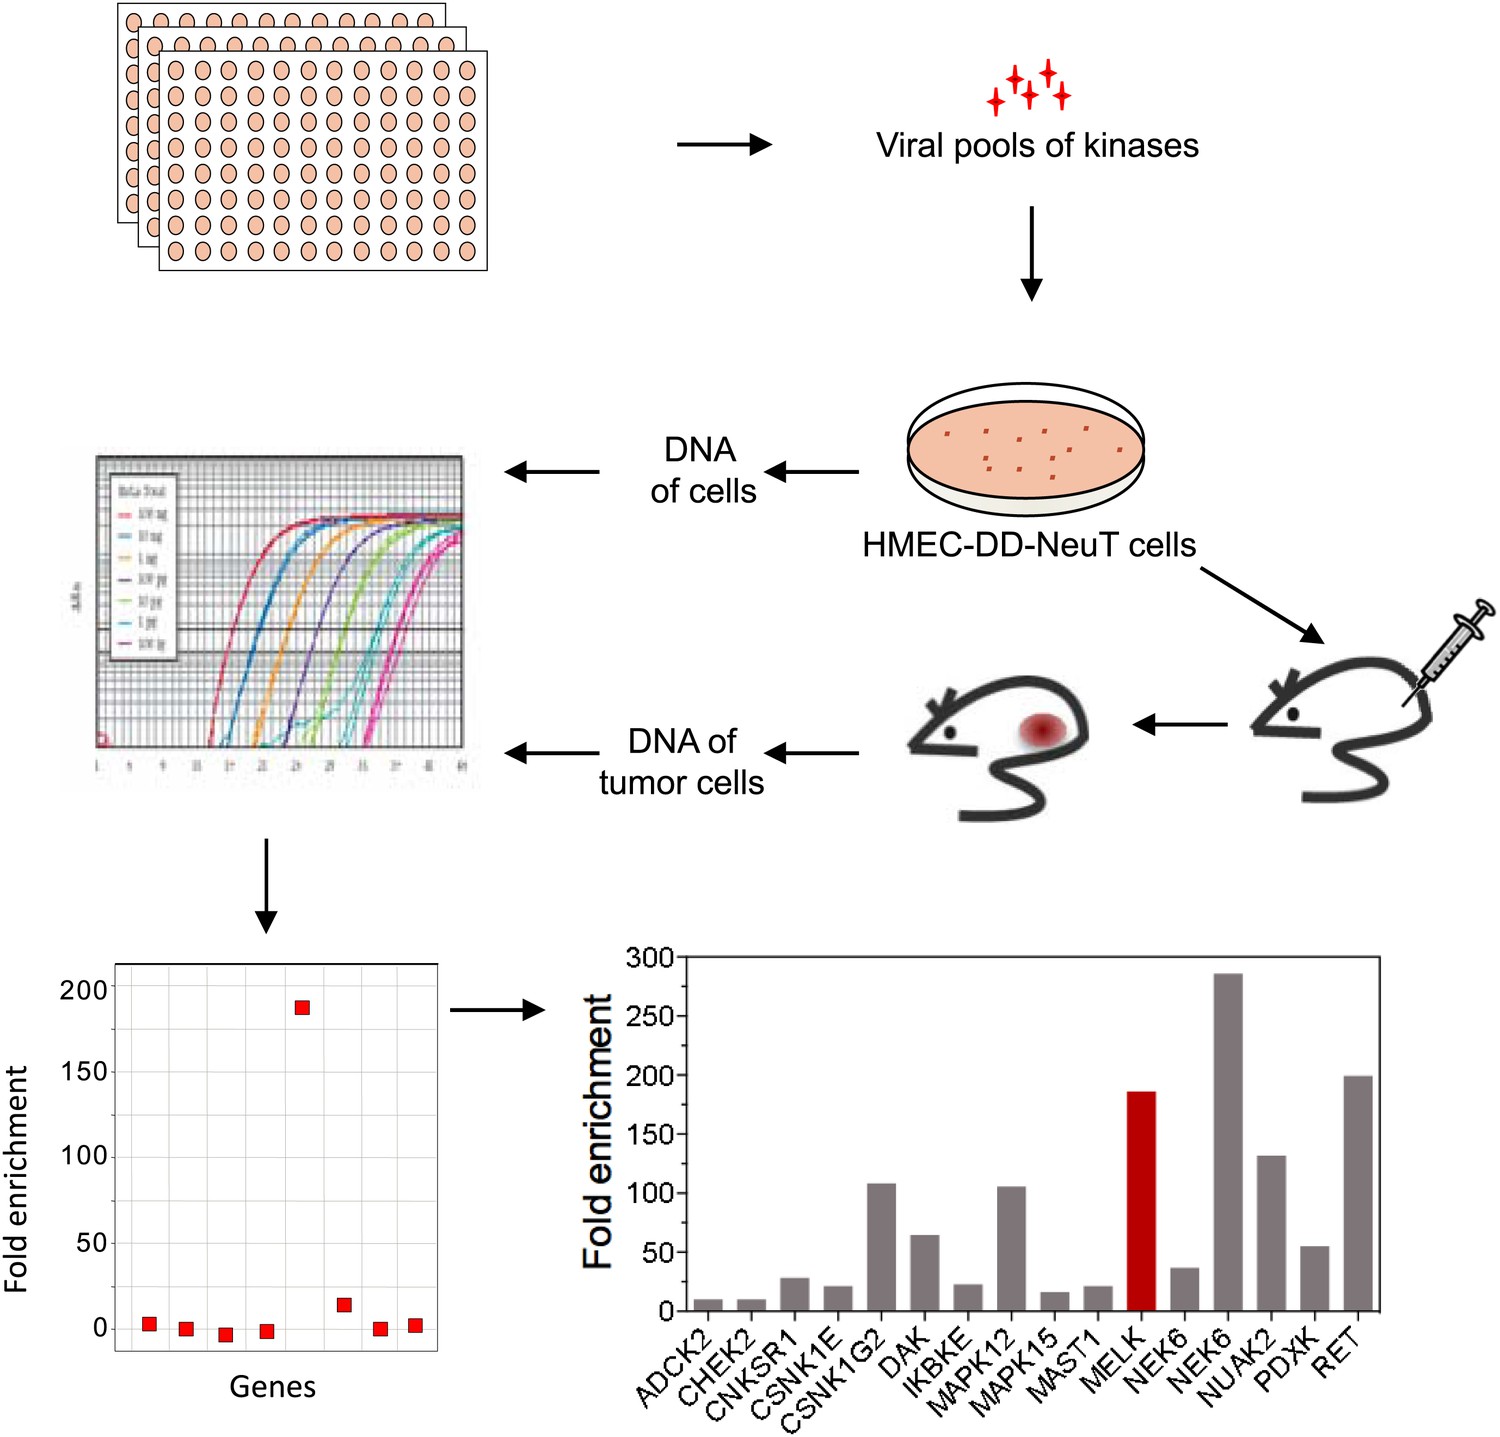
An in vivo kinome-wide screen identifies MELK as a potential oncogenic kinase.
Pools of retroviral vectors encoding 354 human kinases and kinase-related proteins (37 pools in total, each consisting of 10–12 unique open reading frames) were transduced into HMED-DD-NeuT cells. After selection with neomycin, cells were transplanted into mammary fat pads of nude mice. Tumors that formed from HMECs infected with 12 pools of kinases were harvested, and genomic DNA was extracted. qPCR was performed on genomic DNA from the tumor specimens and cells infected with matched pools of kinases before injection. The relative fold enrichment was calculated from the differences in Ct value.
Figure 1—figure supplement 1
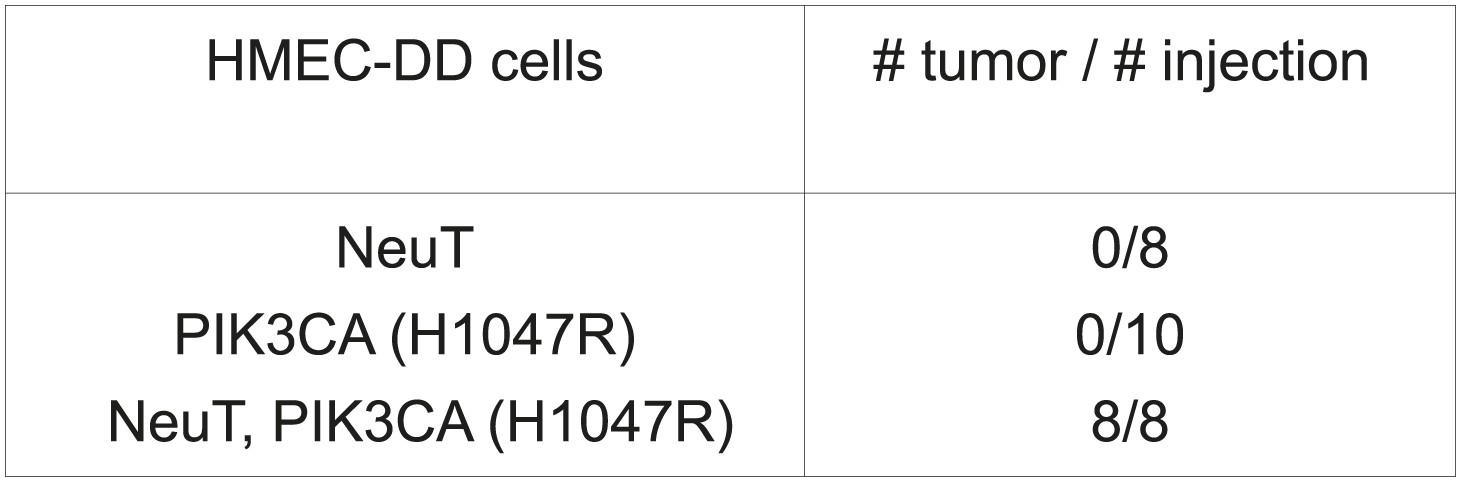
Development of an in vivo tumorigenesis model.
In telomerase-immortalized human mammary epithelial cells expressing p53DD (HMEC-DD), expression of two potent oncogenes (such as NeuT, PIK3CA [H1047R]) is required to induce these cells to form orthotopic tumors with 100% penetrance.
Figure 1—figure supplement 2

Screen hits and their gene description.
https://doi.org/10.7554/eLife.01763.005
Figure 2 with 2 supplements
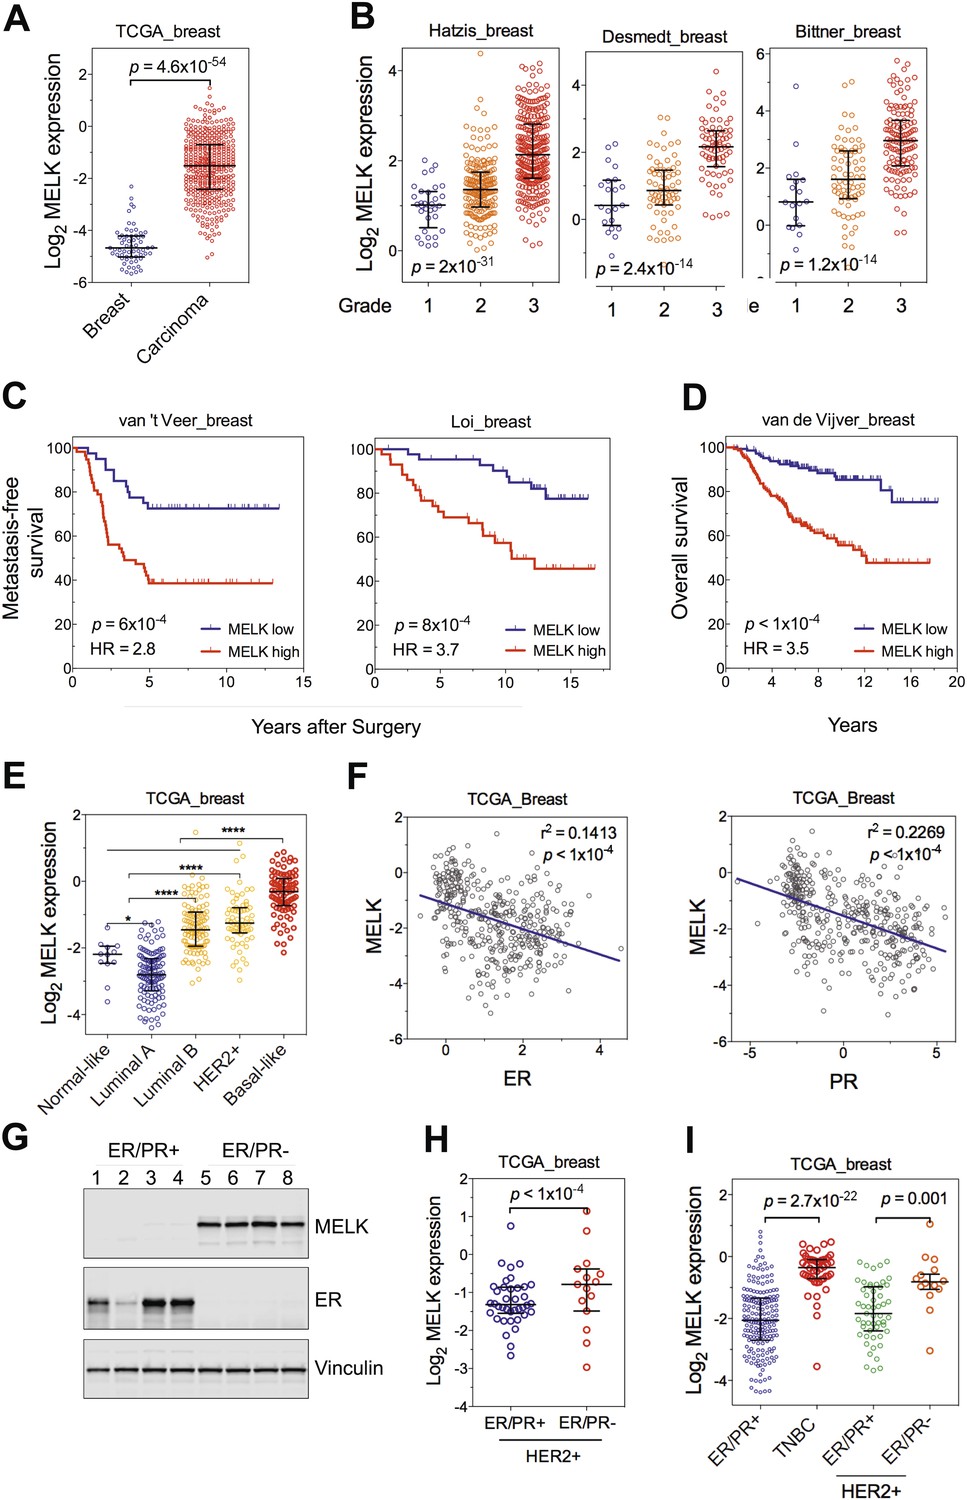
MELK is highly overexpressed in breast cancer and its overexpression strongly correlates with poor prognosis.
(A) MELK expression levels are significantly higher in breast carcinoma (n = 392, red circles) than in normal breast tissues (n = 61, blue circles) in the TCGA breast cancer cohort (Cancer Genome Atlas Network, 2012). Black lines in each group indicate median with interquartile range. p=4.6 × 10−54 (Student's t test). (B) Expression level of MELK tightly correlates with the pathological grade of breast tumors in the three independent cohorts for which these data are available. Black lines in each group indicate median with interquartile range. p values were calculated with one-way ANOVA. (C) Kaplan–Meier analysis of metastasis-free survival of breast cancer patients in two independent cohorts. Samples were divided into two groups with high and low expression levels of MELK. p values were obtained from the log-rank test. Hazard ratio (HR) was calculated using GraphPad Prism. (D) Kaplan–Meier analysis of overall survival in the van de Vijver cohort breast cancer patients. Samples were divided as in (C). Log-rank p value and hazard ratio (HR) are shown. (E) MELK expression among the molecular subtypes of breast cancer. Samples in each cohort were classified into five distinct molecular subtypes using PAM50 (Parker et al., 2009). Black lines in each group indicate median with interquartile range. (F) MELK expression inversely correlates with that of estrogen receptor (ER) or progesterone receptor (PR). Linear regression was determined using GraphPad Prism. The linear regression Pearson's correlation coefficient (R2) and its p value are indicated. (G) ER/PR− breast tumors have higher abundance of MELK protein than ER/PR+ ones. Lysates of primary human tumors were subjected to immunoblotting using the indicated antibodies. (H) Expression of ER/PR determines MELK expression within HER2+ breast cancer. Samples with molecular HER2+ status were classified into ER/PR+ and ER/PR− groups. Black lines in each group indicate median with interquartile range. (I) MELK expression in subtypes of breast cancer that are defined by ER/PR, and HER2 expression. Note that HER2+ tumors were divided into ER/PR+ and ER/PR− groups. *p<0.05, ****p<0.0001 (Student's t test).
Figure 2—figure supplement 1
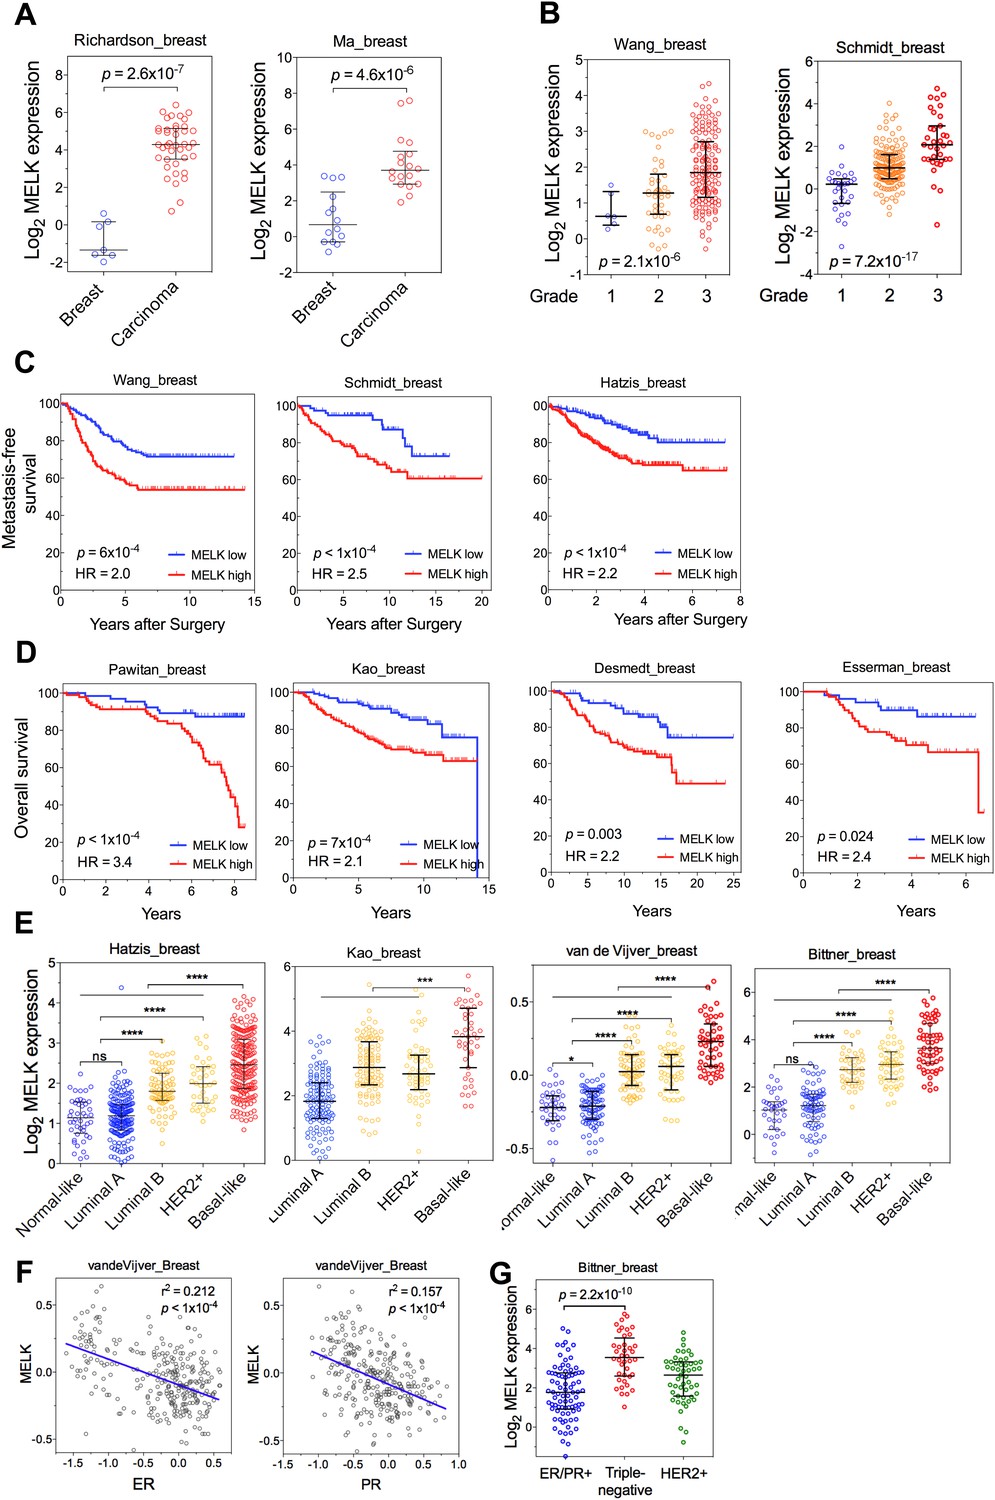
MELK is a top-ranking overexpressed gene in breast cancer and a strong prognostic indicator.
(A) MELK expresses at a higher level in breast tumors than in normal breast tissues. (B) MELK expression is positively correlated with the histologic grade of disease. The indicated p values rank 7th (of total 19,574 genes measured, Bittner cohort) and 3rd (of total 12,624 genes measured, Hatzis cohort). (C) MELK expression predicts metastasis. Samples in the indicated cohorts were divided into groups of MELK high and MELK low, which represent the top 60% and bottom 40% in the descending order of MELK expression. Kaplan–Meier curves are shown, with log-rank p values and hazard ratios (HR). (D) High MELK expression predicts inferior overall survival of breast cancer patients. Samples were grouped into MELK high and low as in (D). p values were obtained from log-rank test, hazard ratio (HR) was calculated using GraphPad Prism.(E) MELK expression in subtypes of breast cancer that are defined by gene expression profiling. Samples were divided into subtypes based on PAM50 gene signature (Parker et al., 2009). ‘ns’ denotes not significant. ****p<0.0001. (F) MELK expression is reversely correlated with that of luminal marker (ER/PR). Linear regression was determined using GraphPad Prism. The linear regression Pearson's correlation coefficient (R2) and its p value are indicated. (G) Triple-negative breast cancer exhibits higher expression of MELK than ER/PR+ tumors. Patients were classified into groups with subtypes of diseases based on expression of ER/PR and HER2. All the data were downloaded from Oncomine (Rhodes et al., 2004), and were re-analyzed. The black lines in each panel (A, B, E, F) indicate median with interquartile range.
Figure 2—figure supplement 2
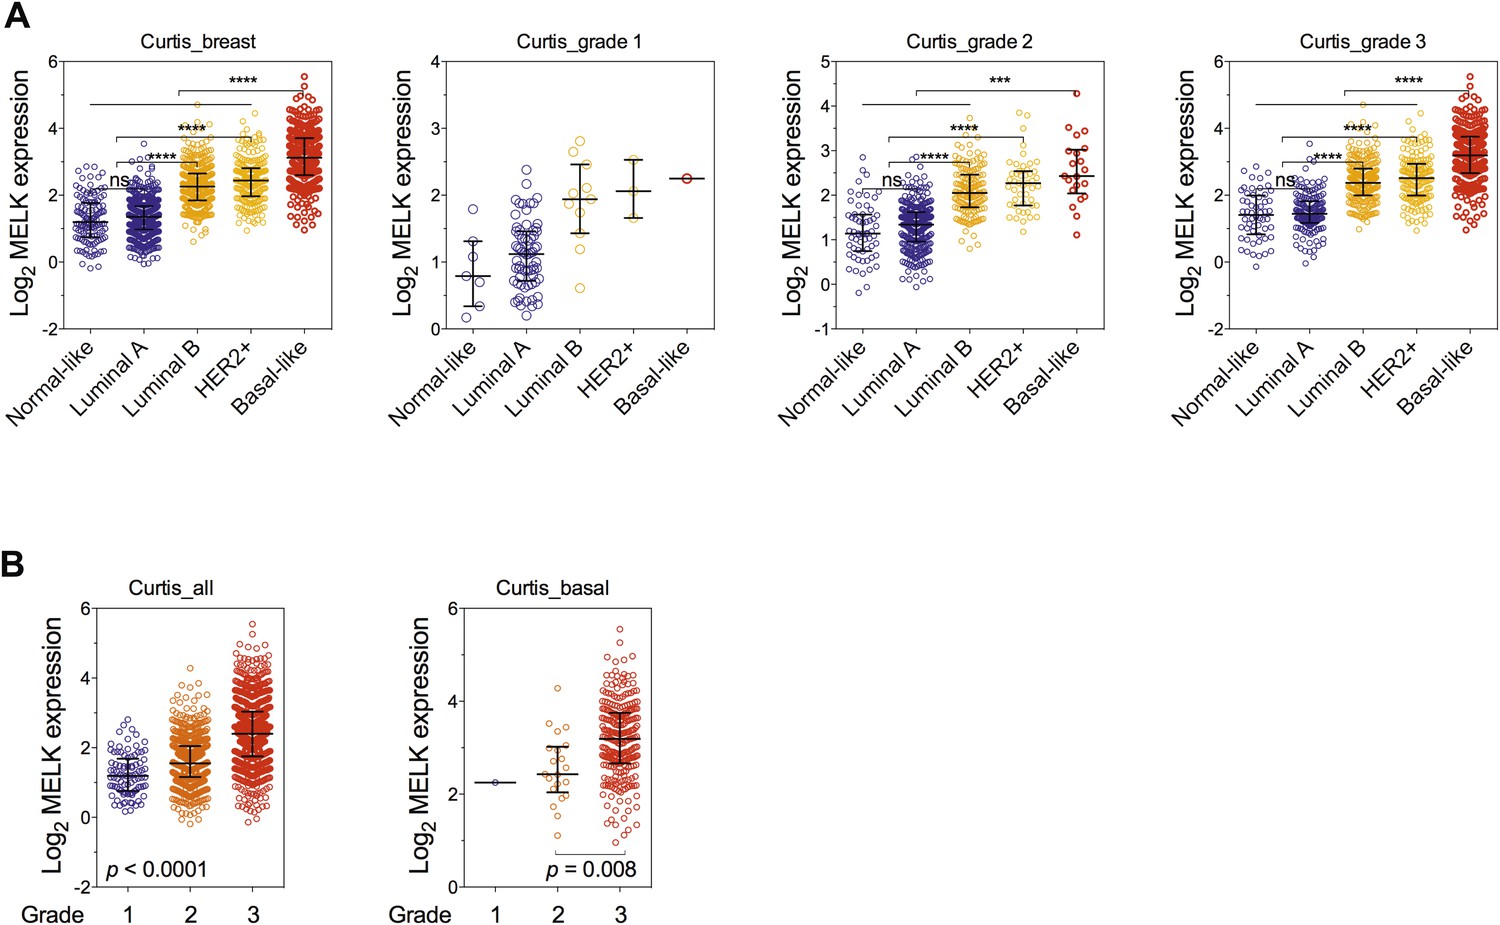
Correlation of MELK expression with breast cancer subtypes and the histologic grade of disease.
(A) Data of MELK expression and the histologic grade of disease among 1556 invasive ductal breast carcinoma (Curtis et al., 2012) were analyzed. Black lines in each group indicate median with interquartile range. ****p<0.0001 (Student's t test). Note that statistical analysis was not performed in grade 1 group, due to the limited number of HER2+ and basal-like breast cancer samples. (B) Data were analyzed in respect to the grade of disease. p values were calculated with one-way ANOVA. For the analysis of basal-like breast cancer, a Student's t test between grade 2 and grade 3 was used instead, due to a single sample characterized as grade 1.
Figure 3 with 3 supplements

FoxM1 is overexpressed in BBC and regulates the expression of MELK.
(A) High expression of FoxM1 in BBC. Samples in the indicated data sets were grouped into subtypes based on the PAM50 gene signature (Parker et al., 2009). ns, denotes not significant. *p<0.05, ****p<0.0001. (B) FoxM1 and MELK expression are tightly correlated. Expression of MELK was plotted against that of FoxM1. Each circle represents an individual sample of human breast carcinoma (n = 392 for TCGA dataset; n = 261 for Bittner dataset). Red and green circles represent basal-like breast tumors and all other subtypes of breast tumors, respectively. Correlation analysis was performed by GraphPad Prism. (C) FoxM1 knockdown suppresses MELK expression. Cells were transfected with either control siRNA or siRNA-targeting FoxM1. Lysates were harvested 3 days after transfection and subjected to immunoblotting. Aurora kinase A (AURKA), a known transcriptional target of FoxM1 (Lefebvre et al., 2010), was used as a positive control. (D) FoxM1 inhibition downregulates the expression of MELK. MDA-MB-231 cells were treated for the indicated time with vehicle or thiostrepton. Protein lysates were subjected to immunoblotting analysis of MELK and AURKA as indicated. (E) A putative FoxM1 binding site in the MELK promoter, and the FoxM1 consensus binding site (left). Numbers for the nucleotides are relative to the transcription start site (+1) of MELK. Chromatin immunoprecipitation assay of the MELK promoter in MDA-MB-468 cells (right). Control rabbit IgG and an antibody against FoxM1 were used. Primers for the promoter region of CDC25B were used as a positive control. (F) Cell cycle-dependent expression of MELK. MDA-MB-231 cells were treated with nocodazole (100 ng/ml) for 18 hr or not treated (Asynchronized, As). Nocodazole-arrested mitotic cells (M) were isolated by shake-off, and the attached cells enriched in G2 phase (G2) were harvested. A part of the mitotic cells were released into G1 phase after 4 hr of incubation (M + 4 hr). The left panel shows the flow cytometry analysis of cell cycle, and the right panel shows immunoblotting analysis of MELK and other cell cycle-specific proteins as indicated. (G) Expression of MELK and other mitotic factors during cell cycles in basal-like (MDA-MB-231) vs luminal (MCF7) breast cancer cells. Cell lysates were prepared as in (F).
Figure 3—figure supplement 1
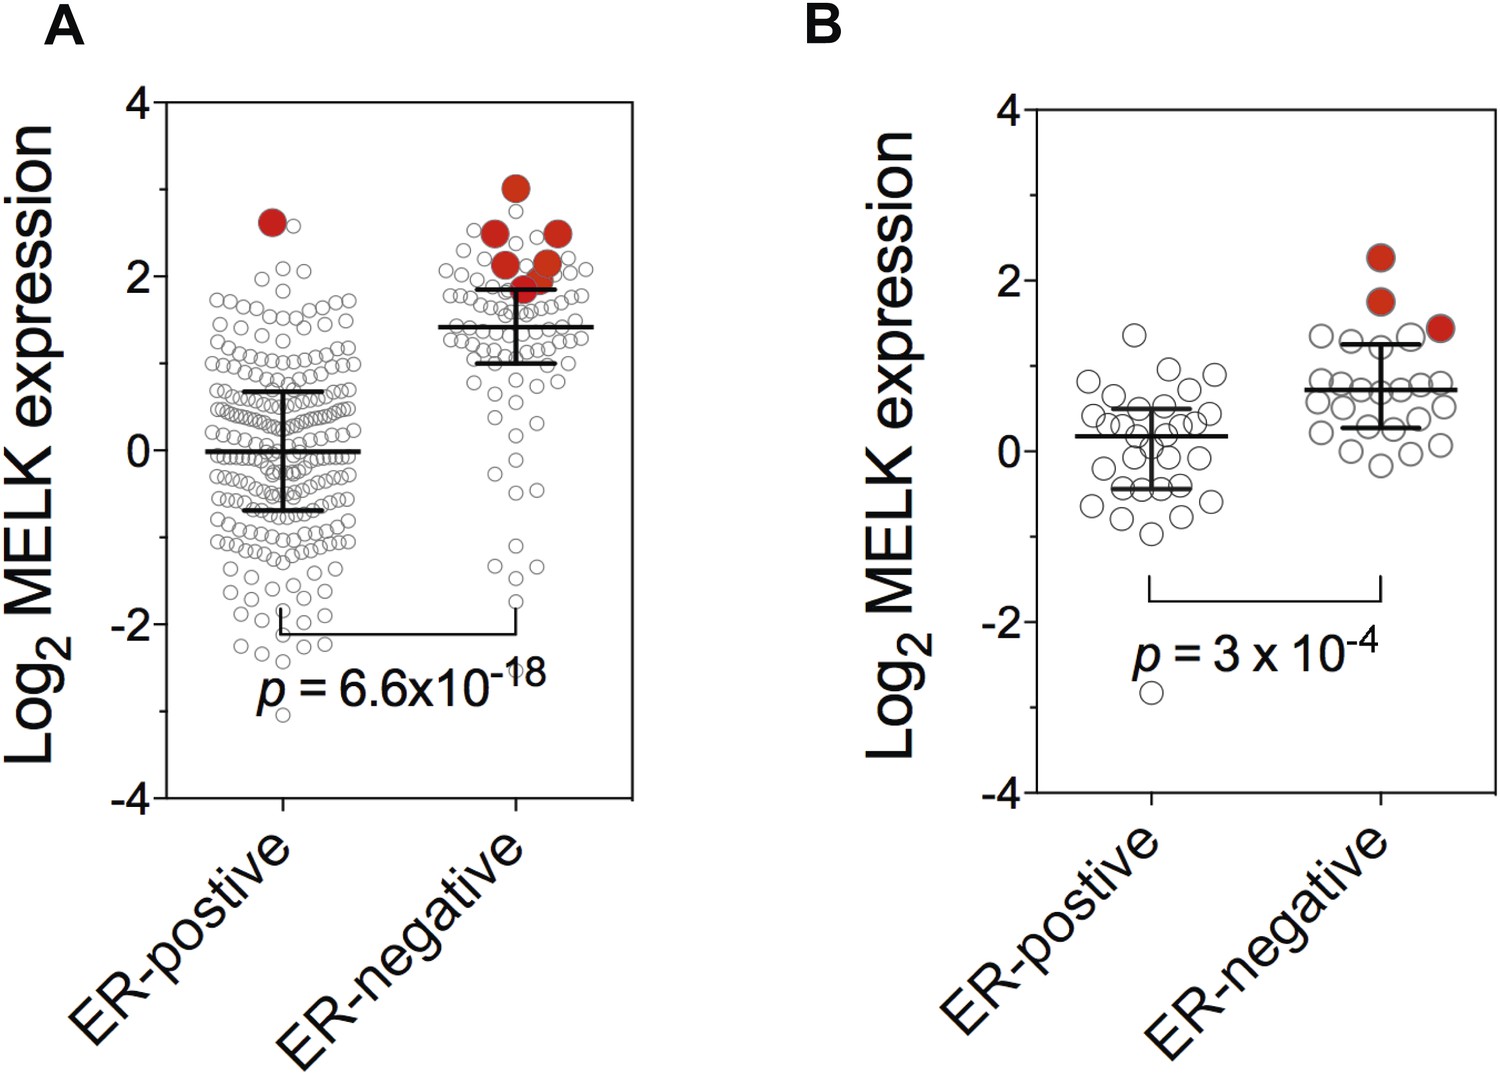
Gene amplification of MELK in BBC.
Gene expression of MELK among ER-positive and ER-negative invasive ductal breast carcinoma (A, n = 389; TCGA, 2012) and breast cancer cell lines (B, n = 55; Barretina et al., 2012). Red circles indicate samples with MELK gene amplified (defined as copy number >3). Note that samples with MELK amplification tend to have high expression level of MELK. Black lines in each group indicate median with interquartile range. p values from two-tailed Student's t test are shown.
Figure 3—figure supplement 2
FoxM1 is overexpressed in BBC and transcriptionally regulates MELK.
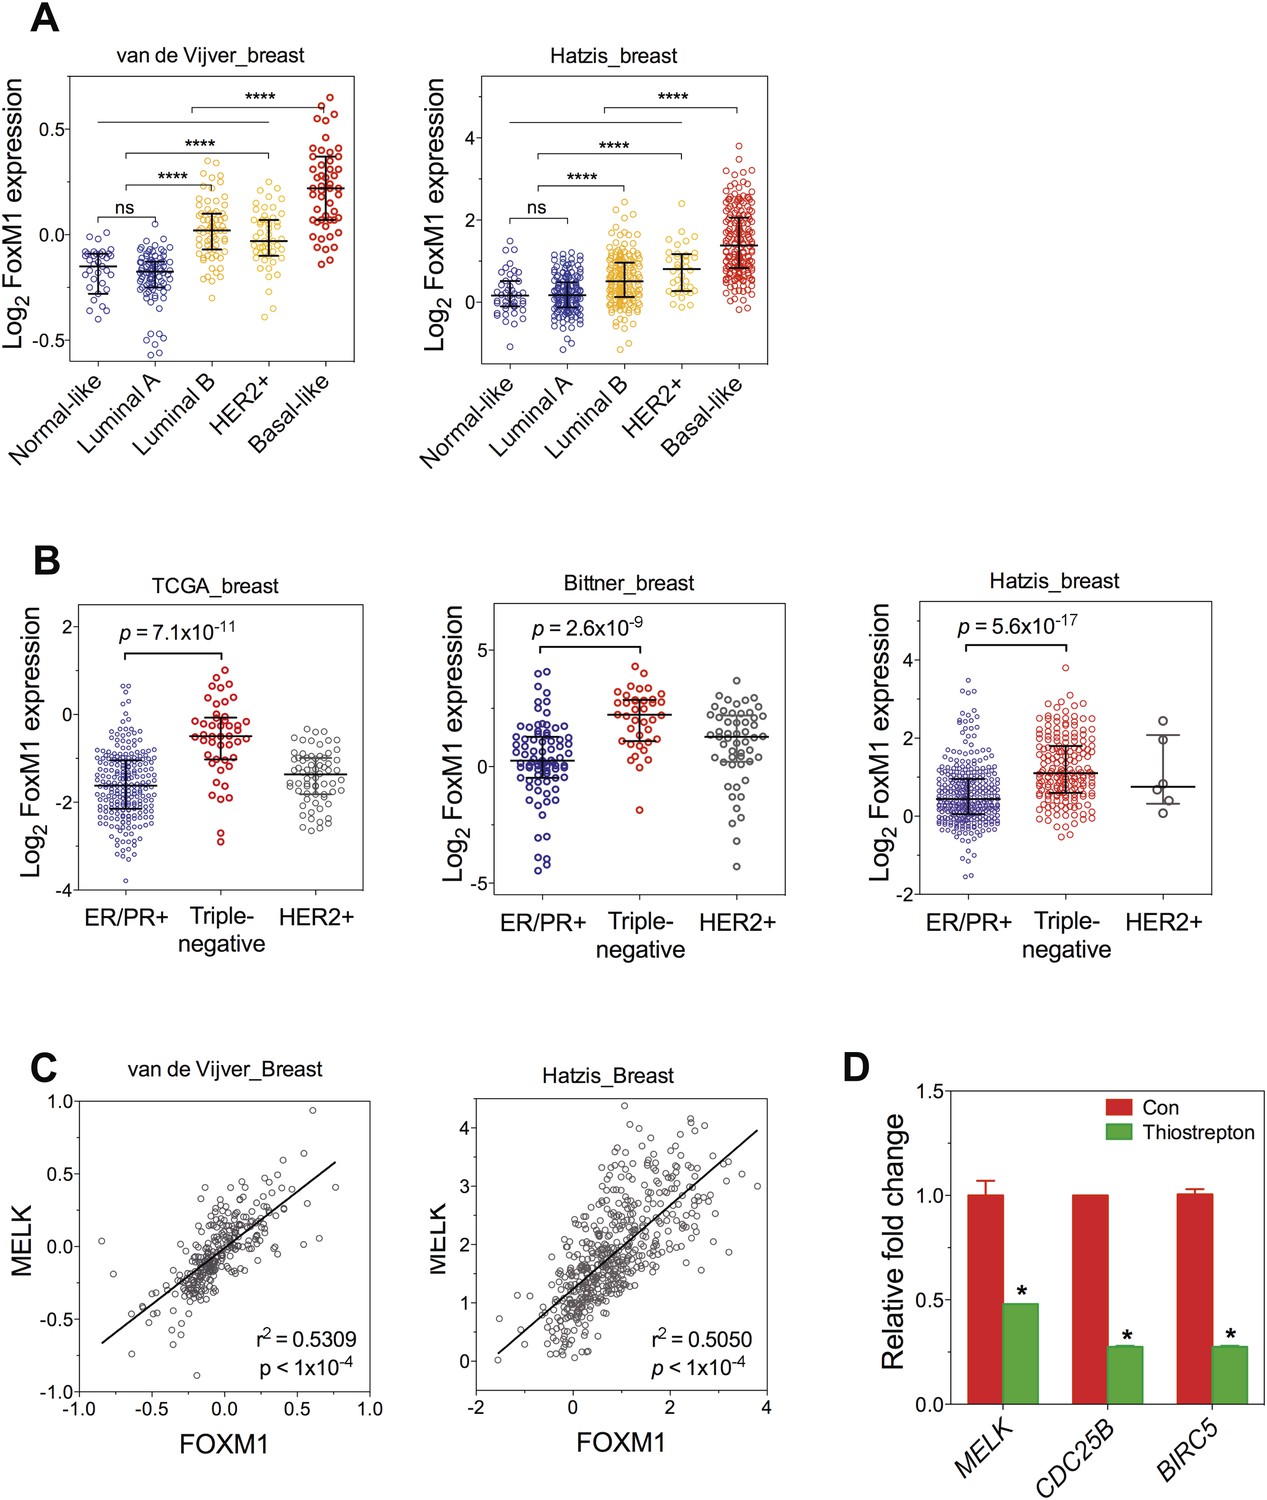
(A) FoxM1 expression in subtypes of breast cancer that are defined by gene expression profiling. Samples in the two indicated cohort was grouped into subtypes based on PAM50 gene signature (Parker et al., 2009). ****p value <0.0001. (B) Expression of FoxM1 is significantly higher in triple-negative than in ER/PR+ subtypes. Samples were classified into subtypes based on the protein expression of ER/PR and HER2. The indicated p values were from comparing MELK expression in triple-negative with that in ER/PR+ breast cancer. (C) FoxM1 and MELK expression are tightly correlated with each other. Expression of MELK was plotted against that of FoxM1. Each circle represents an individual human breast tumor sample (n = 295 for van de Vijver dataset; n = 508 for Hatzis dataset). Correlation analysis was performed by GraphPad Prism. (D) FoxM1 inhibition by thiostrepton decreases the transcription of MELK. Cells were treated with vehicle or thiostrepton for 16 hr, and total RNA was extracted followed by cDNA synthesis. Quantitative PCR was performed using the primers for the indicated genes. The error bars indicate standard deviation. *p value <0.01.
Figure 3—figure supplement 3
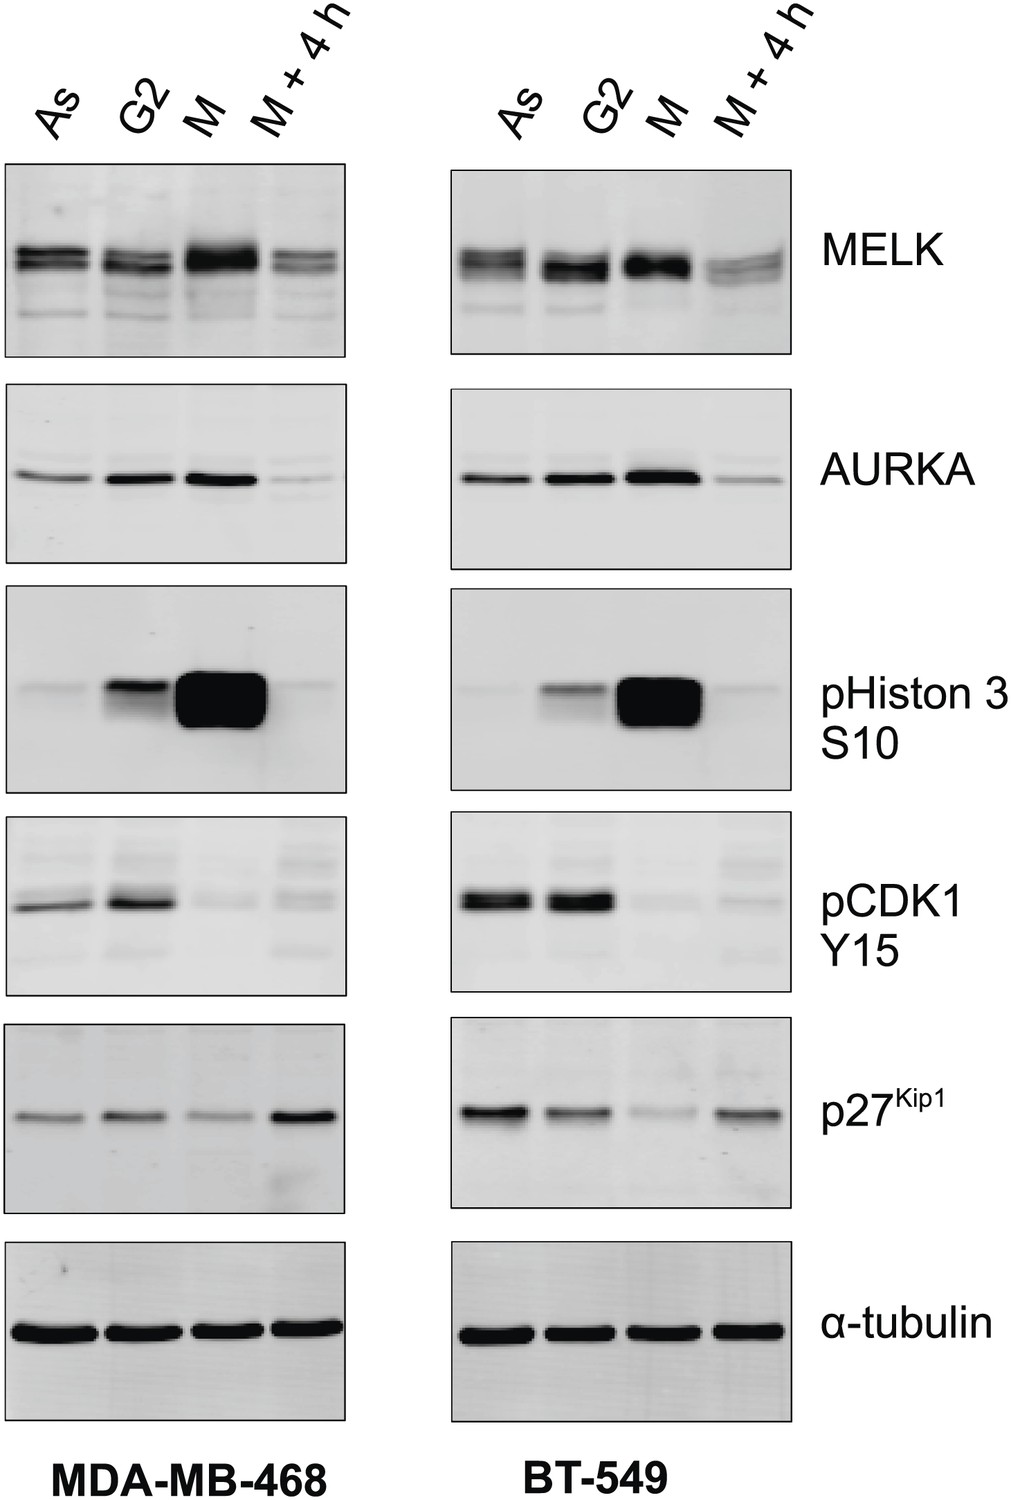
MELK expression in different cell cycle of BBC cells.
The indicated BBC cells were left untreated (Asynchronized, As) or treated with 100 ng/ml nocodazole for 18 hr. Mitotic cells (M) were harvested by shake-off, with the attached cells harvested as those enriched in G2 phase (G2). A part of the mitotic cells was washed off nocodazole, and incubated for 4 hr before the attached cells (M + 4 hr) were harvested. Lysates from the prepared cells were prepared and subjected to immunoblotting using the indicated antibodies.
Figure 4 with 2 supplements
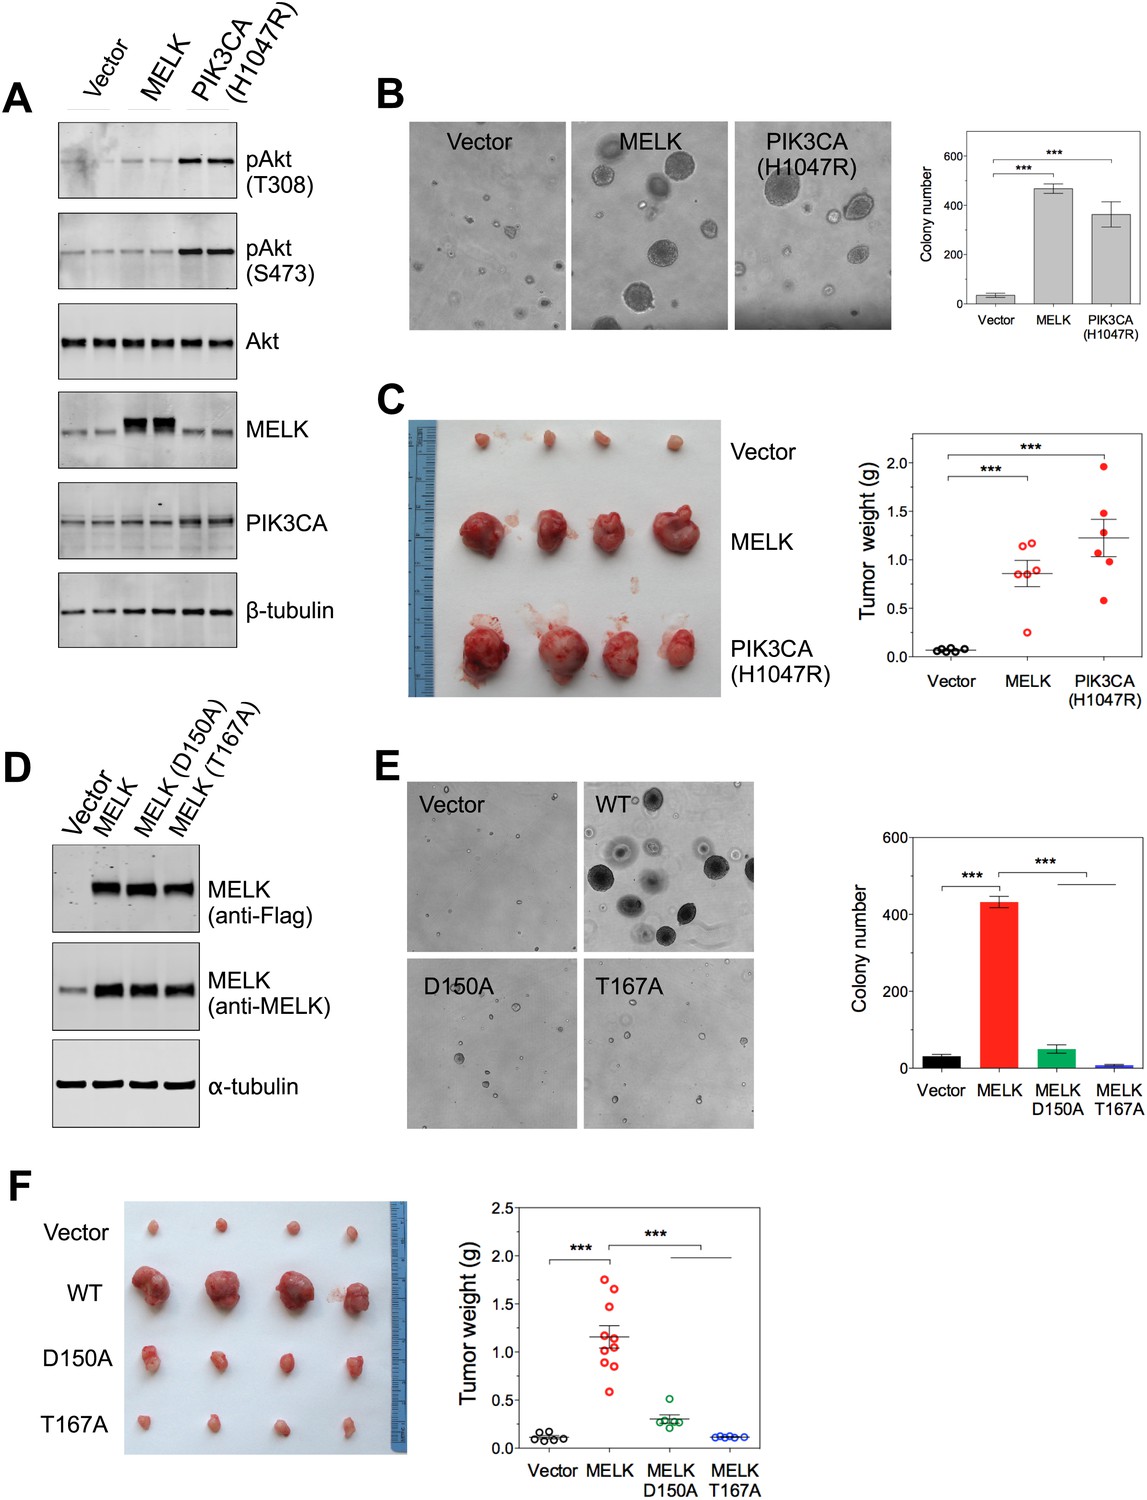
Overexpression of wild-type MELK induces oncogenic transformation.
(A) Immunoblotting analysis of Rat1-DD cells expressing vector, wild-type (WT) allele of human MELK, or an oncogenic allele of PIK3CA (H1047R). Expression of PIK3CA (H1047R) enhances Akt phosphorylation. β-tubulin serves as a loading control. (B) Overexpression of MELK confers anchorage-independent growth of Rat1-DD cells. The left panel shows representative bright-field images of the anchorage-independent growth of cells expressing MELK or PIK3CA H1047R. The bar graph represents means ± SD for three experiments. (C) Overexpression of MELK drives Rat1-DD cells to form tumors in vivo. Representative subcutaneous tumors arising from injected Rat1-DD cells expressing MELK or PIK3CA H1047R are shown (left). The tumor weights for each group are shown as a dot chart (right). (D) Immunoblotting analysis of Rat1-DD cells expressing vector, WT MELK or two kinase-inactive alleles of MELK: D150A or T167A. Note that MELK is c-terminally tagged with a Flag epitope. (E) Rat1-DD cells expressing kinase-inactive alleles of MELK (D150A or T167A), fail to grow as colonies in soft agar. The bar graph represents means ± SD for three experiments. (F) Rat1-DD cells expressing kinase-inactive alleles of MELK (D150A or T167A), fail to grow as tumors in vivo. The tumor weights for each group are shown as a dot chart (right). ***p<0.001, Student's t test.
Figure 4—figure supplement 1

MELK overexpression promotes tumorigenesis.
HMEC-DD-NeuT cells were transduced with empty vector, myristoylated (myr-) or wild type (WT-) MELK. Cells were transplanted into mammary fat pads of nude mice. The number of injections and tumors formed within 2 months is listed.
Figure 4—figure supplement 2
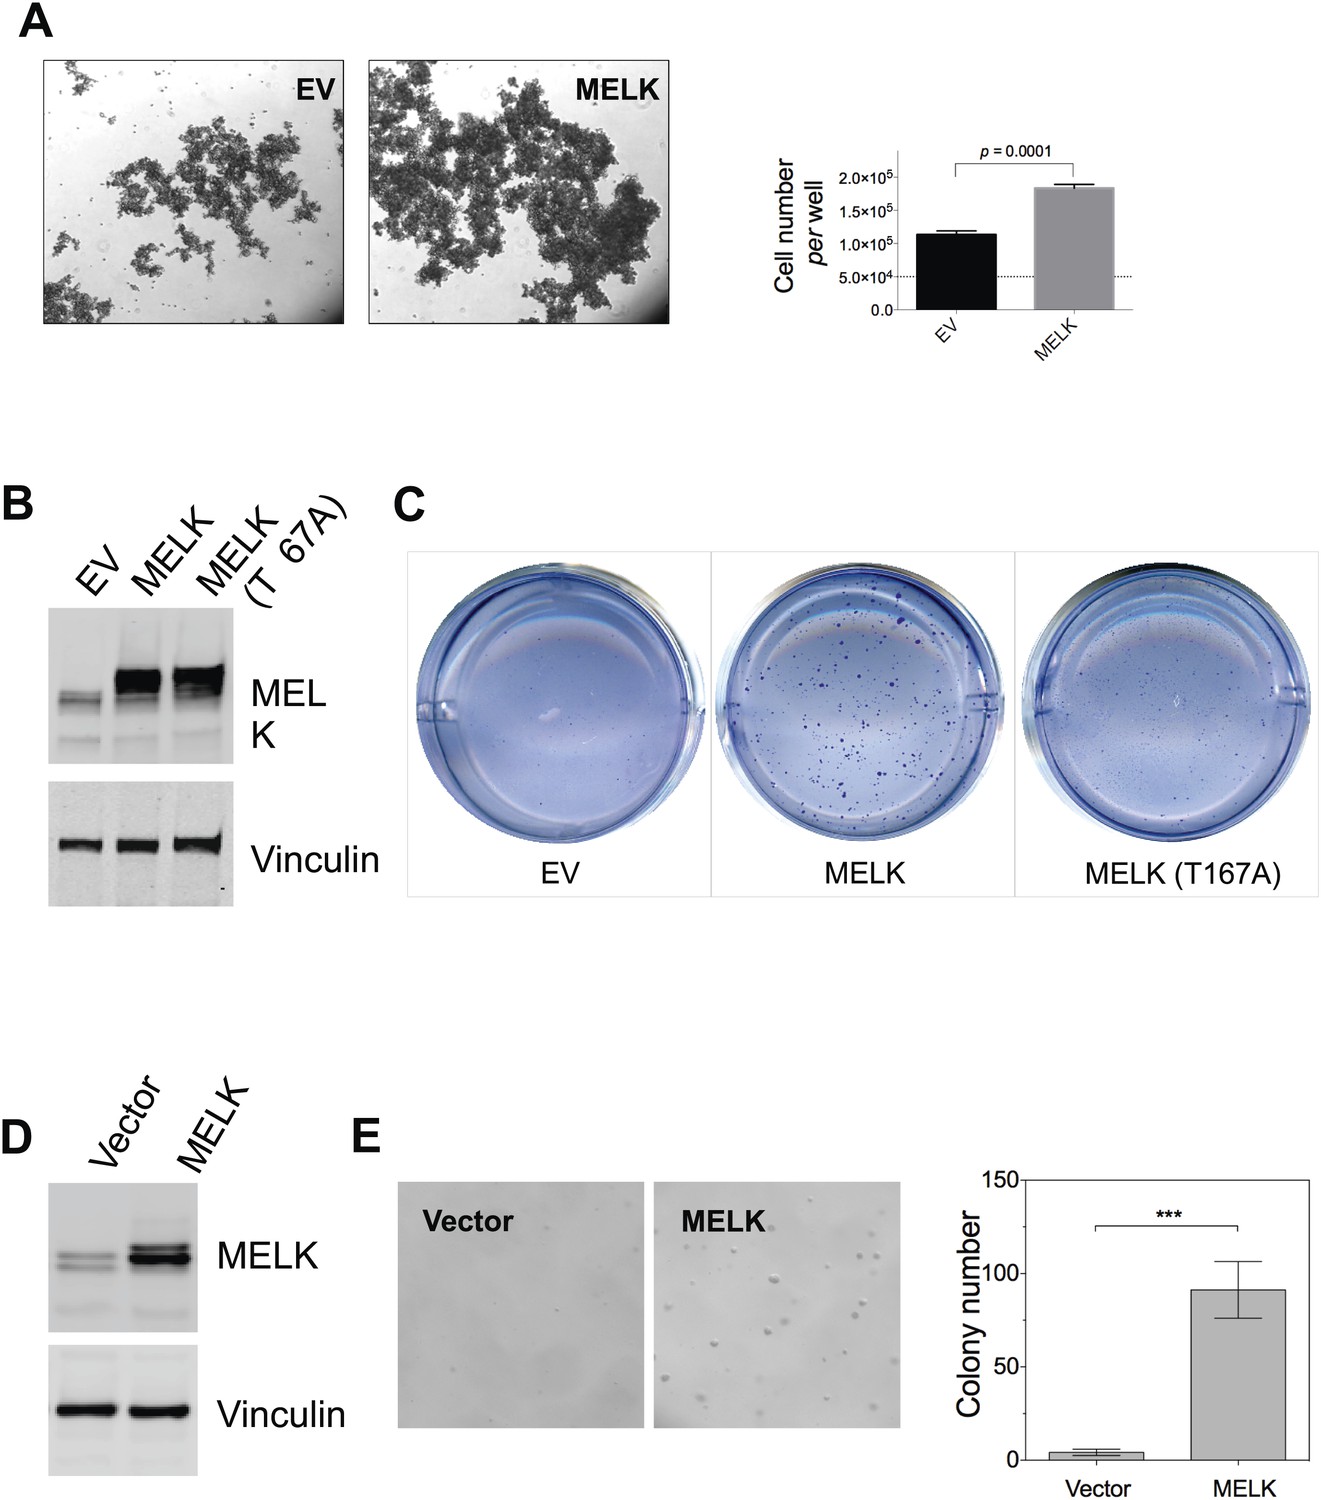
MELK overexpression promotes oncogenic transformation in vitro.
(A) HMEC-DD cells were seeded in 6-well plate coated with 0.6% agar (50,000 cell per well). Bright-field images were captured 4 days after seeding. Cells were also collected for trypin digestion and counting (right histogram, mean ± SD). (B) Overexpression of MELK in HMEC-DD cells. Cells were stably transduced with either empty vector (pWzl-blast) or vector encoding human MELK. Cell lysates were subjected to immunoblotting using the indicated antibodies. (C) MELK overexpression induces anchorage-independent growth of HMEC-DD cells. Cells were seeded in 0.3% agar (4000 cell seeded, per well of a 12-well plate), and harvested after 4 weeks. Bright-field images are shown. (D) Overexpression of MELK in MCF-10A cells. Cells were stably transduced with either empty vector (pWzl-blast) or vector encoding human MELK. Cell lysates were subjected to immunoblotting using the indicated antibodies. (E) MELK overexpression confers anchorage-independent growth in MCF-10A cells. Cells were seeded in 0.3% agar (4000 cell seeded, per well of a 12-well plate), and harvested after 4 weeks. Bright-field images and quantification of colonies per field are shown.
Figure 5 with 3 supplements
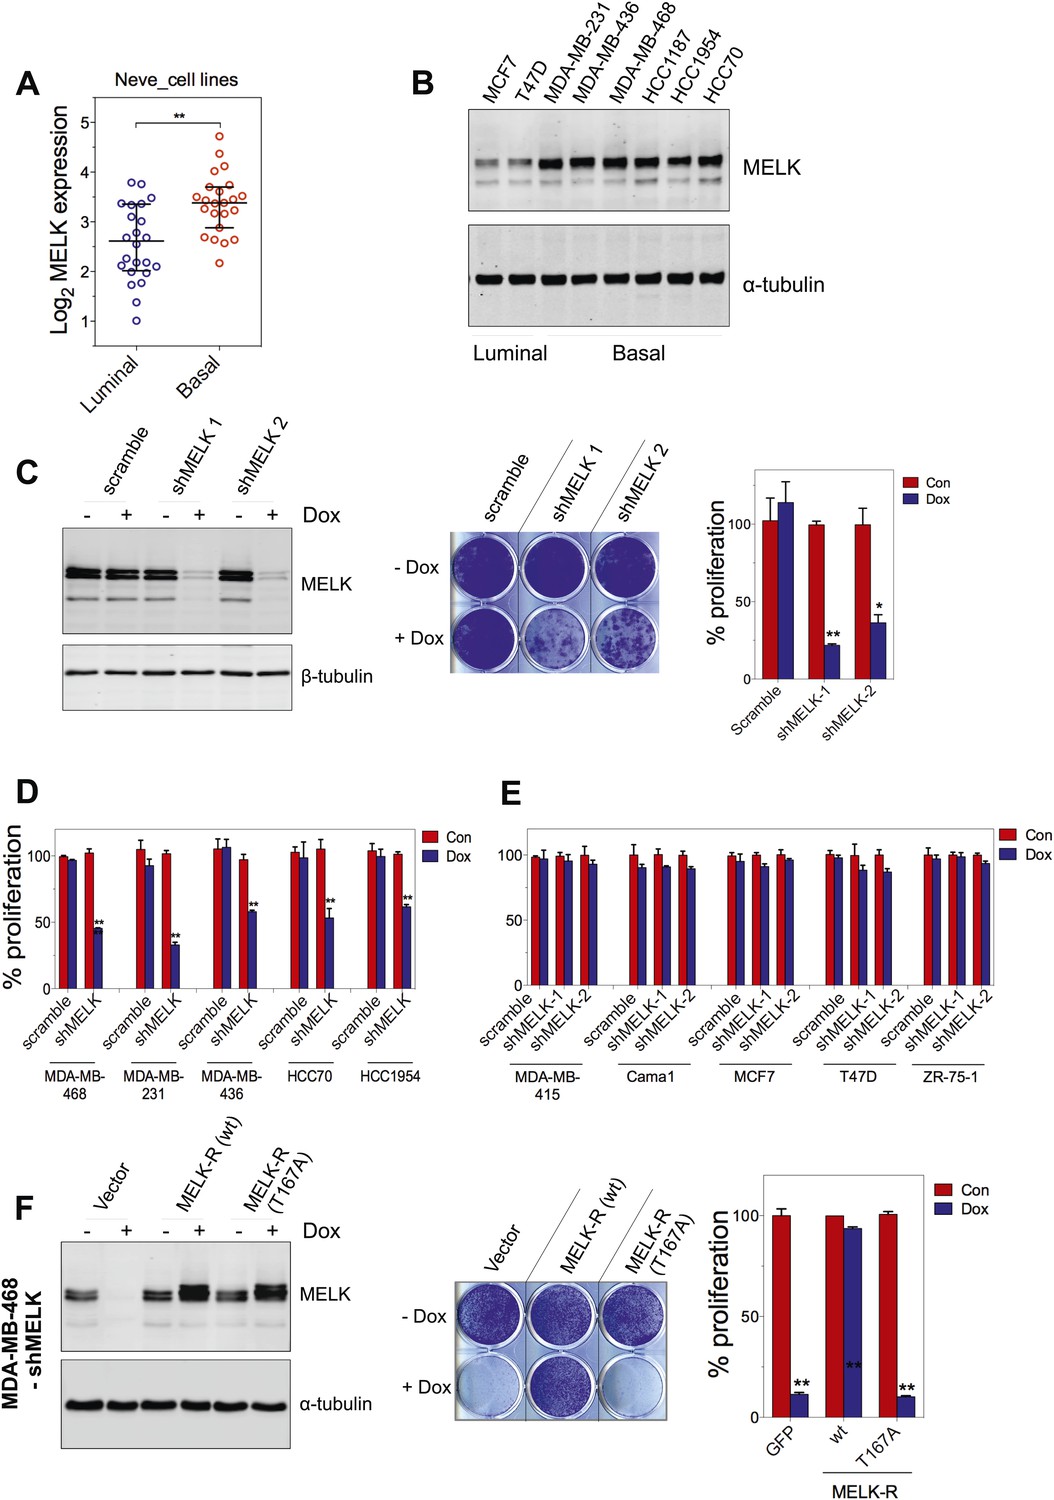
MELK is essential for the growth of basal-like breast cancer cells.
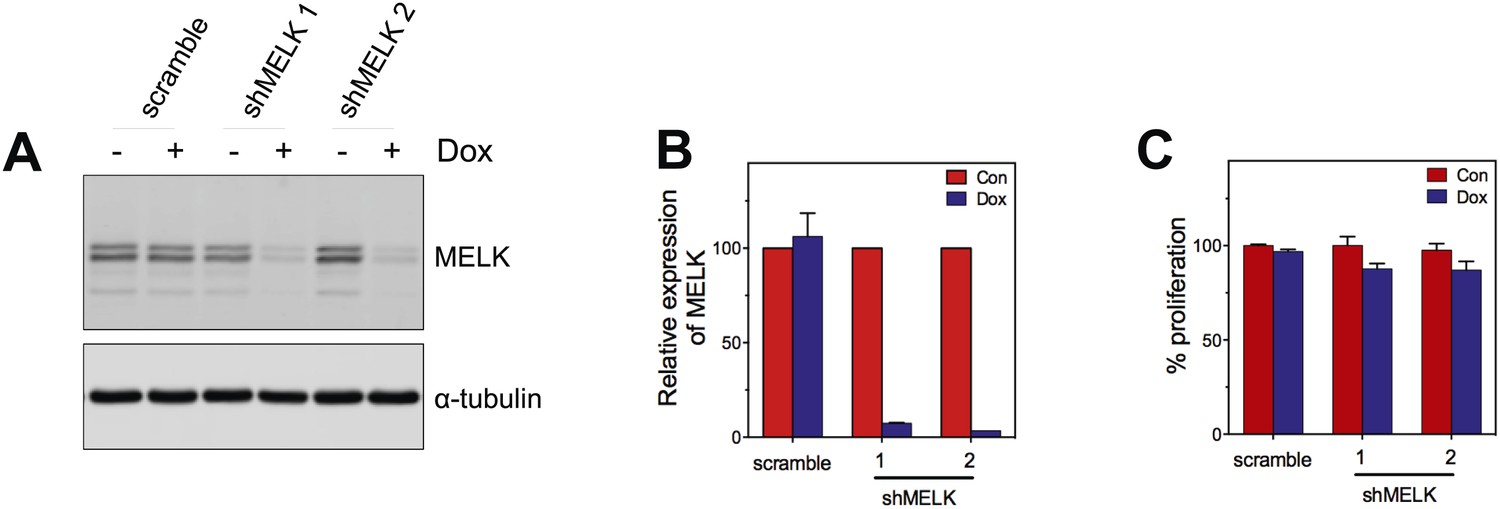
(A) MELK expression levels are significantly higher in BBC cell lines than in luminal breast cancer cell lines. The MELK mRNA data in 23 established BBC and 24 luminal breast cancer cell lines were obtained from the Neve dataset (Neve et al., 2006) and are shown as a dot chart. (B) Immunoblotting analysis of MELK protein abundance in 6 basal-like and 2 luminal breast cancer cell lines. α-tubulin was used as a loading control. (C) Effects of inducible shRNA-mediated MELK silencing (tet-shMELK) in one BBC cell line, BT549. Immunoblotting analysis of MELK protein levels in the presence and absence of doxycycline is shown in the left panels. The middle and the right panels show the crystal violet staining of the plates and their respective quantification. The bar graphs indicate means ± SD for three experiments. (D) Effects of MELK knockdown on the proliferation of additional five BBC cell lines. Cells were treated as in (C). The bar graph indicates means ± SD for three experiments. (E) Luminal breast cancer cells are insensitive to MELK knockdown. The indicated five luminal breast cell lines were treated as in (C). Quantification of cell proliferation is shown (means ± SD). (F) WT but not a kinase-inactive allele of MELK rescues the impaired cell proliferation of BBC cells induced by MELK knockdown. The left panel shows immunoblotting analysis of MELK protein level in MDA-MB-468 cells carrying tet-shMELK, and expressing either shMELK resistant WT MELK (MELK-R) or kinase-inactive MELK (MELK-R, T167A) in the presence and absence of doxycycline. Note that the exogenous MELK is tagged with Flag epitope. The middle and the right panels show, respectively, the crystal violet staining of the plates and their respective quantification. The bar graph indicates means ± SD for three experiments. *p<0.05, **p<0.01, Student's t test.
Figure 5—figure supplement 1
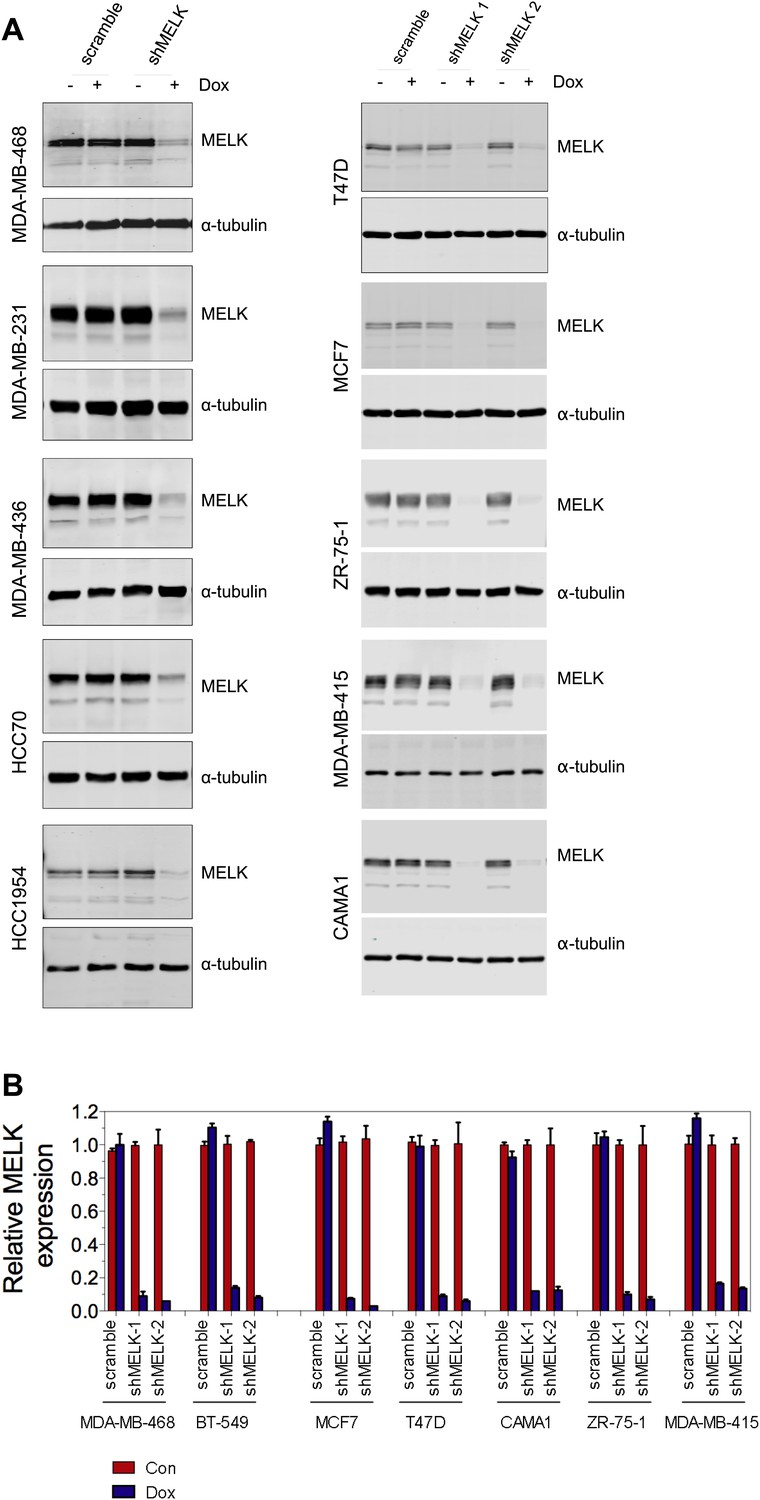
MELK knockdown in basal and luminal breast cancer cells.
(A) Conditionally knocking down MELK in five basal and five luminal breast cancer cell lines. Cells were exposed to doxcycyclin (100 ng/ml) for 3 days. Cell lysates were subjected to immunoblotting using anti-MELK. α-tubulin was used as a loading control. (B) Quantification of MELK knockdown by q-PCR. Total RNA was extracted from control cells or cells treated with doxycycline (100 ng/ml, 3 days), followed by reverse transcription and quantitative PCR.
Figure 5—figure supplement 2
MELK knockdown does not affect the proliferation of HMECs.
(A) Immunoblotting analysis of MELK protein levels in HMECs in the presence and absence of doxycycline. (B) Quantification of MELK knockdown by q-PCR. (C) Quantification of the growth of HMECs. Cells were treated without or with doxycyline for 7 days before cells are fixed and stained with crystal violet. The staining was extracted to determine the absorbance.
Figure 5—figure supplement 3
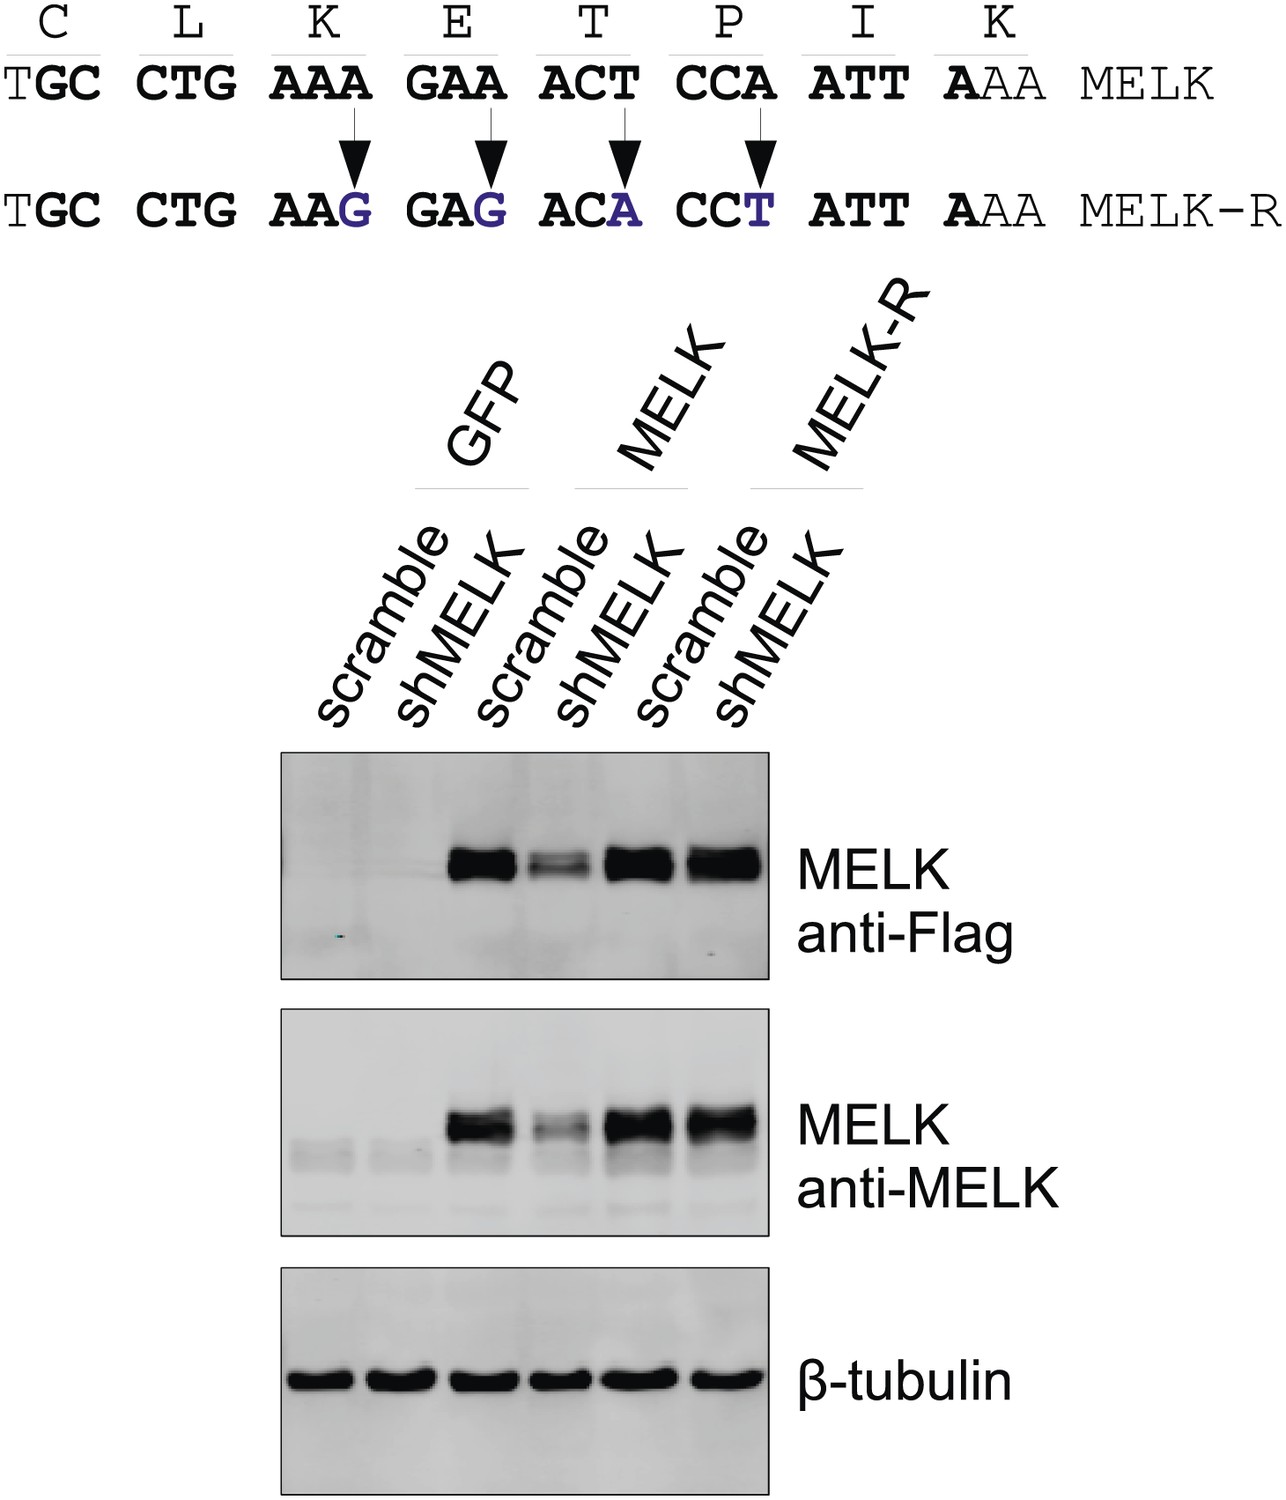
Generation of shMELK-resistant MELK cDNA (MELK-R).
Top, the 21-mer sequence targeted by shMELK2 is marked in bold. The silent mutations are indicated by the arrows. Bottom, the indicated shRNA (scramble or shMELK) were co-transfected with plasmid encoding GFP, or parental MELK, or MELK-R. Cell lysates were harvested for immuoblotting. Note that MELK-R, but not the parental wild type MELK is resistant to shMELK.
Figure 6 with 3 supplements
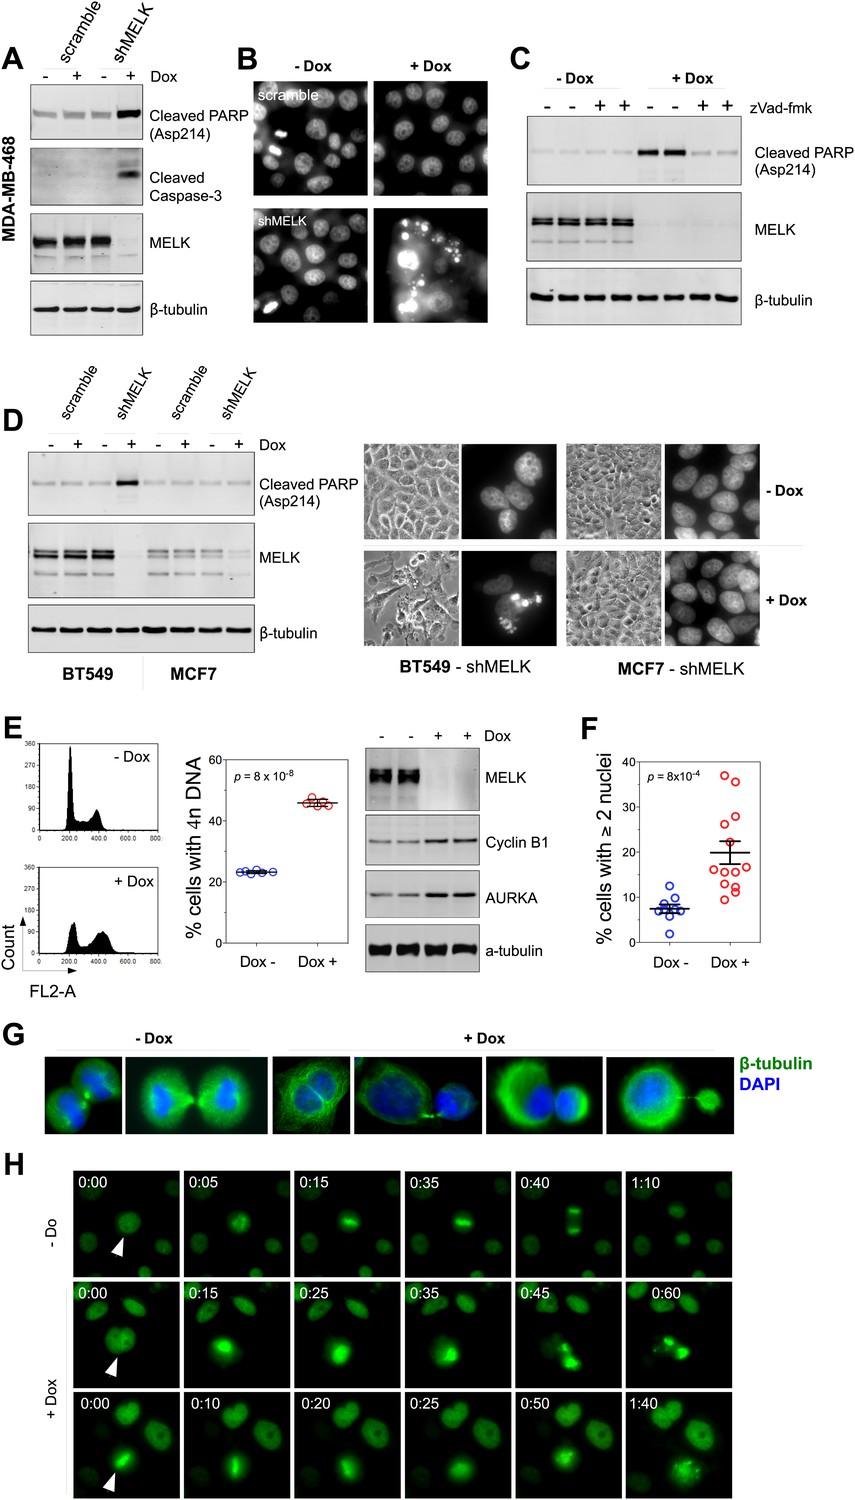
MELK downregulation induces apoptosis and impairs mitosis in BBC cells.
(A) Immunoblotting analysis of MDA-MB-468 cells carrying a scrambled control or tet-shMELK in the presence and absence of doxycycline. Both cleaved PARP and Caspase-3 levels increased upon MELK downregulation. (B) MELK knockdown induces DNA fragmentation. MDA-MB-468 cells carrying scramble control or tet-shMELK were treated with or without doxcycline followed by fixation and staining with DAPI. The bright and punctate staining indicative of DNA fragmentation was only seen in cells carrying tet-shMELK in the presence of doxycycline (lower right panel). (C) A caspase inhibitor prevents MELK knockdown-induced cell death. MDA-MB-468 cells stably transduced with tet-shMELK were either untreated or treated with doxycycline for 4 days, and further treated with with zVad-fmk (40 μM) or vehicle during the last 2 days. Lysates from these cells were subjected to immunoblotting, with β-tubulin as a loading control. (D) MELK knockdown induces cell death selectively in BBC cells. The indicated cells were untreated or treated with doxycycline for 4 days followed by immunoblotting and imaging analyses. MELK knockdown induces increased level of cleaved PARP (left) and cell death (right) in BT549 but not in MCF7 cells. (E) MELK knockdown induces the accumulation of cells with 4n DNA content and G2/M arrest. MDA-MB-468 cells carrying tet-shMELK were treated or untreated with doxycycline for 5 days. Samples were prepared for cell cycle analysis and immunoblotting. The left panel shows representative cell cycle histograms; the middle indicates the quantification of % cells with 4n DNA content; and in the right panel, immunoblotting analysis shows that depletion of MELK increases the expression of G2/M specific proteins as indicated. (F) MELK knockdown induces bi- or multi-nucleated cells. MDA-MB-468 cells carrying tet-shMELK were treated or untreated with doxycycline for 4 days, followed by fixation and DAPI staining. Cells with mono-, bi-, or multi-nuclei were counted, and the data indicate % cells with two or more than two nuclei. Each circle in the histogram represents a single randomly selected field (total number of cells counted >500 for each group). The black lines indicate mean ± SEM. (G) MELK inhibition induces defective cell division. Fluorescent images were obtained from MDA-MB-468 cells carrying tet-shMELK as described in (F) stained with anti-β-tubulin (green) and DAPI (blue). (H) MDA-MB-468 cells stably transduced with tet-shMELK and Histone 2B-GFP were cultured in the presence or absence of doxycycline for 3 days, and then subjected to time-lapse imaging. Time is given in hours:minutes. In the absence of doxycycline, cells undergo normal mitosis (top panels). In the presence of doxycycline, binucleated cells (middle panels) and cells in metaphase (bottom panels) undergo cell death.
Figure 6—figure supplement 1
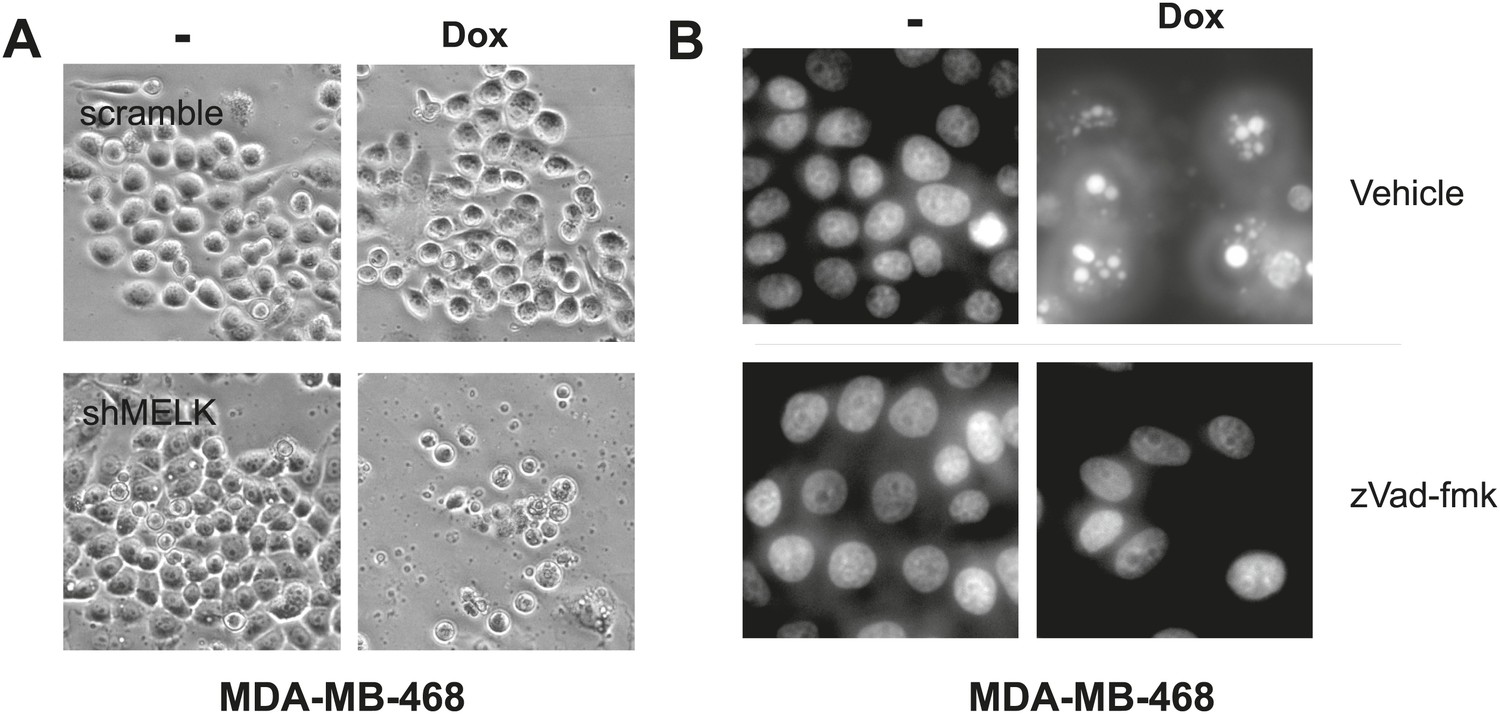
MELK inhibition induces cell death in MDA-MB-468 cells.
(A) Bright-field images of indicated cells untreated or treated with doxycycline for the induction of MELK silencing. (B) DAPI staining of MDA-MB-468 cells with tet-shMELK. The cells were untreated or treated with doxycycline for 4 days, and further treated with zVad-fmk or vehicle during the last 2 days. Note that zVAD decrease cell death that is induced by MELK knockdown.
Figure 6—figure supplement 2
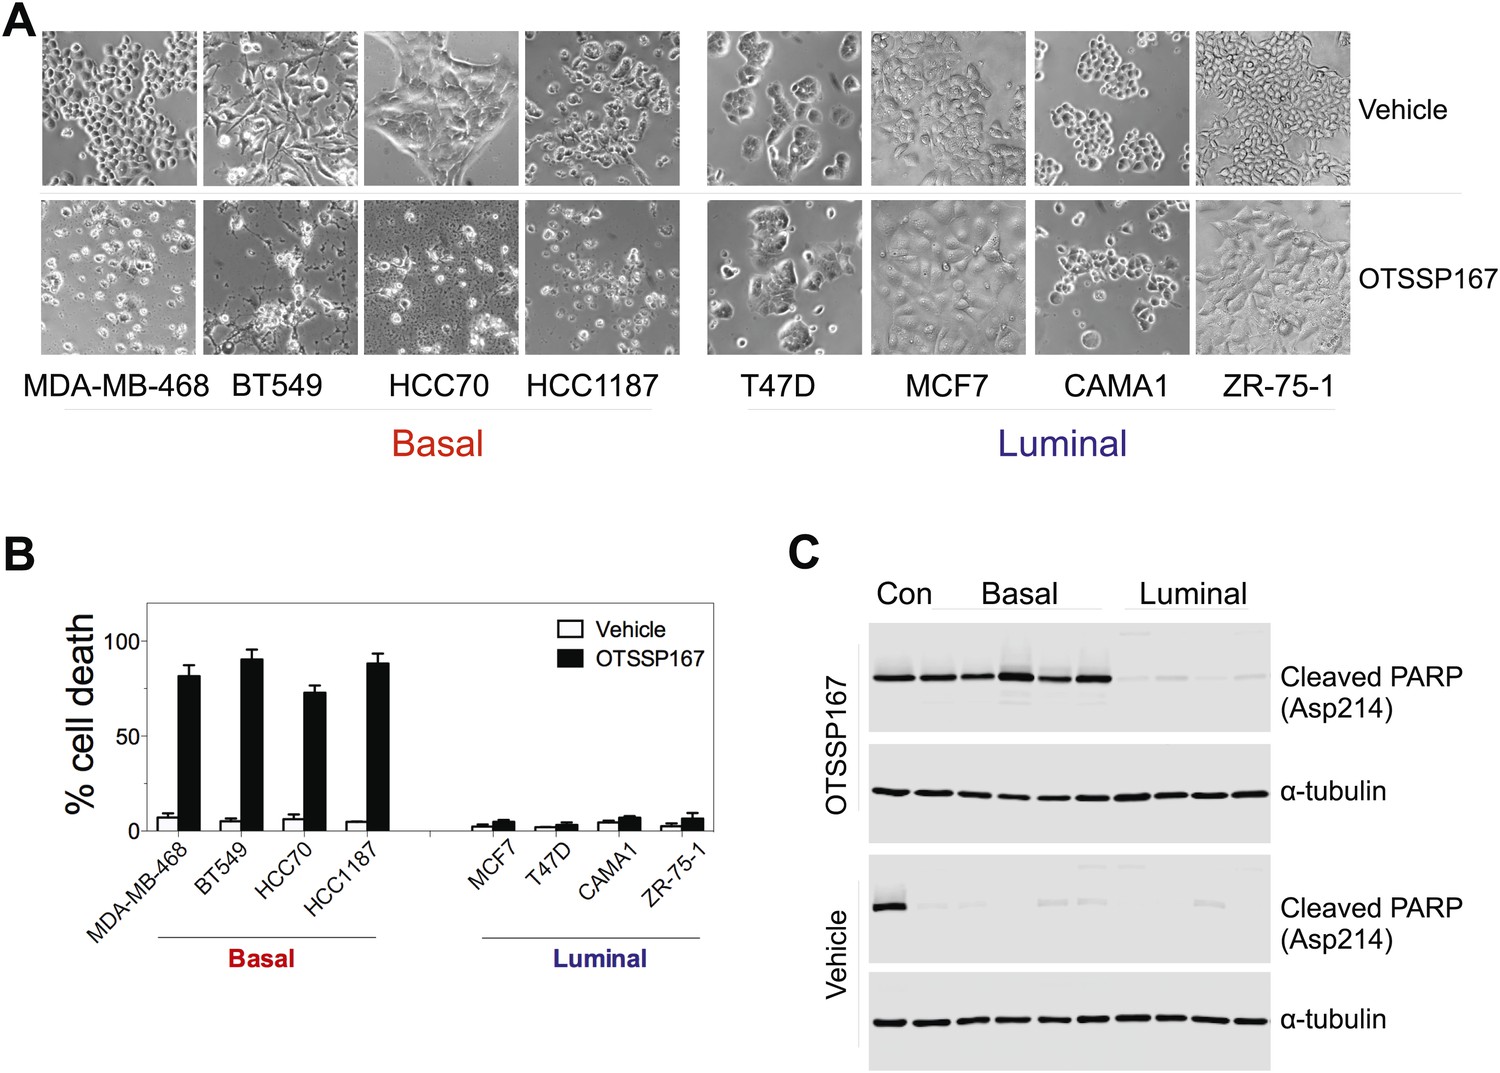
MELK inhibition induces cell death selectively in basal-like breast cancer cells.
(A) The indicated cells were treated with vehicle or MELK inhibitor (OTSSP167, 100 nM) for 2 days. Bright-field images of cells were captured. (B) Cell viability were treated as in (A) and assayed by trypan blue staining and counting. (C) Cell lysates were harvested for immunoblotting using the indicated antibodies. The order of samples loaded is as following: control apoptotic cell lysates; basal (MDA-MB-231, MDA-MB-468; HCC70, BT549, HCC1197); luminal (T47D, MDA-MB-415, CAMA1, ZR-75-1).
Figure 6—figure supplement 3
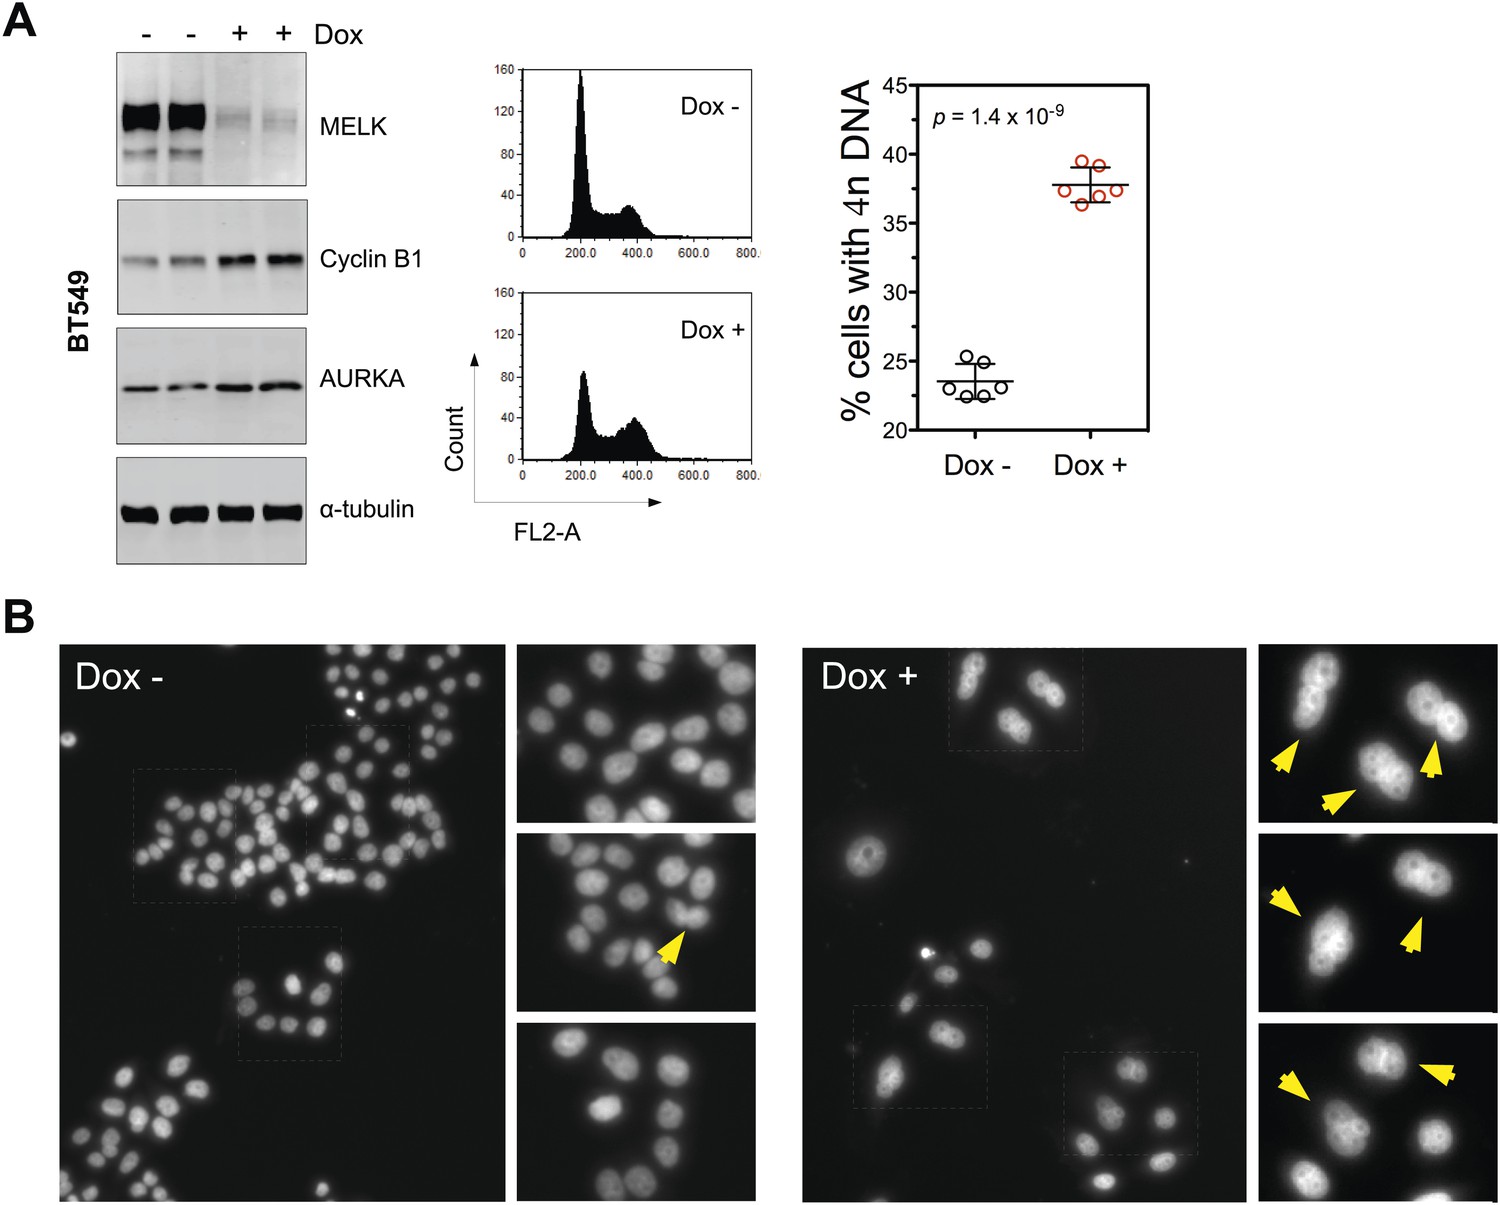
MELK inhibition in BBC cells induces cell death and defective mitosis.
(A) Conditionally knocking down MELK in BT549 cells induces the accumulation of cells with 4n DNA content and G2/M arrest. BT549 cells with tet-shMELK were either treated without or with doxycycline for 5 days. Cells were subjected to cell cycle analysis by FACS and immunoblotting. The left, middle, and right panels show respectively immunoblotting, representative cell cycle distribution histograms, and the quantification of % cells with 4n DNA content. The black lines indicate median ± SD. (B) DAPI staining reveals cells with multiple nuclei. MDA-MB-468 cells with tet-shMELK were untreated or treated with doxycycline (100 ng/ml). Yellow arrows indicate cells with two or more nuclei.
Figure 7 with 1 supplement
MELK is essential to sustain the oncogenic growth of BBC Cells.
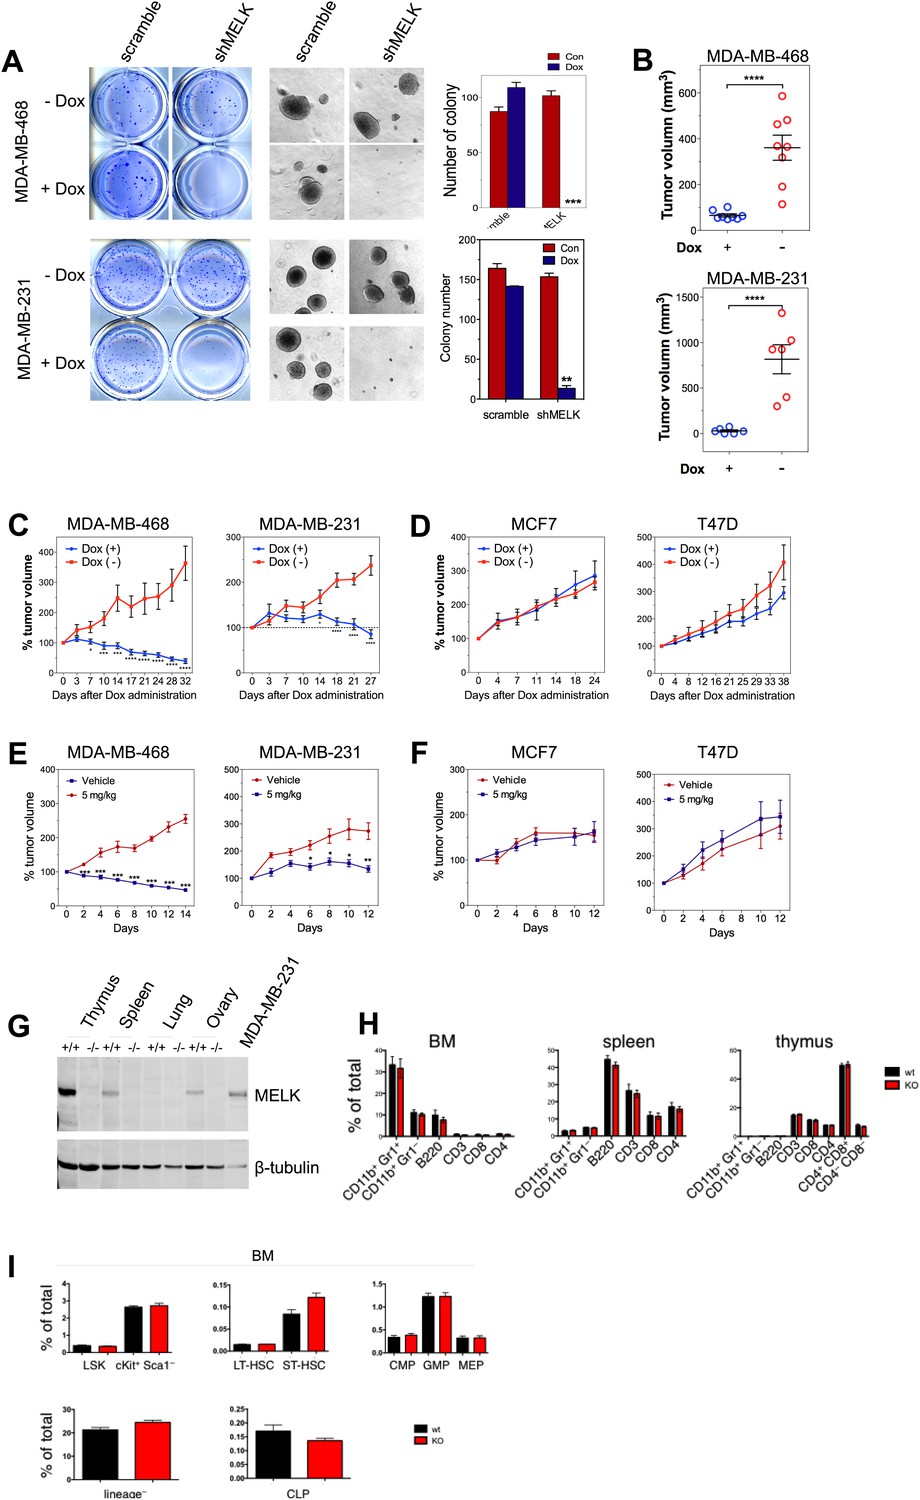
(A) Effects of MELK knockdown on anchorage-independent growth of BBC cells in soft agar. The left and middle panels show crystal violet staining, and bright-field images of the colonies respectively. The bar graphs indicate the means ± SD for three experiments. (B) Effects of MELK knockdown on the growth of BBC cells in vivo. MDA-MB-468 and MDA-MB-231 cells carrying tet-shMELK were orthotopically implanted into the mammary fat pads of nude mice. The recipient mice were divided into two groups: one group of mice was given doxycycline-supplemented drinking water on the second day of injection for the duration of the experiment, while the other group of mice was maintained without doxycycline. The histogram indicates tumor volume measured 7 weeks after treatment. Data are means ± SEM (n ≥ 6). (C and D) Effects of MELK knockdown on established tumors arising from implantation of basal (C) or luminal (D) breast cancer cells. Mice bearing orthotopic tumors arising from the indicated cells carrying tet-shMELK were divided into two groups, with one group of mice receiving doxycycline, and the other maintained without doxycycline. Tumor volumes were measured on the indicated days after the administration of doxycyline. Data are means ± SEM (n ≥ 8). (E and F) Effects of MELK inhibition on tumor growth. Mice with tumors developed from basal (E) or luminal (F) breast cancer cells, were treated once daily with vehicle (0.5% methycellulose) or OTSSP167 (5 mg/kg). Tumor volumes were measured on the indicated days. Data are means ± SEM (n ≥ 8). (G) Knocking out Melk in mice. Indicated tissues were harvested from wild type or Melk−/− adult mice, and homogenized in RIPA lysis buffer. Lysates were subjected to immunoblotting. Total lysate of human breast cancer cell line MDA-MB-231 was used as a control. (H) Loss of Melk has no obvious impact on the development of immune system. Cells were isolated from bone marrow (BM), spleen and thymus, and subjected to flow cytometric analysis. Note that CD11b+/Gr1+ is a marker for neutrophils, CD11b+/Gr1− for monocytes, B220 for B cells, CD3, CD4 and CD8 for T cells. (I) Bone marrow was collected from wild type (wt) and Melk−/− (KO) mice and stained for the indicated cell populations. LSK: Lin−Sca1+ ckit+; LT-HSC(long-term hematopoietic stem cells): LSK CD150+CD48−; ST-HSC(short-term hematopoietic stem cells): LSK CD150−CD48−; CMP(Common myeloid progenitor): Lin−cKit+Sca1−IL7Ra−CD34+FcRg−; GMP(Granulocyte-macrophage progenitors): Lin−cKit+Sca1−IL7Ra−CD34+FcRg+; MEP(Megakaryocyte-erythrocyte progenitors): Lin−cKit+Sca1−IL7Ra−CD34−FcRg−; CLP(Common lymphoid progenitors): Lin−cKitmidSca1midIL7Ra+. *p<0.05, **p<0.01, ***p<0.001, ****p<0.0001, Student's t test.
Figure 7—figure supplement 1
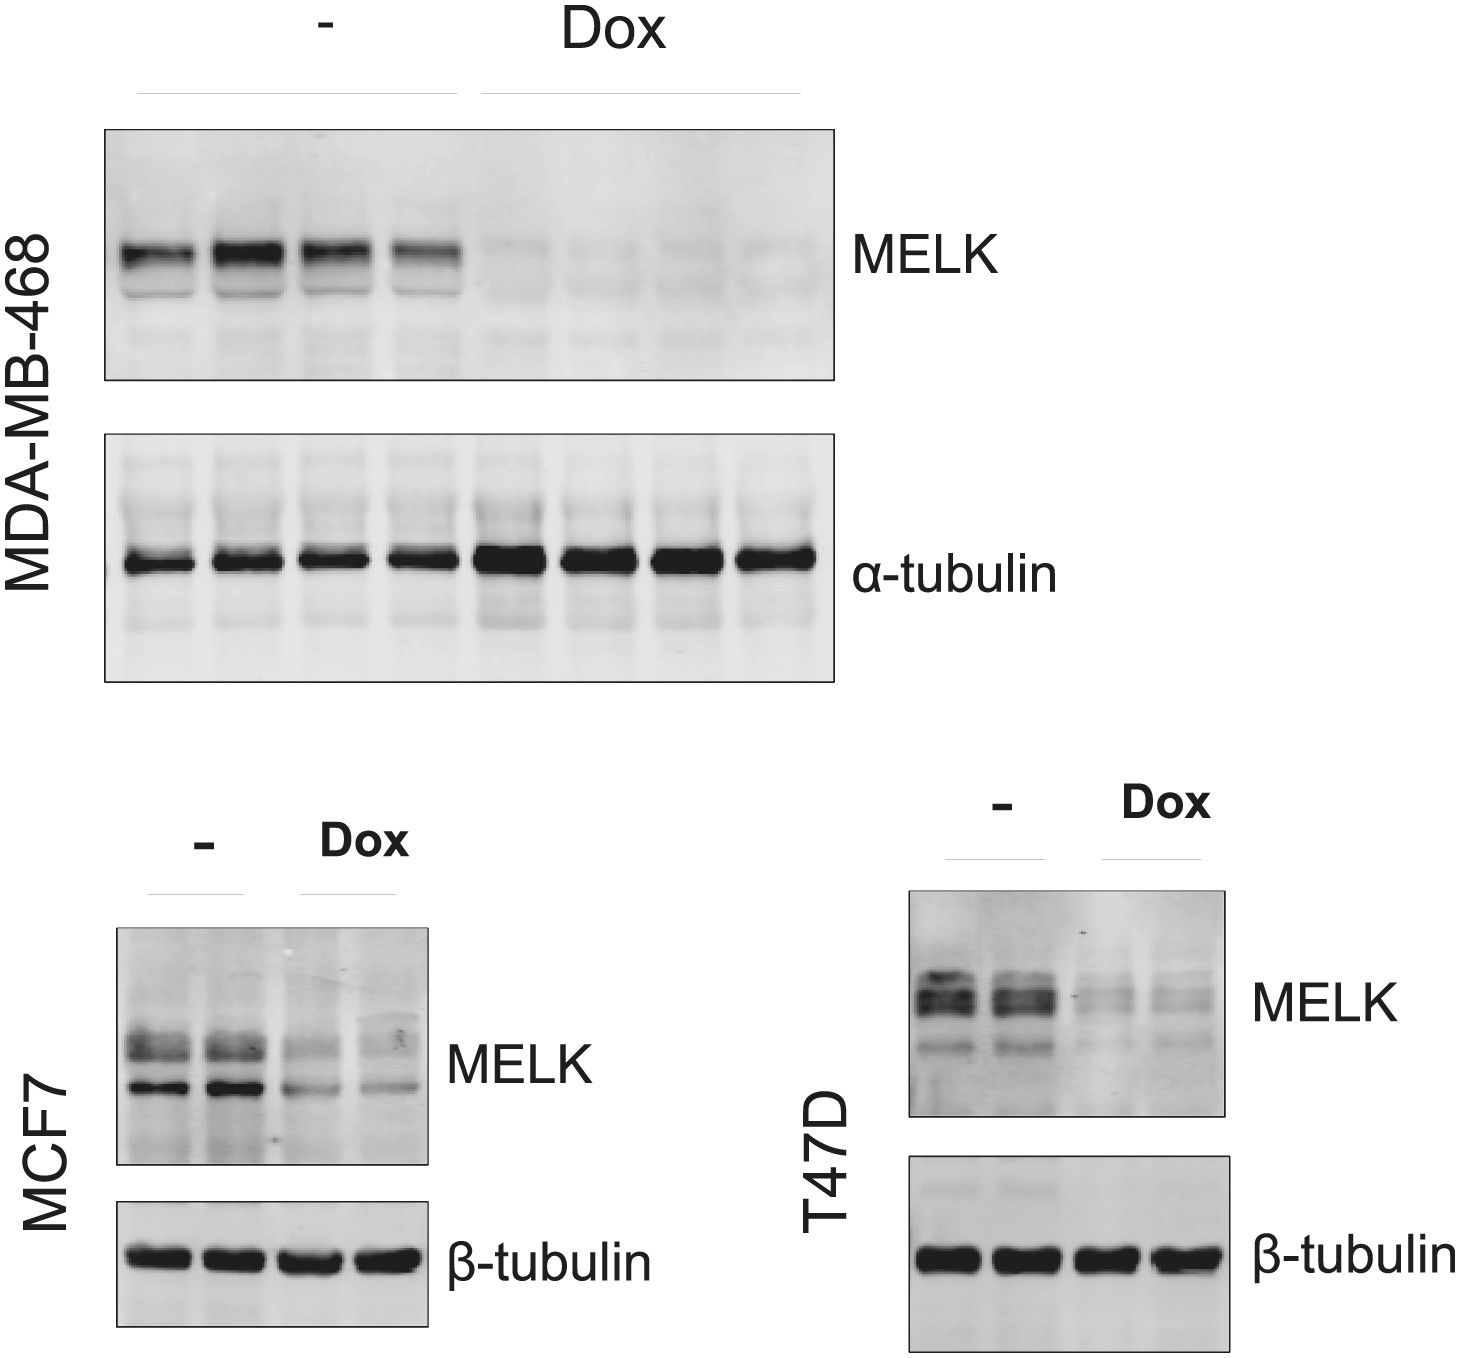
Efficient conditional MELK knockdown in vivo.
Mice with mammary tumors derived from the indicated cells with stable tet-shMELK were untreated or treated with doxycycline-supplemented water for 4 days. Tumors lysates were used for immunoblotting, with α- or β-tubulin served as a loading control.
Videos
Video 1
This representative time-lapse video, related to Figure 6, shows a MDA-MB-468/tet-shMELK cell in the presence of doxycycline fails to undergo cytokinesis.
The large frame indicates the initial position of the cell, and small frame its final position. Note that the cell progresses into mitosis, which ends with a double-nuclei cell following failed cytokinesis. Frame rate is five frames per second. Time is given in hours:minutes.
Video 2
This representative time-lapse video, related to Figure 6, shows that in the presence of doxycycline, MDA-MB-468/tet-shMELK/GFP-H2B cells with double nuclei undergo cell death.
The two frames indicate two such cells. Frame rate is five frames per second. Time is given in hours:minutes.
Video 3
This representative time-lapse video, related to Figure 6, shows that in the presence of doxycycline, MDA-MB-468/tet-shMELK/GFP-H2B cells undergo mitosis but ending with asymmetric cell division (in the top frame) or cell death (in the bottom frame).
Frame rate is five frames per second. Time is given in hours:minutes.
Video 4
This representative time-lapse video, related to Figure 6, shows that in the absence of doxycycline, MDA-MB-468/tet-shMELK/GFP-H2B cells demonstrate efficient mitosis.
Frame rate is five frames per second. Time is given in hours: minutes.
Additional files
-
Supplementary file 1
Breast cancer gene expression datasets used in this study.
- https://doi.org/10.7554/eLife.01763.030
-
Supplementary file 2
Oligonucleotides used in this study.
- https://doi.org/10.7554/eLife.01763.031
Download links
A two-part list of links to download the article, or parts of the article, in various formats.
Downloads (link to download the article as PDF)
Open citations (links to open the citations from this article in various online reference manager services)
Cite this article (links to download the citations from this article in formats compatible with various reference manager tools)
MELK is an oncogenic kinase essential for mitotic progression in basal-like breast cancer cells
eLife 3:e01763.
https://doi.org/10.7554/eLife.01763


