A new motor synergy that serves the needs of oculomotor and eye lid systems while keeping the downtime of vision minimal
- University of Tübingen, Germany
Figures
Figure 1
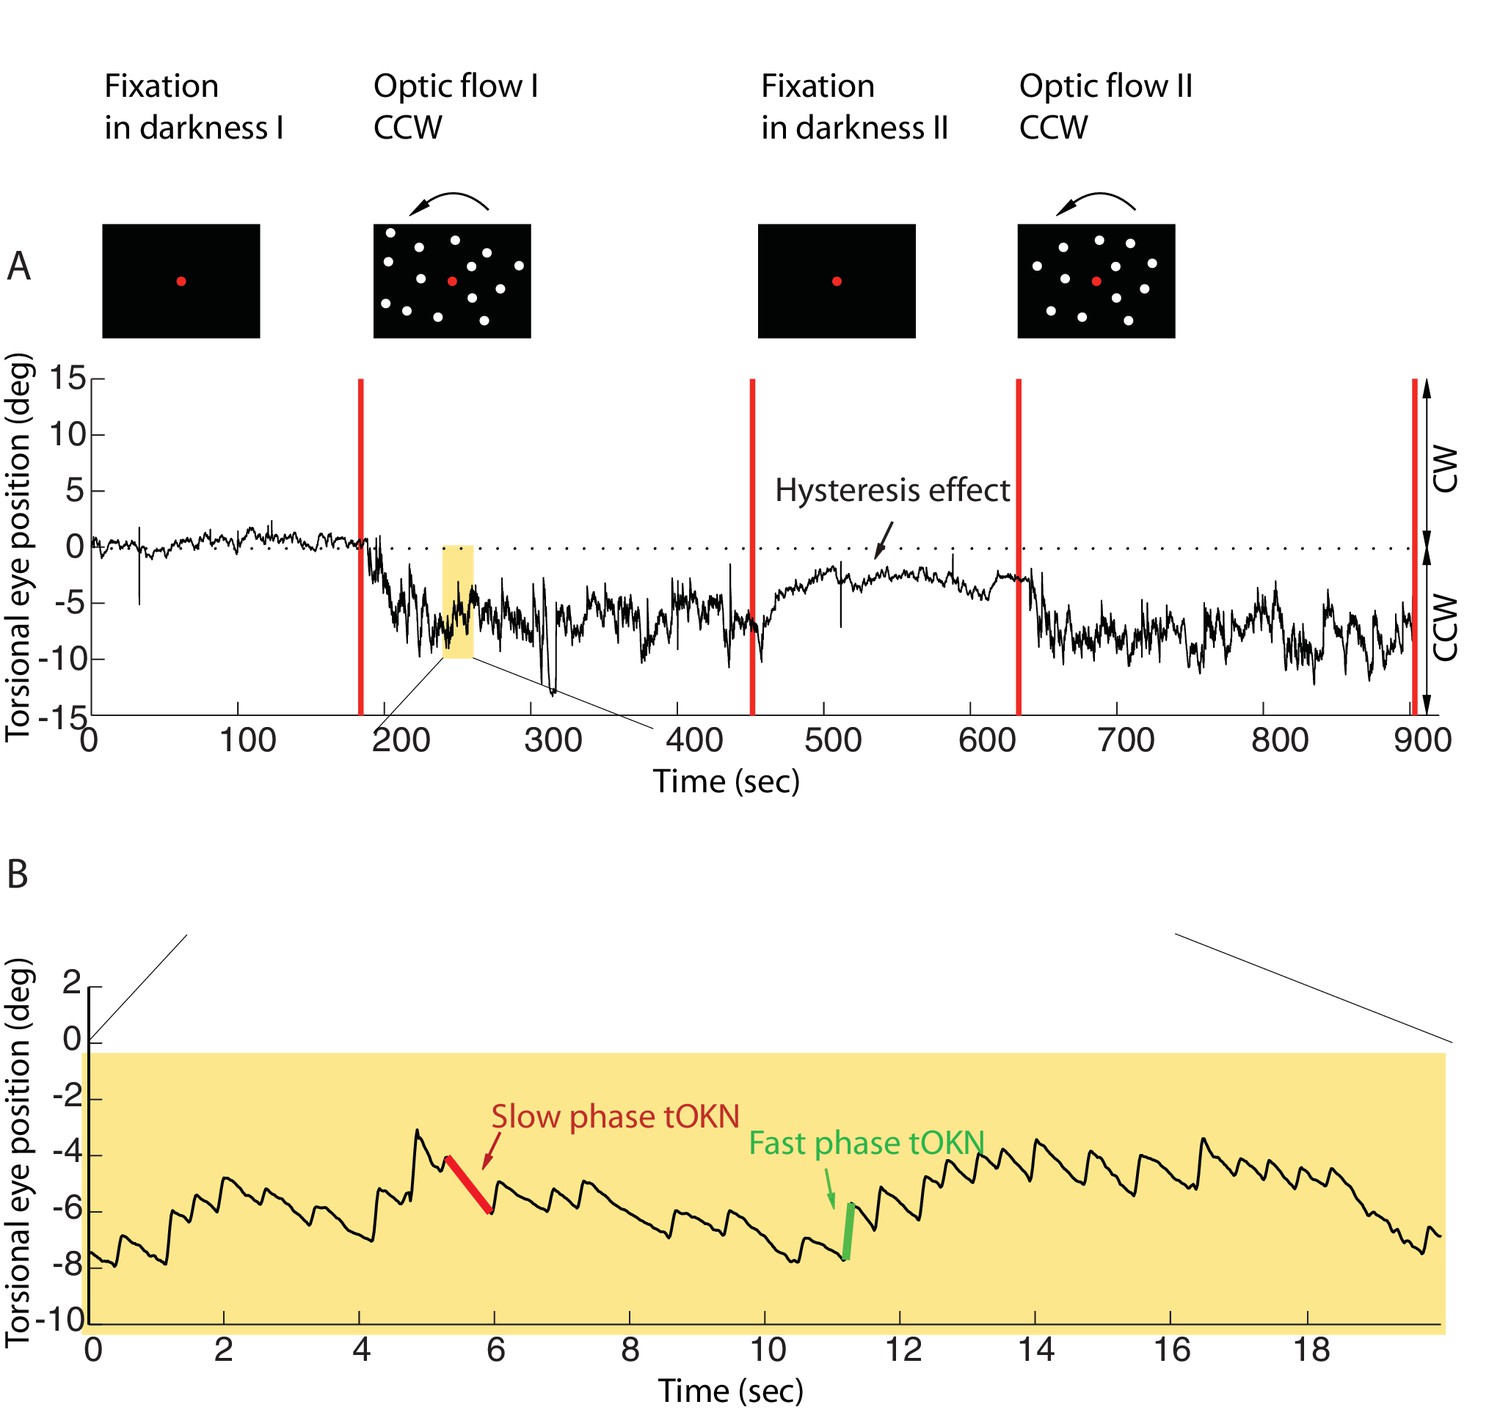
Torsional eye movements evoked by an optokinetic stimulus.
(A) An example of the experimental block depicting the stimulus in the upper row and the associated torsional eye position beneath. A block consisted of four phases. ‘Fixation in darkness’ phase I was a fixation period (start from zero), followed by a optic flow phase I phase in which a large field visual stimulus rotating counterclockwise was presented on the monitor (start marked with a red line). The subsequent ‘fixation in darkness’ phase II and ‘optic flow’ phase II were identical to ‘fixation in darkness’ phase I and ‘optic flow’ phase I, respectively. Note the build-up of eye torsion during the stimulus presentation. (B) Enlarged torsional eye position from (A) showing torsional optokinetic nystagmus consisting of fast phases in green towards the zero torsional eye position and slow phases in red which follow the direction of the rotating stimulus. Notice that the eye torsional position did not return completely back to zero, i.e. it showed a hysteresis effect.
Figure 2 with 1 supplement
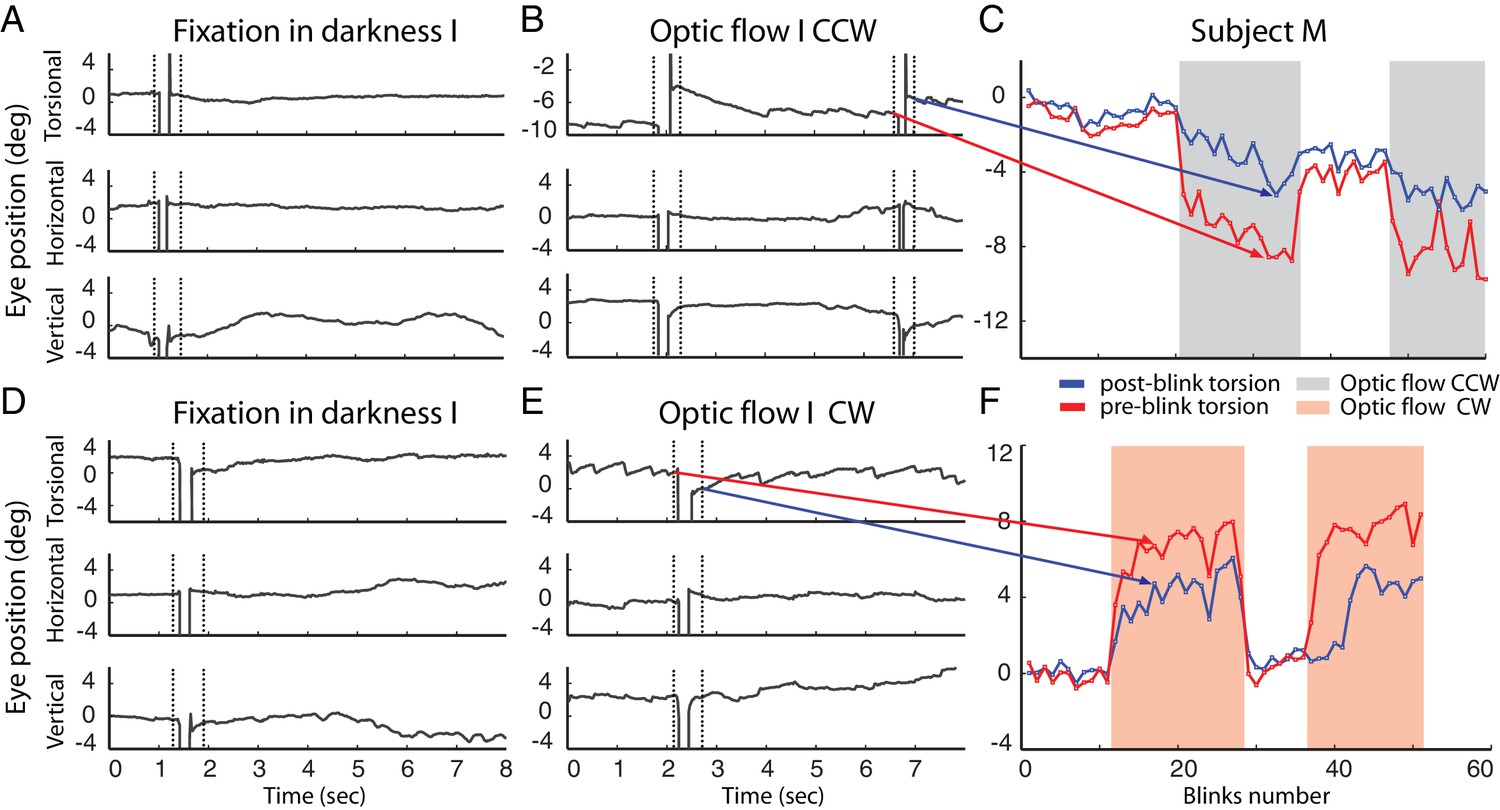
Example of blinks during fixation in darkness (A, D) and during the presentation of the optic flow pattern (B, E).
In (B) the optic flow is counterclockwise, in (E) clockwise. Dotted lines demarcate the period around the blink-associated artifact of the eye position record, which was not considered for analysis (see Materials and methods). Note the torsional eye position shift towards zero after every blink during the presentation of optic flow stimulus, and less consistently in darkness. (C and F) are comparing the pre- and post-blink torsional eye position for all blinks observed in two blocks examples of subject M.
Figure 2—figure supplement 1
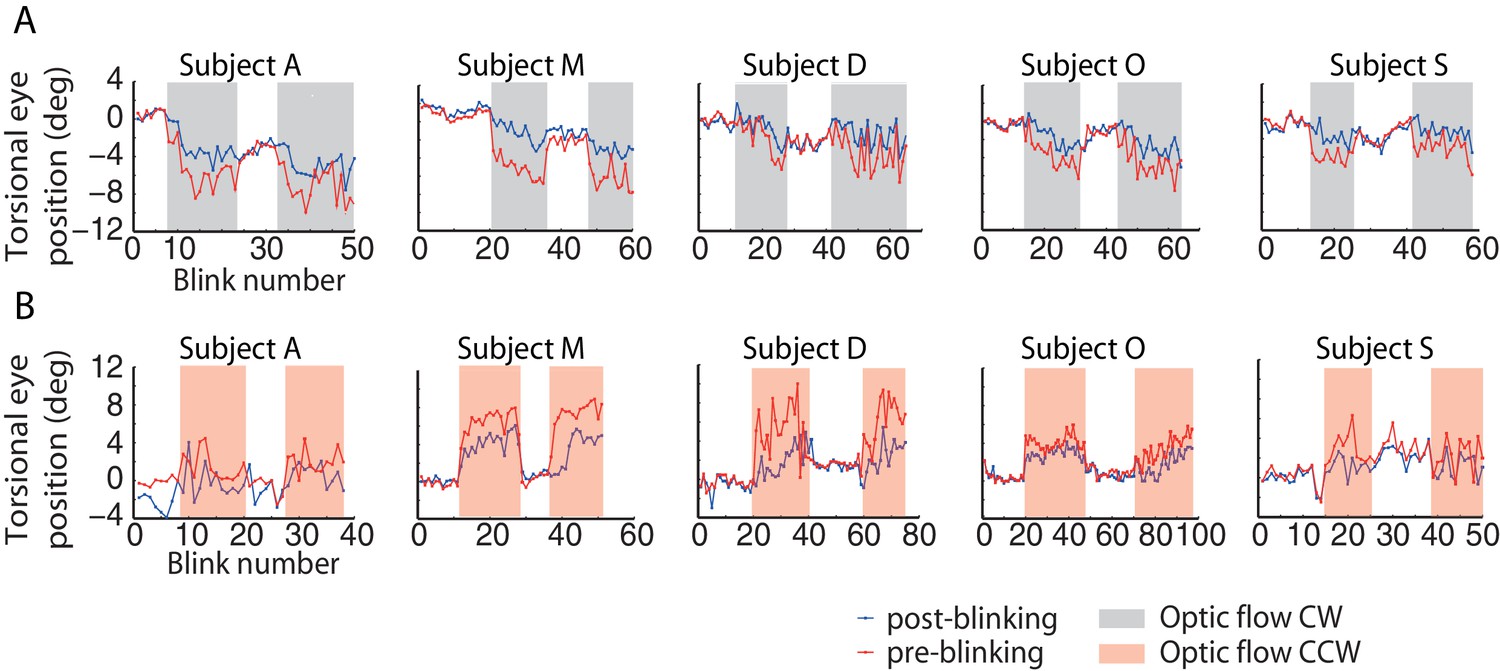
Torsional eye position before and after blinking for one experimental block per optic flow direction.
The ‘optic flow’ phase I and II, separated by phases of darkness, are demarcated by shaded backgrounds, (A) counterclockwise optic flow, (B) clockwise optic flow. Note the difference in torsional eye position before (red lines) and after blinking (blue lines). The number of spontaneous blinks varied between blocks and subjects. Note the small change in torsional eye position after blinking during darkness phases and the large change during the ‘optic flow’ phases.
Figure 3 with 1 supplement
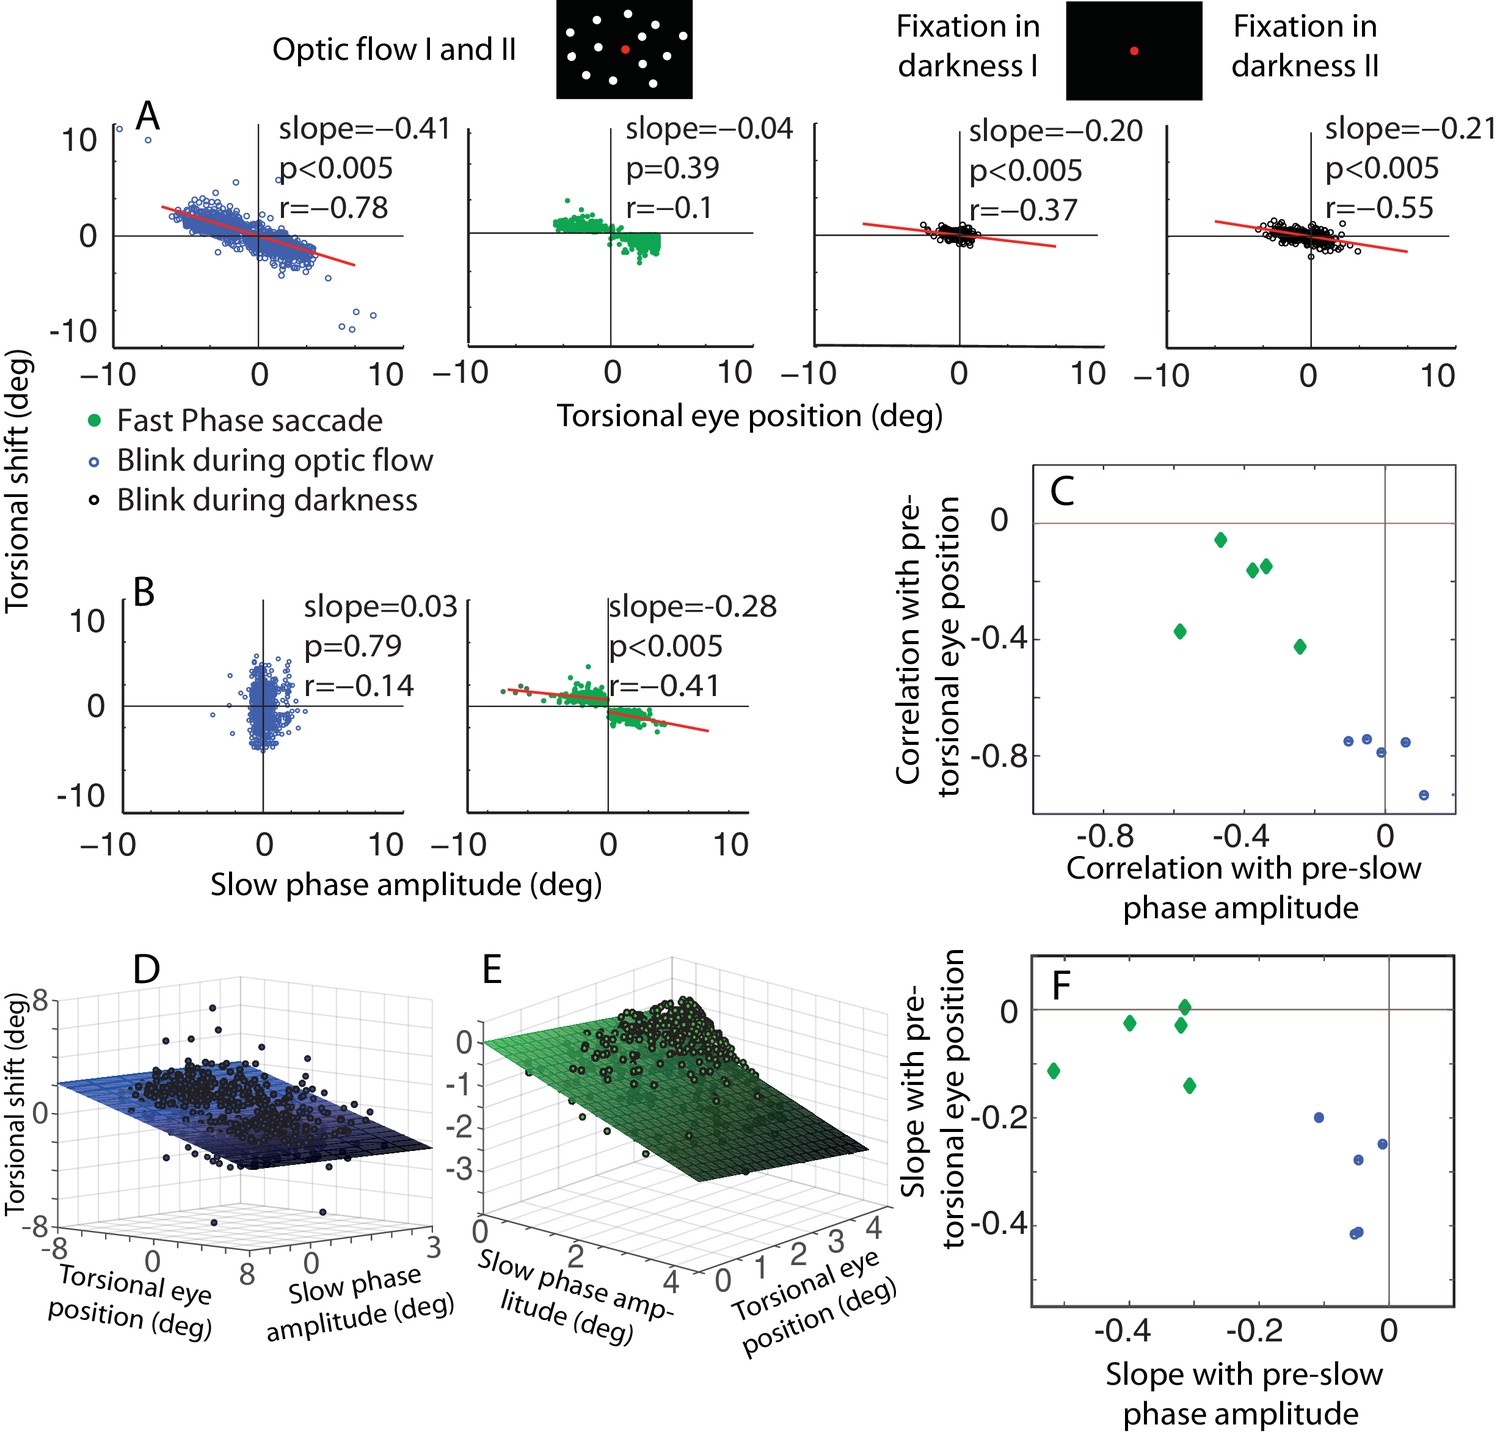
The dependence of the size of eye torsion resetting on the torsional eye position before the onset of resetting is specific for BARMs.
(A) The torsional shift of BARMs during optic flow and darkness, and the torsional shift of fast phase saccades during optic flow is plotted as function of the torsional eye position before the shift for the subject O. Note the strong dependence of the shift size on the pre-shift torsional eye position for BARMs (blue), but not for fast phase saccades (green). This dependence of BARMs is stronger for optic flow backgrounds (blue) than for dark backgrounds (black). The regression lines (red) are only drawn in case of significant correlations (see Materials and methods). (B) The torsional shift of BARMs and fast phase saccades is plotted as function of the amplitude of the preceding slow phase for the subject O. In contrast to (A), the torsional shift of fast phases but not that of BARMs showed a dependence on slow phases. When there are two regression lines plotted the values listed refer to the mean of values derived from both regression analyses (see Materials and methods). In (C) the mean correlation coefficients (95% confidence interval) between torsional shift and pre-shift eye position (y-axis) are plotted relative to those between torsional shift and pre-shift slow phase amplitude (x-axis) for each of the 5 subjects separately for BARMs (blue) and fast phases (green). The clear distinction between BARMs and fast phases in their torsional shift dependence on eye position (BARMs) or preceding slow phase (fast phases) is apparent. The borders of the 95% confidence interval are not visible because they are very small (see Materials and methods). (D) The differential dependence of torsional shift on pre-shift eye position and pre-shift slow phase amplitude for BARMs is indicated by clearly different 2D linear regression fits (based on the ‘optic flow’ phases, subject O). The tilt of the plane and the change of the darkness of color along the torsional eye position axis illustrates the major role of pre-shift eye position for the torsional shift. (E) For fast phases (clockwise optic flow, subject O) the plane is tilted and the darkness of color changes along the slow phase amplitude axis demonstrating the major role of pre-shift slow phase amplitude for the torsional shift by fast phases. (F) Similar to (C) the slopes of the 2D regression analysis are shown for all subjects separately for BARMs and fast phases. The distinction between both is reproduced.
Figure 3—figure supplement 1
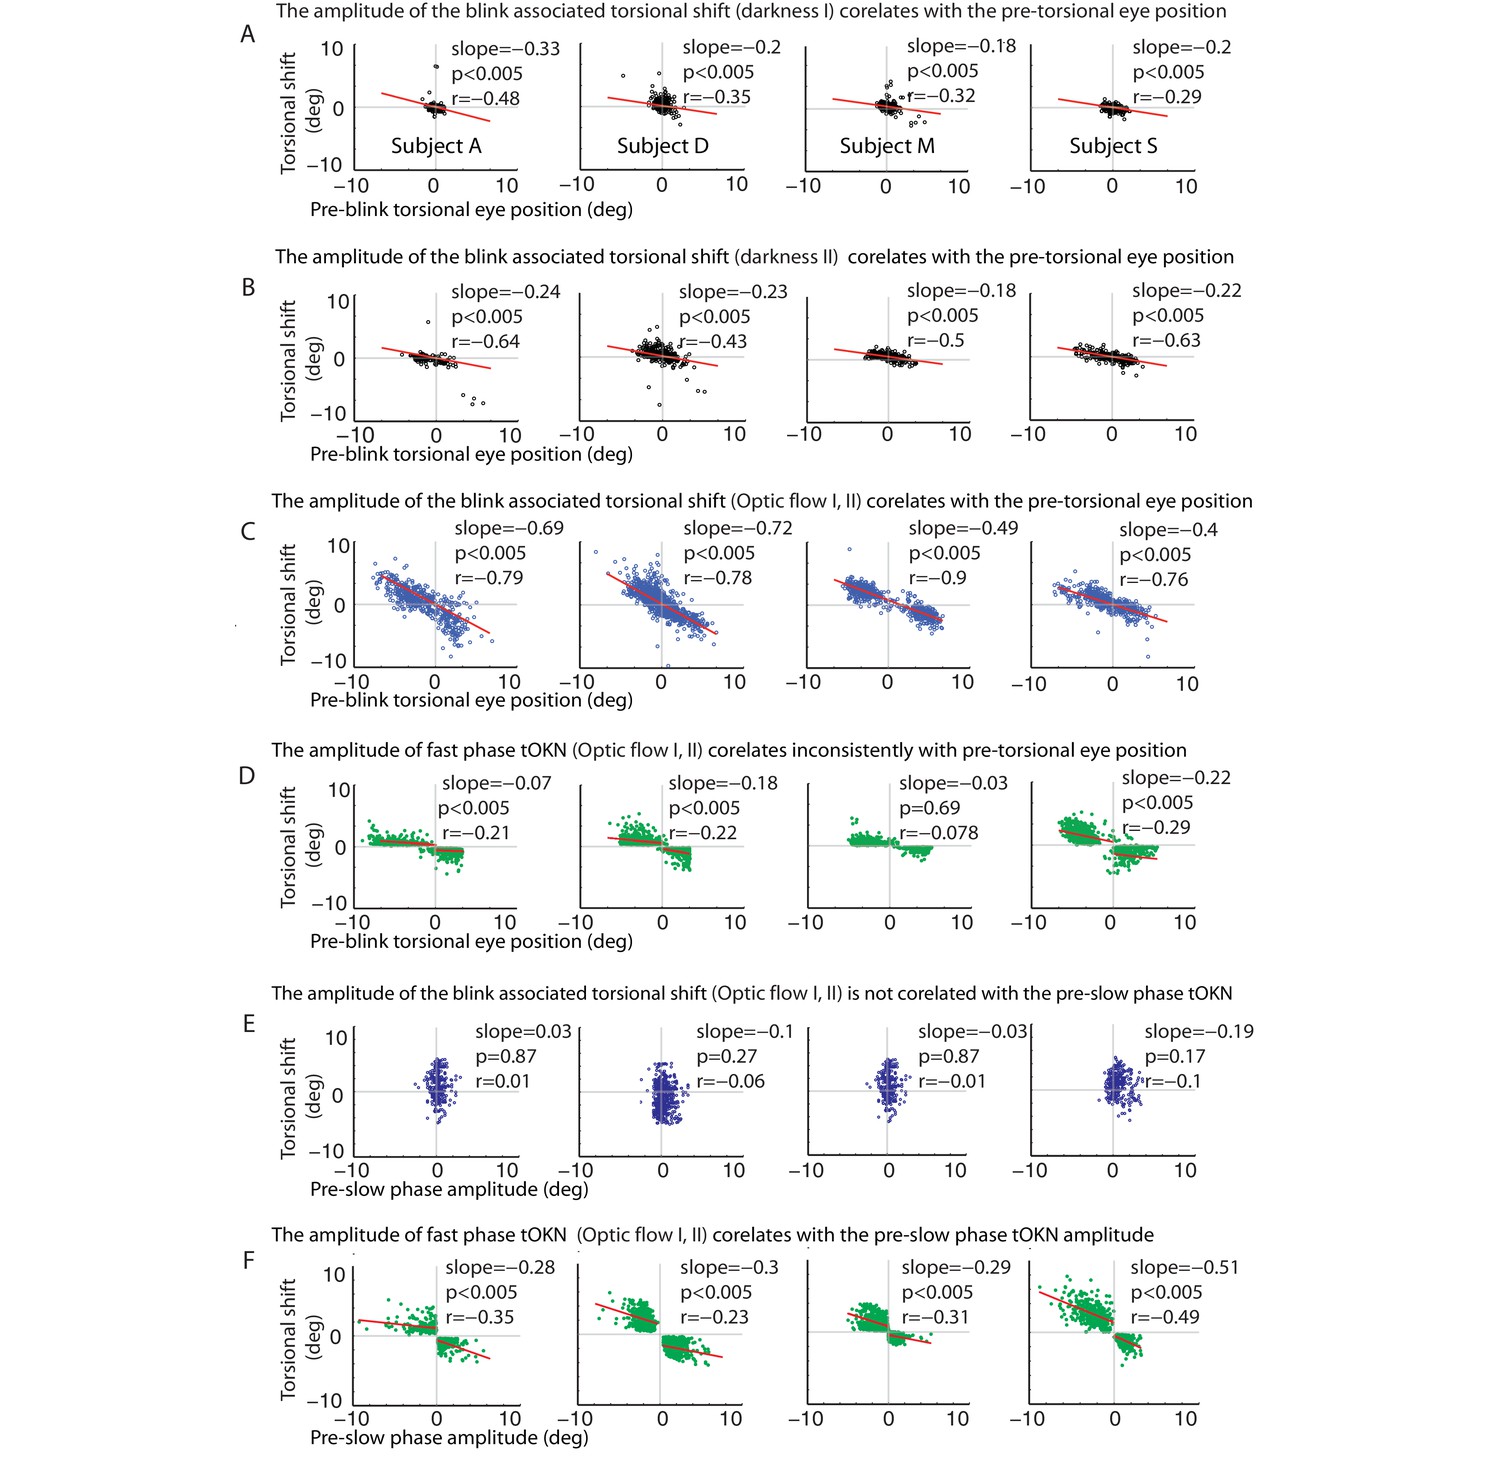
Correlations of the torsional shift associated with blinks or fast phases with the pre-shift torsional eye position (A–C) and the preceding slow phase amplitude (D–F), respectively, for all subjects (except for subject O, shown in Figure 3).
(A) Blinks during the ‘fixation in darkness’ phase I: the torsional shift vs. pre-blink torsional eye position for blinks pooled over all experimental blocks. (B) Same as A, but for the ‘fixation in darkness’ phase II. Note that the slope is steeper than for the ‘fixation in darkness’ phase I. (C) Same as A and B but for the ‘optic flow’ phase I and II. Note that the slope is even steeper than for the ‘fixation in darkness’ phase I. (D) Fast phases during the ‘optic flow’ phase I and II: the torsional shift vs. pre-shift torsional eye position for fast phases pooled over all experimental blocks. Note that these correlations are inconsistent for all subjects and their slopes are small compared to the blink related ones in A-C. For better comparison the scale of the y-axis is kept constant from A to F. (E) Blinks during the ‘optic flow’ phase I and II: the torsional shift vs. pre-shift amplitude of slow phases for blinks pooled over all experimental blocks. There is no significant correlation. (F) Fast phases during the ‘optic flow’ phase I and II: the torsional shift vs. pre-shift amplitude of slow phases for fast phases pooled over all experimental blocks. Significant correlations were observed in all subjects separately for each direction of optic flow. When there are two regression lines plotted the values listed refer to the mean of values derived from both regression analyses.
Figure 4
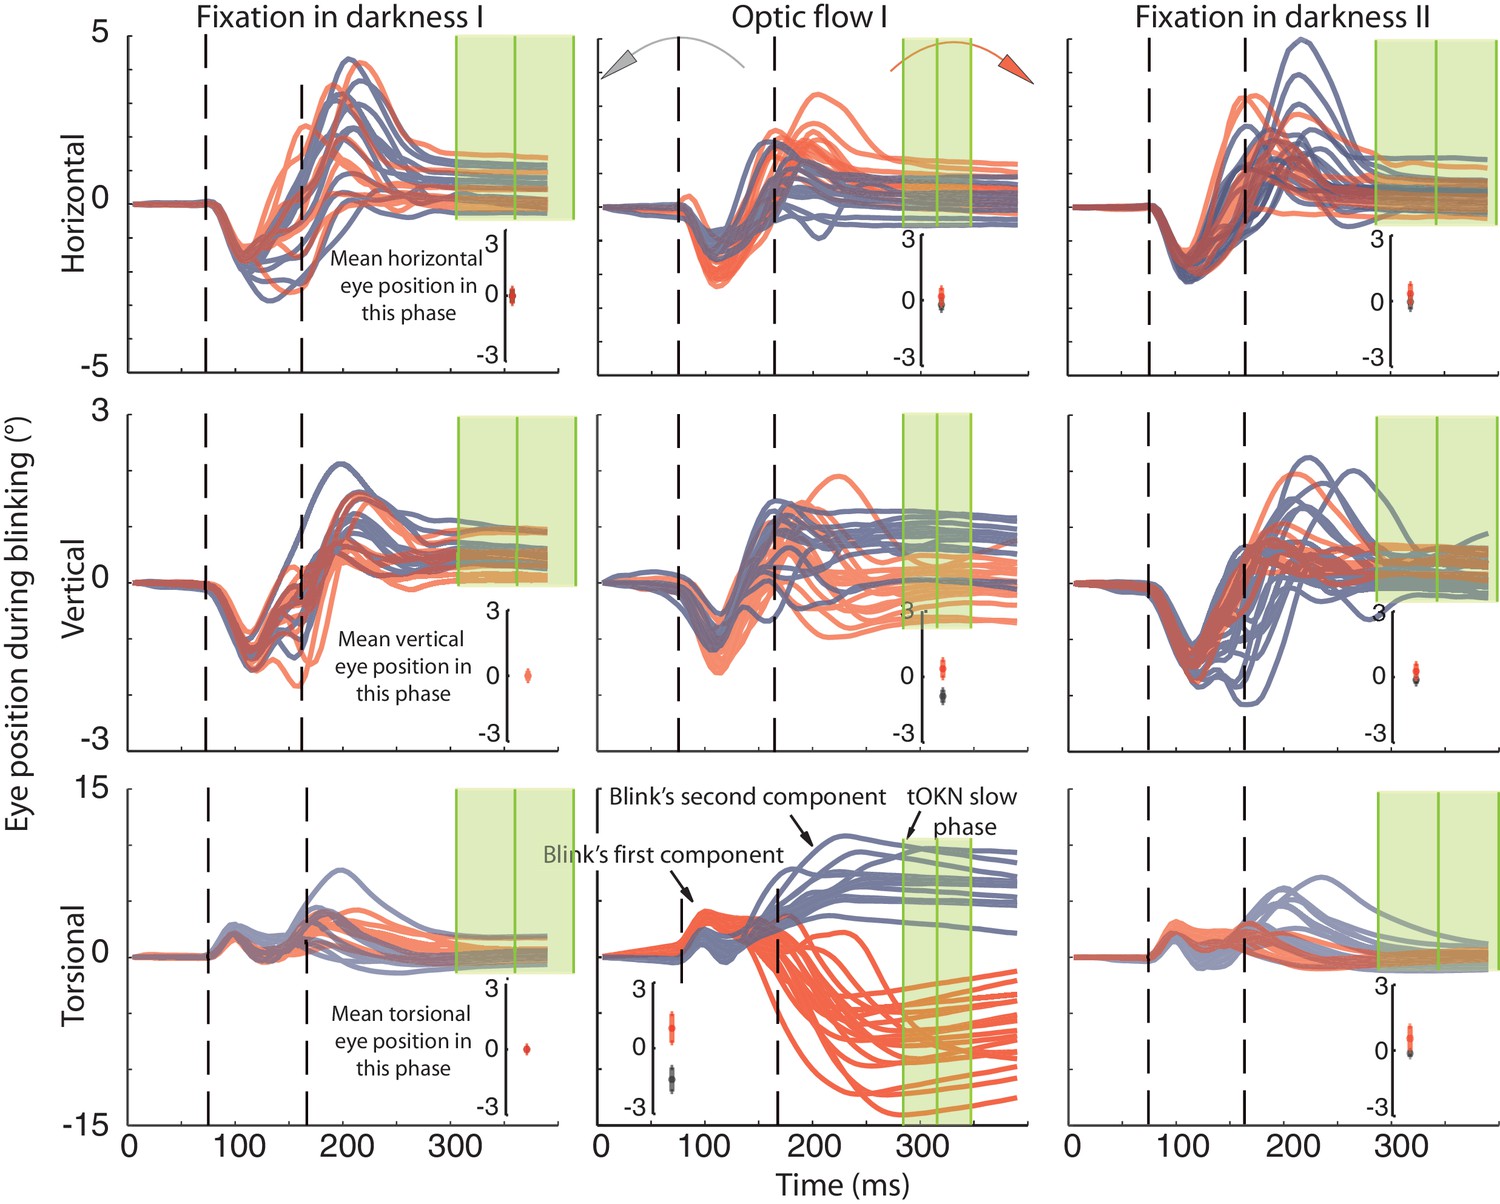
Recording of eye movements during blinks with search coils.
The horizontal, vertical and torsional eye movements observed during blinks are shown in three rows. Columns represent three different experimental phases. Red traces are eye movements from blocks in which the optic flow during the ‘optic flow’ phase I rotated CW, grey traces indicate blocks with CCW optic flow. The same color code is used to distinguish eye movements in the two darkness phases, which preceded the ‘fixation in darkness’ phase I or followed by the ‘fixation in darkness’ ‘phase II’ the one with CW or CCW optic flow. To facilitate the comparison of eye movement directions during blinks with the overall eye position during a phase, the insets in each panel plot the mean eye position (± std) for the whole duration of the respective experimental phase. Note that the torsional eye movement response consists of two distinct components: the first one is positively (= extorsionally) directed and constant across the three phases, whereas the following second component is directed opposite to the overall eye position of a phase in accordance with a role in resetting the eye torsion to zero. For better visibility the torsional component is 3-times magnified (indicated by the difference in the scale of the y-axis). The eye traces are aligned to the peak velocity of the first component. Eye traces are plotted from 80 ms before and 300 ms after that time. Dashed vertical lines indicate the mean start and end of blinks obtained from the video eye tracking (see Materials and methods). To show the time points used for determining the eye position after the blink (blink end plus safety temporal distance to avoid artifacts) vertical green lines with shadows were added representing the mean ± std (across experimental blocks for Ha). Note that the second component starts during the eyelid closure and it proceeds after the point of recognizing the pupil (second dashed line), which could be during partially opened lid and not necessarily at the offset of the eyelid opening (see Materials and methods). The blink starting point taking the safety temporal distance in to account lays with around 50 ms before the onset of the figure.
Figure 5
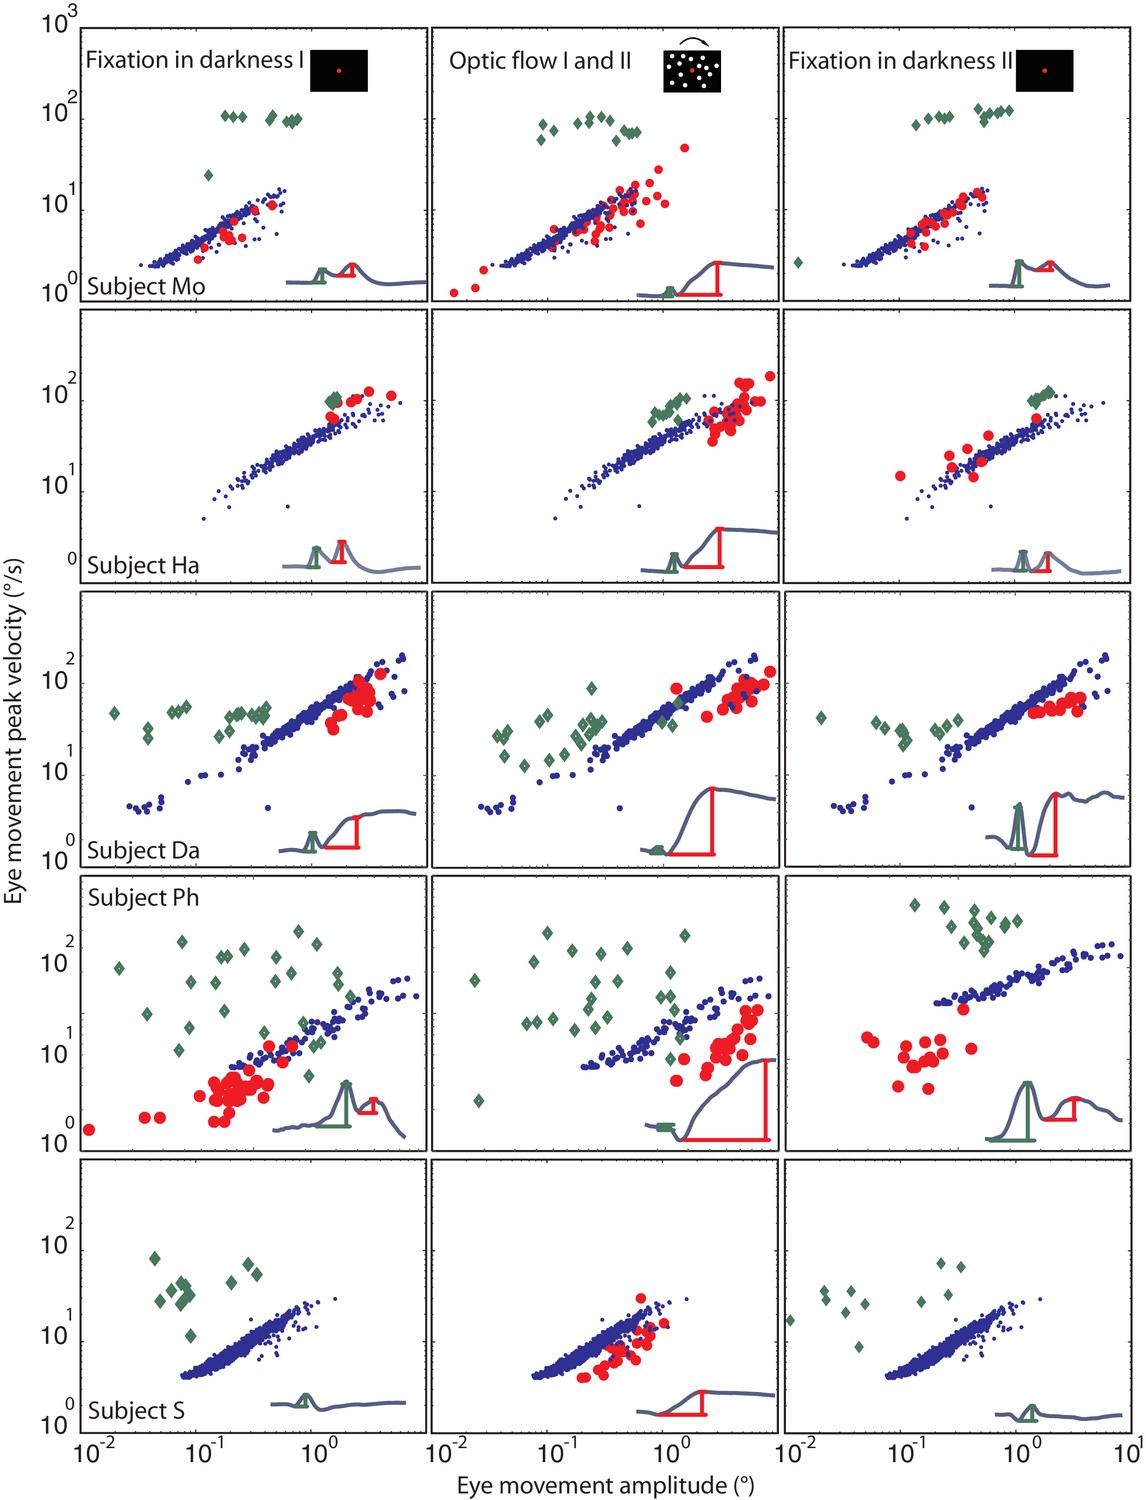
Eye movement peak velocity as a function of BARMs amplitude.
The peak velocity of the eye movements is drawn on the y-axis vs. their amplitude on the x-axis. The first component of blink related torsional movement is drawn in green diamonds, the second component (BARMs) in red circles, and the fast phase of tOKN in blue dots. The 5 rows show search coil recordings from 5 subjects. The 3 columns represent the consecutive experimental phases with the exception of the fast phases (blue) which were recorded in the ‘optic flow’ phase I and II but are additionally plotted in the other two phases to facilitate the comparison. In subject S, wherein the two components of the eye movement are hardly distinguishable the eye movement is considered as first component in the darkness phases I and II but as second component in the optic flow phases. Accepting this qualification the two components of all subjects form two separate distributions. Both are different from the main sequence of fast phases with the first component lacking a consistent velocity-amplitude relationship and the second component having a smaller slope of the velocity-amplitude relationship than fast phases.
Figure 6 with 1 supplement
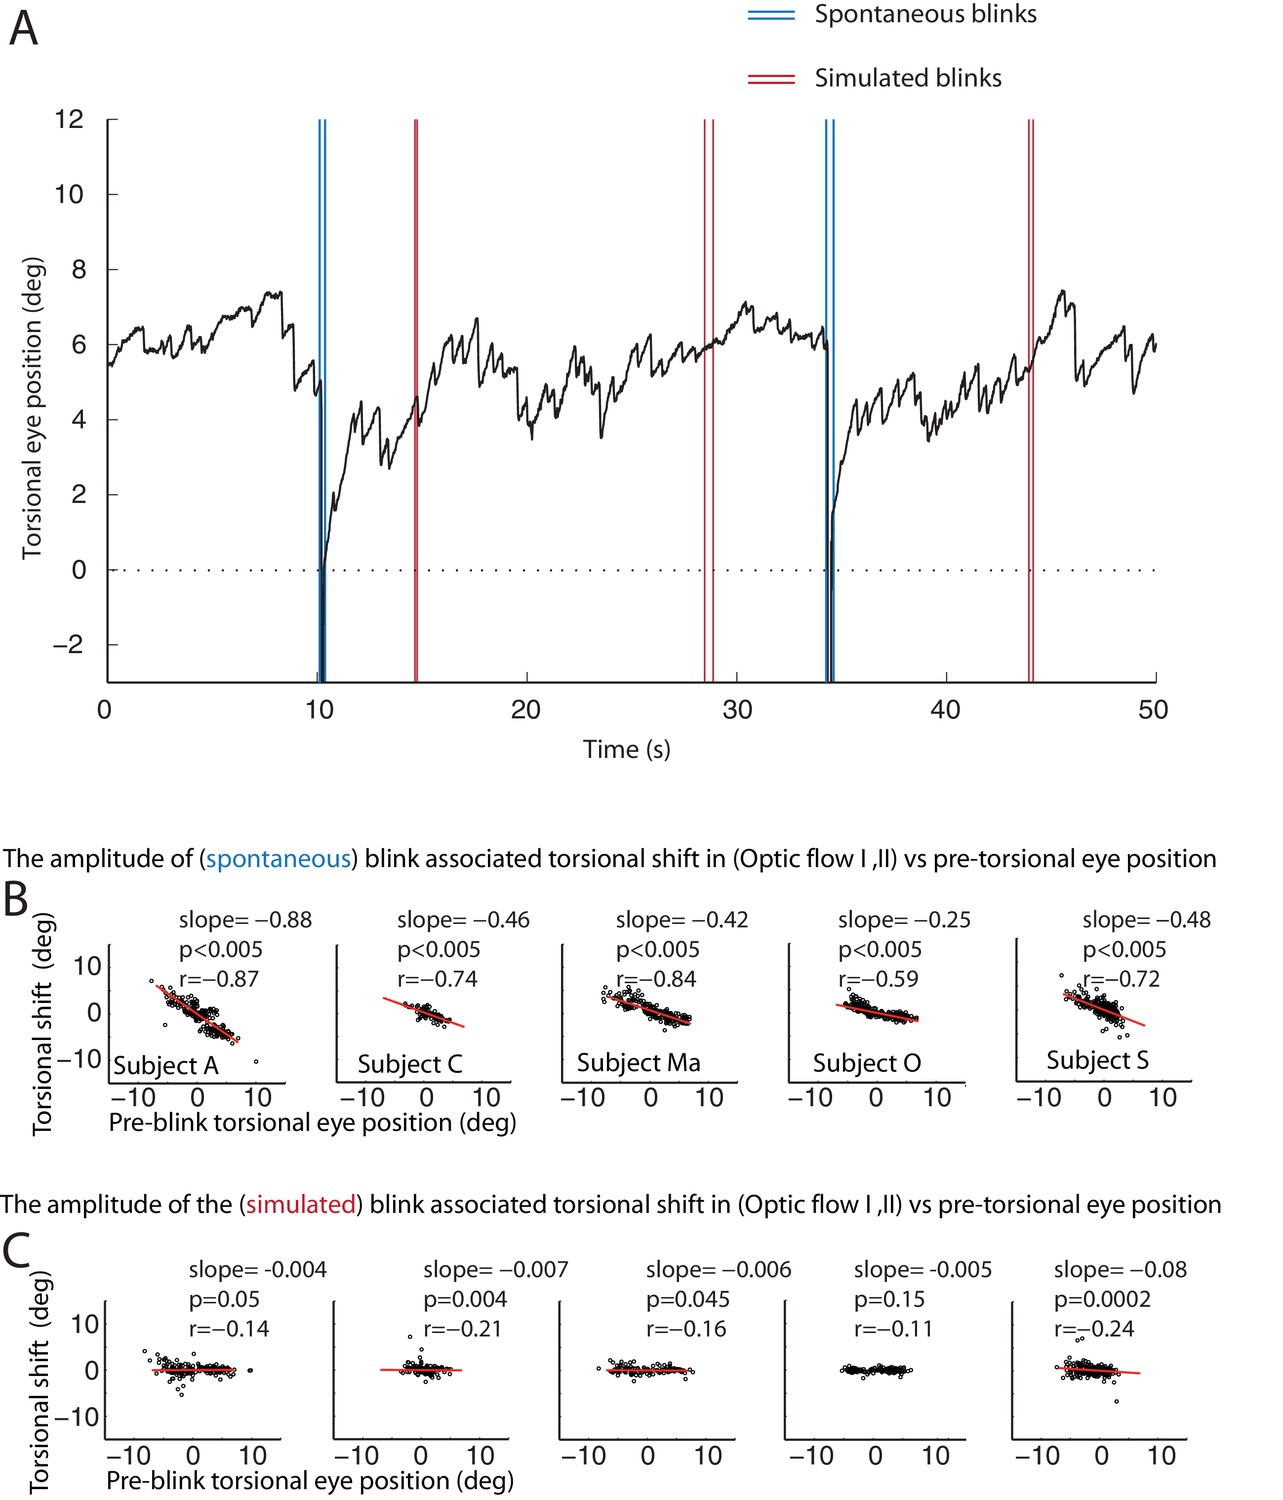
The resetting of the eye torsion is associated with spontanous blinks and not due to stopping the optic flow.
(A) Torsional eye position before and after spontaneous and simulated blinks. Onsets and offsets of spontaneous blinks (blue) and simulated blinks (red). Spontaneous as well as simulated blinks had variable durations. Note change of the torsional eye position only after spontaneous but not after simulated blinks. (B) The torsional shift associated with spontaneous blinks drawn against the pre-blink torsional eye position. Note the significant correlations. (C) The torsional shift associated with simulated blinks drawn against pre-blink torsional eye position. Note that although the correlation between the torisonal shift and the pre-blink torsional eye position for the simulated blinks is significant in some subjects the slope is almost zero.
Figure 6—figure supplement 1
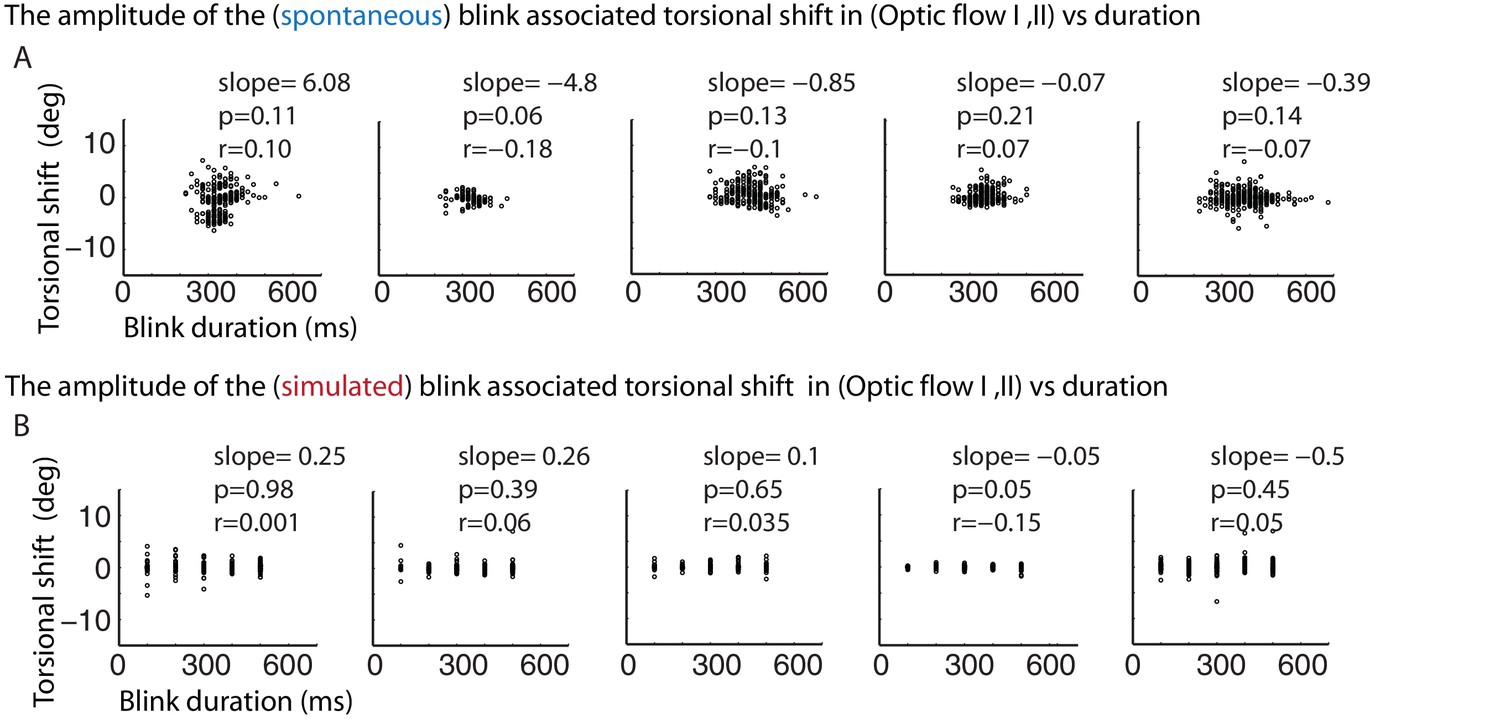
Correlations of torsional eye position shift and the duration of spontaneous and simulated blinks during torsional optic flow.
(A) The torsional shift associated with spontaneous blinks drawn against the spontaneous blinks’ durations. (B) The torsional shift associated with simulated blinks drawn against the duration of simulated blinks. Note that there is neither a correlation between the duration of spontaneous nor between simulated blinks and the torsional shift.
Figure 7
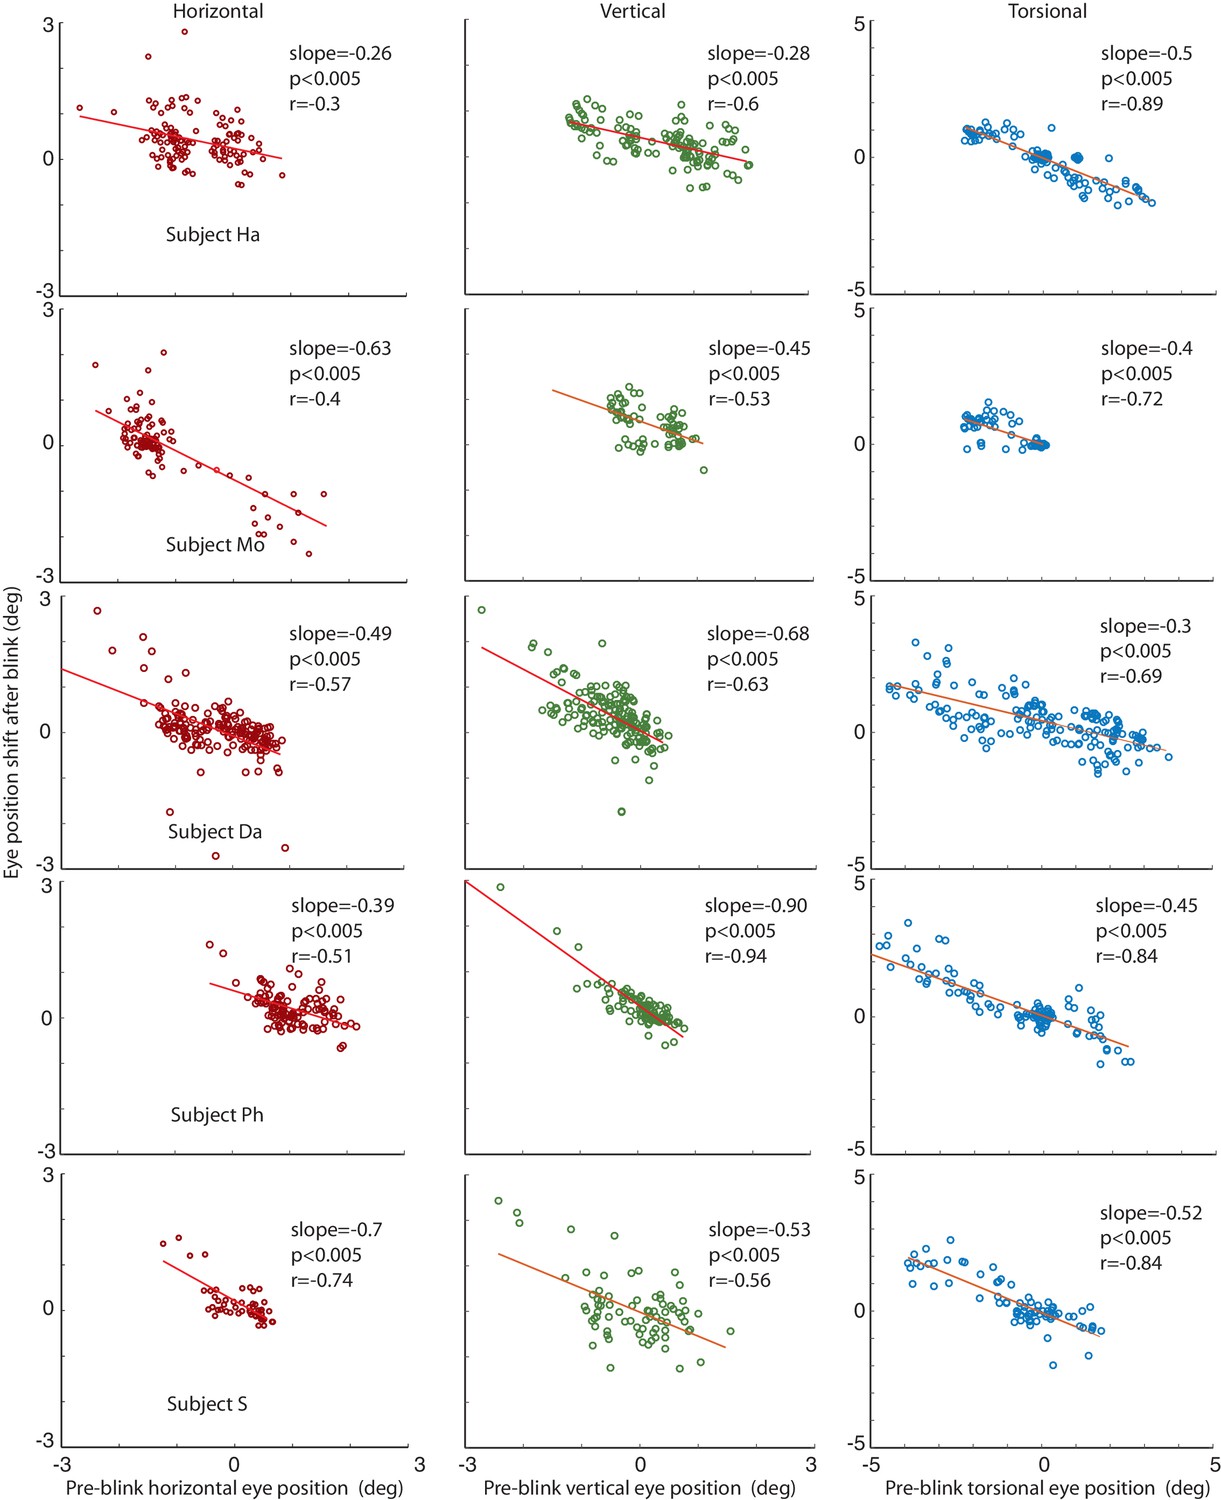
Correlations of the amplitude of the horizontal, vertical and torsional shifts after blinks with pre-blink eye position recorded using the eye coil.
The horizontal eye position shift after blinking is plotted against the horizontal pre-blink eye position for 5 subjects in the first column (red circles). The vertical eye positions are plotted in the second column (green circles), and the torsional in the third (blue circles). Note that there is a significant correlation of the size of the shift after the blink with the pre-blink eye position.
Tables
Table 1
Relationship between torsional shifts of BARM’s and pre-blink eye position for different experimental phases and ranges of pre-blink eye torsion. The steeper slopes and larger correlation coefficients for the ‘optic flow’ phase I and II are also observed when restricting the range of pre-blink eye torsion. Also the steeper slopes and larger correlation coefficients in the ‘fixation in darkness’ phase II as compared to the ‘fixation in darkness’ phase I are maintained when analyzing the restricted range for pooled data from all subjects and experimental blocks.
| Phase | Regression slope (mean ± std) | Correlation (mean ± std) | P-value of the correlations |
|---|---|---|---|
| fixation in darkness phase I | −0.26 ± 0.09 | −0.33 ± 0.1 | p<0.005 |
| optic flow phase I and II | −0.62 ± 0.163 | −0.73 ± 0.19 | p<0.005 |
| fixation in darkness phase II | −0.28 ± 0.15 | −0.48 ± 0.1 | p<0.005 |
| fixation in darkness phase I (−2° to 2°) | −0.08 ± 0.09 | −0.18 ± 0.14 | p<0.005 |
| optic flow phase I and II (−2° to 2°) | −0.43 ± 0.1 | −0.60 ± 0.25 | p<0.005 |
| fixation in darkness phase II (−2° to 2°) | 0.12 ± 0.07 | −0.25 ± 0.08 | p<0.005 |
Download links
A two-part list of links to download the article, or parts of the article, in various formats.
Downloads (link to download the article as PDF)
Open citations (links to open the citations from this article in various online reference manager services)
Cite this article (links to download the citations from this article in formats compatible with various reference manager tools)
A new motor synergy that serves the needs of oculomotor and eye lid systems while keeping the downtime of vision minimal
eLife 5:e16290.
https://doi.org/10.7554/eLife.16290


