Energy conservation by collective movement in schooling fish
- Department of Organismic and Evolutionary Biology, Harvard University, United States
Figures
Figure 1

A summary of biomechanical principles underlying proposed hydrodynamic advantages of schooling behavior in fish.
When fish swim into free-stream flow (Ufs), experimental data show that fish schools are dynamic with fish changing position frequently. Regardless of fish position within a school and changes in relative position, theoretical and robotic analyses have demonstrated that at least four mechanisms (indicated by numbers) provide an advantage in the form of reduced power consumption. 1. Reduced oncoming velocity (U2) requires less thrust for a fish swimming in the wake between two leading fish (Weihs, 1973); 2. The Knoller-Betz effect of leading edge suction reduces costs for a trailing fish due to accelerated oscillating flow at the head (U1) (Jones et al., 1998; Saadat et al., 2021); 3. Added mass ‘push’ from follower to leader can reduce costs for the leader in front of another fish (Fish and Hui, 1991; Kurt and Moored, 2018; Saadat et al., 2021); 4. Wall effects benefit neighboring fish where swimming next to another fish reduces swimming costs (Daghooghi and Borazjani, 2015; Li et al., 2020). These principles suggest that regardless of the relative positions of the individuals within the fish school, the fish school as a collective unit should be able to save metabolic energy compared to a solitary fish swimming in Ufs.
Figure 2

Measurements of aerobic and anaerobic locomotor cost of fish schools and solitary fish.
(A) Average traces of metabolic rate (ṀO2) of fish schools over a 40 hr experiment. Following the first 18 hr quiescent state, a critical swimming speed (Ucrit) test quantifies the aerobic cost of active swimming. The ensuing 18 hr measurement of excess post-exercise oxygen consumption (EPOC) quantifies the anaerobic cost. (B) Comparison of ṀO2 for conditions of aggregating behavior, minimum demand speed, and resting condition with minimal flow (ṀO2aggregate, ṀO2min, ṀO2rest) (C) Comparisons of concave upward shaped ṀO2-speed curve over the entire range (0.3–8 body length s–1, BL s–1) and (D) the concave shaped ṀO2-speed curve at the lower speeds (0.3–3 BL s–1). (E, F) Percentage (%) aerobic scope used by fish schools and solitary fish during the Ucrit test. (G, H) Comparisons of EPOC and EPOC durations between fish schools and solitary fish. Statistical significance is denoted by asterisk(s). Green color = school data (n=5 schools); blue color = solitary fish data (n=5 individual fish); shading indicates the 95% confidence interval. Statistical details are available in the statistical analyses section.
Figure 3
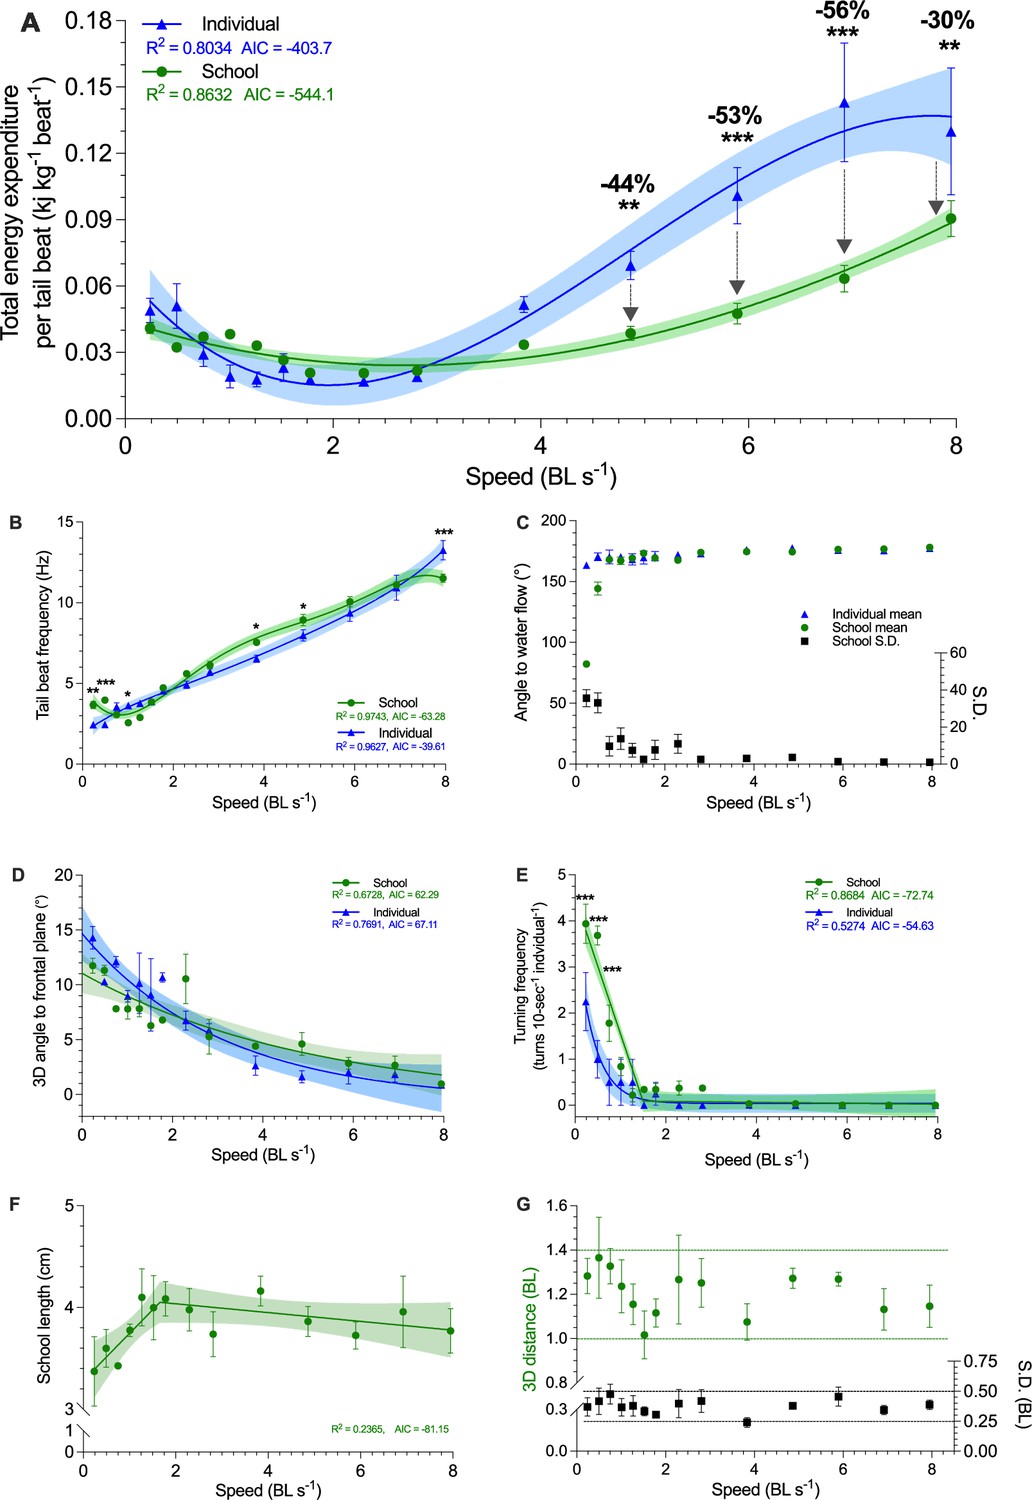
Three-dimensional characterization of swimming kinematics and fish schooling dynamics as a function of speed.
(A) Total energy expenditure (TEE) per tail beat, (B) Tail beat frequency, (C) The angle of fish to free-stream water flow, measured as the mean and the S.D. of the angles of the individuals within the school. (D) Three-dimensional angle of fish to the frontal plane. (E) Turning frequency, (F) Three-dimensional school length. (G) Three-dimensional distances among all individuals in the school and the S.D. of the distance. The upper and lower boundaries of the metrics are indicated. Statistical significance is denoted by asterisk(s). Green color = school data (n=3–4); blue color = solitary fish data (n=3–4); shading indicates the 95% confidence interval. See materials and methods for details of three-dimensional reconstruction and statistics.
Figure 4

Modeling of simultaneous aerobic and non-aerobic costs of fish schools and solitary fish for a critical swimming speed (Ucrit) test.
(A) Modeling the O2 cost of the metabolic rate (ṀO2)-speed curve and the ensuing recovery cost (excess post-exercise oxygen consumption, EPOC) as a function of speed. After Ucrit, fish returned to the same resting ṀO2 (ṀO2rest) as a pre-test. (B, C) In addition to ṀO2 (solid line and filled symbols), we modeled the total O2 cost (dash line and half-filled symbols) for fish schools and solitary fish and when performing the Ucrit swimming test. The estimated partitioning of aerobic and non-aerobic contributions to swimming are denoted (red-&-bold) with respect to speed for 4–8 BL s–1 is shown below each graph. (D, E) Using total O2 cost, we computed total energy expenditure (10 min period per point) and the total cost of transport (including both aerobic metabolism, high-energy phosphate, and anaerobic glycolysis) for both fish schools and solitary fish. Statistical significance is denoted by asterisk(s). Green color = school data (n=5); blue color = solitary fish data (n=5); shading indicates the 95% confidence interval. See materials and methods for modeling and statistical details.
Appendix 1—figure 1

Swimming speeds of fish schools and seasonal migratory speeds in the open ocean.
The figure is based on a summary of the swimming speed data from the literature (see Supplementary file 1 for details). We report the relative swimming speed (in body length per second, BL s-1) to account for the size range of species studied. We distinguished the data reported for peak speed and average speed for fish schools. Notably, schools can reach a peak speed that is nearly twice that of the average speed when they school actively in the ocean. Seasonal migratory speeds are most commonly obtained from animal-borne sensors, and data in the current literature currently skew toward large migratory species due to the technical limitations of attaching relatively large tags. Nevertheless, these are the best data available to estimate migratory speeds over long durations. A key criterion that we used in compiling these data is that the measurements are obtained from field settings e.g. estuaries and oceans. Our objective is to understand a wide range of swimming speeds of fish schools in natural habitats. This analysis demonstrates that fish schools often swim at high speeds (> 6 body length s-1) when moving in open-water habitats. According to the results of our metabolic testing, the high speeds of swimming observed in fish schools are sustained by a substantial amount of energy contributed by glycolytic metabolism. At higher speeds, our laboratory testing results demonstrate that schooling dynamics saved a substantial amount of total energy expenditure (TEE) when the energetic cost by fluid drag is at a premium. Data on seasonal migratory speeds also match our laboratory testing results showing that solitary individuals and fish schools have a minimum absolute energetic cost when swimming around ~1 BL s-1. A version of this figure is published in Zhang and Lauder, 2023.
Appendix 1—figure 2

Frames from high-speed video to show different formations of fish schools studied in the respirometer.
(A) Aggregating is non-directional swimming at low speeds with low net forward speed; (B) Grouping is a non-specific aggregation with fish more closely grouped together; (C) Shoaling is often manifested as individuals in groups showing various orientations with low mean forward directional group movement speed; (D) Active directional schooling at low speed occurs when all fish have similar body orientation with low mean group forward speed accompanied by few individuals showing a variety of inclined body angles; (E) Active directional schooling at high speed occurs when all fish swimming in the school have nearly the same body orientation with high mean group forward speed and all fish are oriented with body angles directed into the oncoming flow. Supplementary file 1a presents different terms used to describe fish collective behaviors and the swimming speeds commonly associated with each term.
Appendix 1—figure 3

Three-day protocol for measuring whole-animal oxygen uptake (ṀO2) to estimate the contribution of aerobic and non-aerobic energy cost to the total energy expenditure of schooling locomotion.
(A) The first ~20 h quiescent state provides a reliable baseline to estimate a resting ṀO2 (ṀO2rest). During this period, fish have not experienced the treatment effect, e.g., the swimming performance test on the 2nd day of the protocol. To minimize the inevitable handling stress, fish were gently placed in the swim-tunnel respirometry at the start of the protocol. The stable and flat ṀO2 trace during the 1st overnight quiescent period provides a reliable estimate of aerobic metabolic demand when fish are in a resting state. On the second day, a 140 min critical swimming speed (Ucrit) test characterizes the active ṀO2 of fish as a function of water velocity to evaluate the aerobic cost of swimming performance. (B) After the Ucrit test, fish are left undisturbed in the respirometer for a subsequent ~20 h to measure excess post-exercise oxygen consumption (EPOC), a metric that quantifies O2 cost of non-aerobic activities related to the high-energy phosphate and anaerobic glycolysis. EPOC is calculated as the integral area bounded by recovery ṀO2 and ṀO2rest +10%. A majority of EPOC is the deferred anaerobic cost that supported swim performance at higher speeds. Altogether, EPOC (post-Ucrit test) and active ṀO2 (during the Ucrit test) measure the total energy expenditure (TEE) of both aerobic and non-aerobic costs. Notably, the post-exercise ṀO2rest returned to a stable level prior to the Ucrit test. Had we not conducted the measurement of ṀO2rest ~20 hours prior to the Ucrit test, we could not have been sure that fish have recovered to the stable baseline before the swimming performance test. Knowing the reliable baseline improves the measurement accuracy of EPOC. In addition, the entire three-day protocol is conducted under a shrouded experimental system. This achieves the objective of eliminating visual disturbances that induce spontaneous activities and impact the metabolic rate and kinematics of fish. The videos are recorded by two high-speed cameras illuminated by an array of infrared lights.
Appendix 1—figure 4
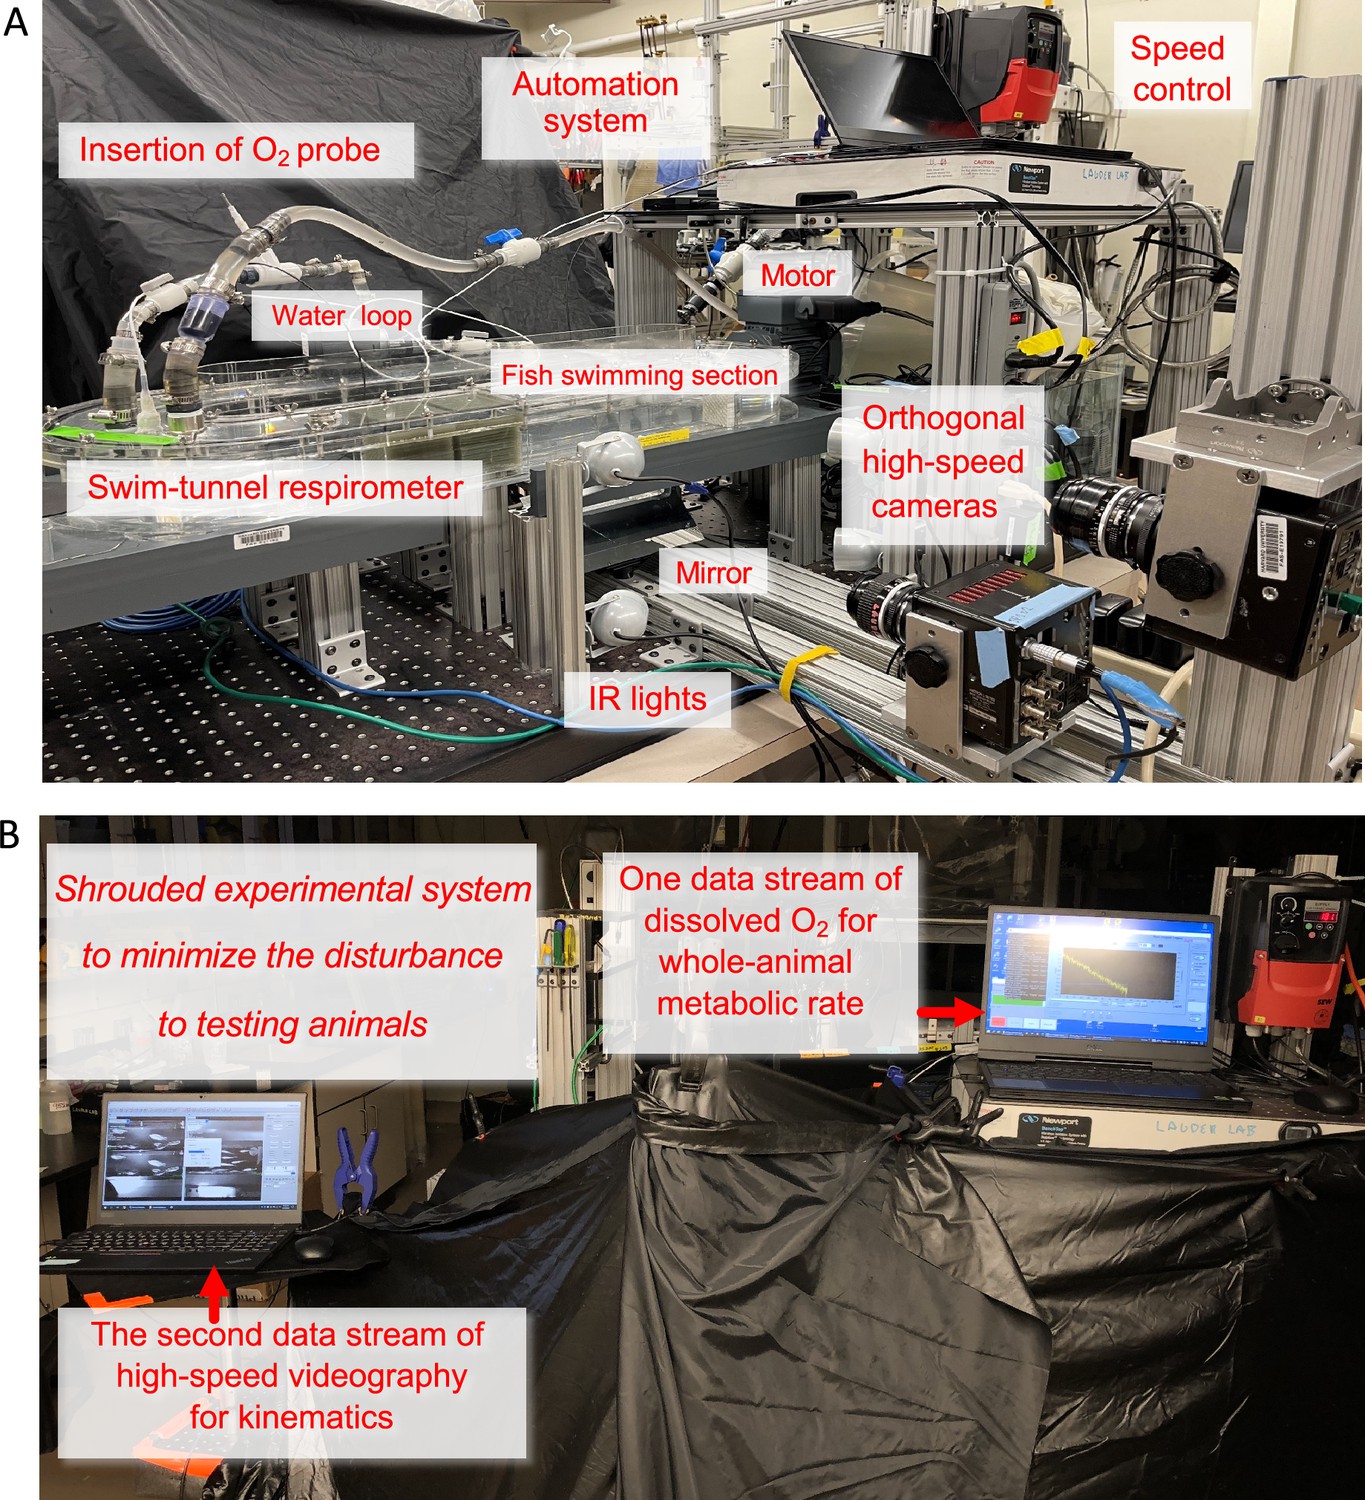
Experimental system of Integrated Biomechanics & Bioenergetic Assessment System (IBAS).
(A) The important components of IBAS are labelled. The three-dimensional biomechanics measurements are obtained by two orthogonally placed high-speed cameras aimed at the fish swimming section that is illuminated by infrared (IR) lights. The swim-tunnel respirometer is equipped with an oxygen (O2) probe inserted into a water loop that boosts the signal-to-noise ratio. The speed control system precisely regulates water velocity in a critical swimming speed test to measure the aerobic cost of locomotion. The respirometer is also automated by a computer system that is critical to measuring the non-aerobic cost of locomotion. (B) The automation system enables the fish to rest overnight in a shrouded experimental system. Minimizing the disturbance to the animals is a critical component of observing the upward concave locomotor performance curve of fish schools and solitary individuals. The automation system also measured the baseline resting metabolic rate when animals were in the 20 hr resting period before the critical swimming speed test. After the test, the automation system measured the 20 hr recovery of the whole-animal metabolic rate until it returned to the pre-testing baseline. From this, the non-aerobic cost of locomotion is measured as excess post-exercise oxygen consumption (EPOC). The IR lights enable the recording of schooling dynamics and individual kinematics when the entire system is shrouded and without bright lights influencing fish behavior. The whole-animal metabolic rate is recorded simultaneously using the respirometry system.
Appendix 1—figure 5
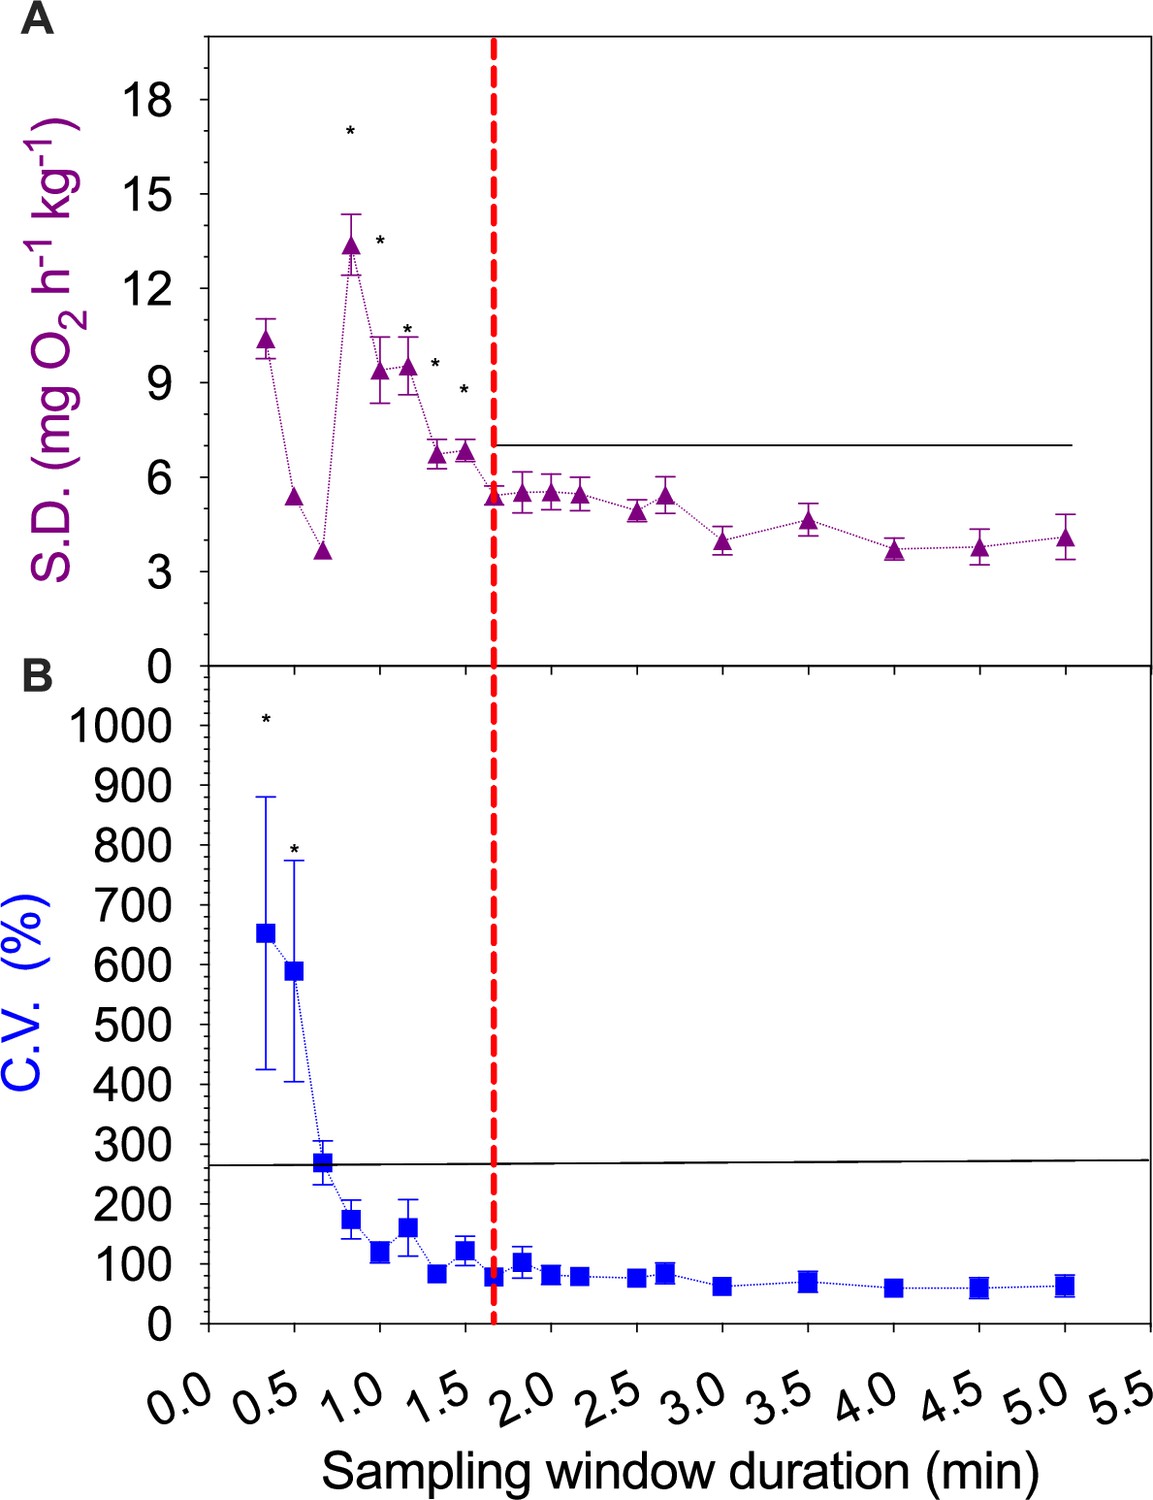
An analysis of the impact of varying the sampling window duration on estimates of individual rates of oxygen uptake (ṀO2).
The signal-to-noise ratio analyses used six independent background respirometer ṀO2 data sets in a 20 min duration. We calculated (A) standard deviations (S.D.) and (B) coefficient of variation (C.V.) for each complete data set as a function of sampling window duration (0.8–5.0 min). The S.D. and C.V. values were compared across different sampling window durations using one-way ANOVA with Tukey post-hoc tests (α<0.05). Values are presented as mean ± s.e.m. This analysis suggests that 1.67 min as a minimum conservative sampling duration (the red vertical dashed line) using the criterion of S.D. and C.V. being stable after high variation at shorter duration windows. This suggests that the 8 min sampling duration used in this study is sufficient to resolve the measurement of steady-state ṀO2 for sustained swimming. The analytic method is published in Zhang et al., 2019.
Appendix 1—figure 6

A schematic illustration of the incremental steps in swimming speed used for the critical swimming speed test (Ucrit) protocol.
Speed is presented as the relative swimming speed of fish normalized to body lengths per second (BL s–1). Each speed increment has a 10 min duration. Each vertical increment marks the increase in speed for each step. The mean velocity at fatigue is indicated by the ✶ symbol, marking the total duration of the test, after which EPOC is measured for a 20 hr period.
Appendix 1—figure 7

Stability of whole-animal oxygen uptake (ṀO2) profile when fish swim steadily at low water velocity.
The quality of ṀO2 measurement over the range of relative swimming speeds (body length per sec, BL s–1) where fish show the lowest ṀO2 is critical to assure the accuracy of quantifying concave upward shaped metabolism-speed curve. Hence, we conducted an additional quality assurance test to inspect the stability of ṀO2 at 1.25 (A), 1.5 (B), 1.75 (C) & 2.0 (D) BL s–1 over a 30 min period. ṀO2 recorded in the first 10 mins is within the same range as the ensuing 20 mins. Thus, our 10 min testing period at each water velocity provides a reliable estimate of the aerobic cost when fish swim at a given swimming speed. This conclusion is in agreement with the same testing period used in a previous study (Di Santo et al., 2017).
Appendix 1—figure 8
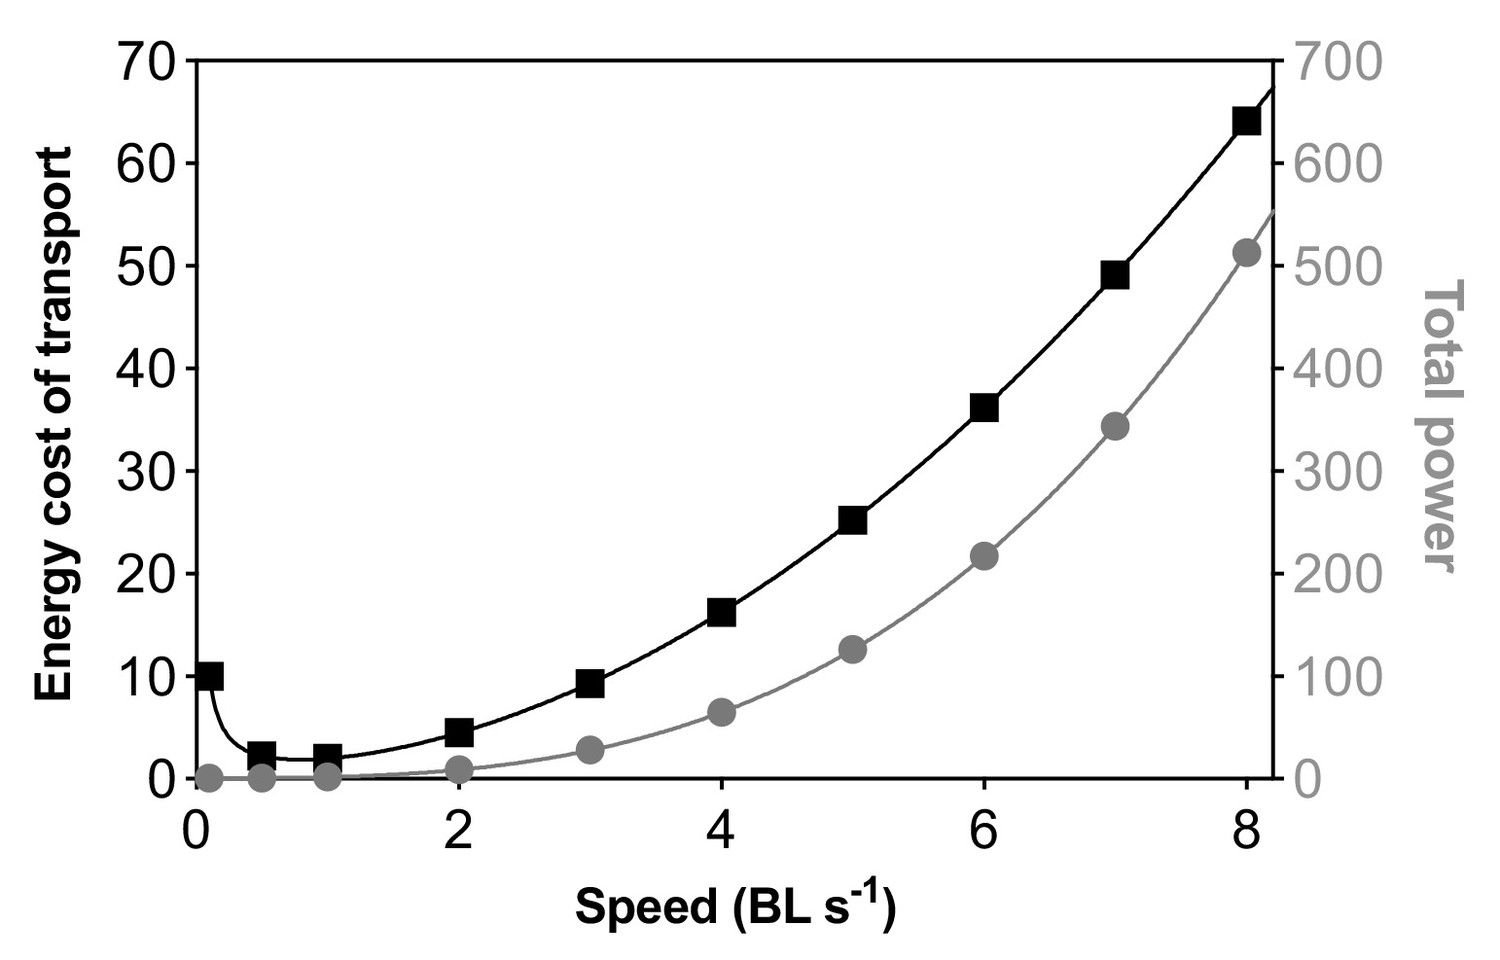
Illustration of the theoretical relationship between the cost of transport and total power as a function of nominal speed based on the estimated power required to swim as drag forces increase at increasing swimming speeds.
The equation for the energy cost of transport is y=0.9996 x–1 + x2 (power series model: R2=1, AIC = –127.6). The equation of total power is y=1.001–0.000643 x+8.564e–005x2 + 1x3 (polynomial model: R2=1, AIC = –138.7). Notably, the same models provided best-fit equations to describe the measurement of the cost of transport and total energy expenditure (aerobic and glycolytic metabolism) on live fish. This suggests that total energy expenditure during fish locomotion at increasing speed may be largely due to the requirement to overcome fluid dynamic drag. The theoretical numbers (nominal) of power and energy cost of transport are adopted from D. Robinson, Ed., Animal Performance (The Open University, Milton Keynes, 1997). Speed is given in body lengths per second (BL s–1) while the power and energy axes are unitless relative numbers.
Appendix 1—figure 9

Photographs of the ‘spike’ calibration device used to map the three-dimensional (3-D) space of the fish swimming section inside the swim-tunnel respirometer.
This direct linear transformation calibration system provided accurate 3D coordinates within the swimming arena for both individual danio and schools of up to 8 danio. The tip of each spike provides a marker for spatial coordinates. Each tip has a known three-dimensional coordinate based on the known distance on the x-(length), y-(width) & z-(height) axes. Lateral (A) and dorsal (B) views are provided. The ‘spike’ calibration provides 45 spatial points to sufficiently cover a volume of 1440•103 mm3. The spatial calibration is used by DLTdv8 software (Hedrick, 2008, Bioinspiration & Biomimetics 3, 034001) to extract the three-dimensional coordinates for locations digitized on individual fish (see Appendix 1—figure 10).
Appendix 1—figure 10

Landmarks placed on individual giant danio (Devario aequipinnatus) as well as individuals within the school to digitize 3D body locations during locomotion.
We marked the peduncle (marker #1), upper jaw (marker #3) and the right angle cross point (marker #2) of the peduncle and jaws for each individual (both for solitary individuals and fish in schools). The markers are placed on both lateral (A) and ventral (B) views. The 3rd marker allows us to estimate two vectors for each fish, which enables the calculation of body angles in both the lateral and ventral views.
Videos
Video 1
A high-speed video of stability control of a small fish school at near-still water velocity.
Three of the four fish that were holding stationary showed a positive body angle, and considerable motion of the fins is evident for stability control. One fish that moved from the top right corner increased its body angle and started to use more fin movements for stability control as the fish approached zero ground speed. Once the fish reached zero ground speed, the body angles and movements of fins were very similar to the other three fish that had been holding stationary.
Tables
Table 1
A summary of experimental studies that directly estimate the energetic saving of group movement in aerial and aquatic vertebrates that move through a fluid environment.
No energetic measurements have made for freely-moving bird flocks. Three studies measured the energetics of fish schools over a range of narrow speeds; two other studies measured the energetics of fish schooling at one speed. But no studies have quantified both the aerobic and anaerobic energetic cost of swimming as a group compared to solitary locomotion.
| Animal group | Species | Testing speeds | Group size | Measurements | Results | Reference |
|---|---|---|---|---|---|---|
| Bird | Pelecanus onocrotalus | Voluntary flights | <8 | Heart rate | Group movement saves energy | Weimerskirch et al., 2001 |
| Bird | Columba livia | Voluntary flights | 6 | Flap frequency & Accelerations | Group movement costs more energy | Usherwood et al., 2011 |
| Bird | Geronticus eremita | Voluntary flights | 14 | Wing beat phase, spatial distribution | V-formation birds use phasing strategy to cope with wakes | Portugal et al., 2014 |
| Ray-finned fish | 15 species | 1 speed, unknown speed | 6–12 individuals | Aerobic energy | Grouping reduces metabolic rate | Parker, 1973 |
| Ray-finned fish | Notropis heterodon | 1 speed ~1.2 BL s–1 | 3 individuals | Aerobic energy | Only schooling of 6 cm fish saves energy | Abrahams and Colgan, 1985* |
| Ray-finned fish | Anguilla anguilla L | 6 speeds 1–2.2 BL s–1 | 7 individuals | Aerobic energy | Schooling save energy at low speeds | Burgerhout et al., 2013* |
| Ray-finned fish | Lepomis macrochirus Oncorhynchus mykiss | 4 speeds, 1.5–3 BL s–1 | 1–8 individuals | Aerobic energy | Schooling saves energy | Currier et al., 2021* |
| Ray-finned fish | Salmo salar | 6 speeds 1–3 BL s–1 | 10 individuals | Aerobic energy | Schooling does not save energy | Hvas and Oppedal, 2019 |
| Ray-finned fish | Devario aequipinnatus | 14 speeds, 0.3–8 BL s–1 | 8 individuals | Aerobic and anaerobic energy | Schooling saves energy at high speed | Present study* |
-
Other uncited studies of fish schoolings use kinematic calculations and computer simulation to indirectly show that fish schooling conserve energy.
-
*
Studies used group and individual fish in the same size swim-tunnel respirometer.
Author response table 1
Papers cited by Reviewer #2, and a summary of their contributions and approach.
| Paper | Speed range (BL//s) | # fish in school | TBF/phase measured? | Non-aerobic cost measured? | Total energy expenditure measured? | Comparing fish school & solitary individual |
|---|---|---|---|---|---|---|
| This study | 0.25-8 | 8 | YES | YES | YES | YES |
Belyayev 1970 | 6.8 | 4 | YES | no | no | no |
| Weihs 1973 | Not stated | 4(7) | Theoretical model | no | no | no |
| Herskin and Steffensen 1998 | 0.6-1.36 | 5 | YES | no | no | no |
| Marras et al 2015 | 0.83-2.5 | 8 | YES | no | no | no |
| Burgerhout et al 2013 | 0.24-2.2 | 7 | YES | no | no | YES |
| Hemelrijk et al 2014 | 1.39 | 2-4 | Theoretical model | no | no | YES |
| Li et al 2021 | 1.2-1.6 | 2 | YES | no | no | YES |
| Wiwchar et al 2017 | 1.18-∼16 | 3-10 | no | no | no | no |
| Verma et al 2018 | Not stated | 2-3 | Theoretical model | no | no | no |
| Ashraf et al 2017 | 0.77-3.91 | 5-9 | YES | no | no | no |
| Parker, 1973 | Not stated | <= 12 | no | no | no | YES |
| Itazawa et al., 1978 | No applicable, resting chamber | 3 or 6 | no | no | no | YES |
| Abrahams and Colgan 1985 | Not stated | 6 | no | no | no | no |
| Davis & Olla, 1992 | Not stated | 4 | no | no | no | no |
Backman, 1992 | Not stated | 5-48 | no | no | no | no |
| Currier et al 2020 | 1.5-3.0 | 1-8 | YES | no | no | YES |
| Halsey et al., 2018 | 1.1-1.4 | 3 or 6 | YES | no | no | no |
| Johansen et al., 2010 | 0.5-2.5 | 4 | YES | no | no | no, compared solitary with leading and trailing individuals |
Additional files
-
MDAR checklist
- https://cdn.elifesciences.org/articles/90352/elife-90352-mdarchecklist1-v1.pdf
-
Supplementary file 1
We provide additional information on the materials and methods as well as supplementary tables.
These materials are a supplement to the main text and explain the aspects of the methods in more detail and document how we measured both the aerobic and non-aerobic contributions to total energy expenditure (TEE) during locomotion both by individuals and by the replicate schools of giant danio. Also included in this supplemental material are tables that summarize the various terms used for fish group locomotor behaviour and literature on fish schooling swim speeds in nature. We would like to emphasize that we focus on active, directional fish schooling behaviour and that such behaviour in the wild involves fish swimming at relatively high speeds, up to 20 body lengths second-1. This contrasts with many previous studies of fish schooling that have been conducted in still water. When fish swim at high speeds they engage in anaerobic glycolysis, and this can contribute significantly to the total cost of swimming. In this study, we measure both the aerobic and non-aerobic costs of active directional schooling behaviour in fishes, and by studying fish groups swimming at higher speeds we demonstrate directly the substantial energy savings resulting from group locomotion.
- https://cdn.elifesciences.org/articles/90352/elife-90352-supp1-v1.docx
Download links
A two-part list of links to download the article, or parts of the article, in various formats.
Downloads (link to download the article as PDF)
Open citations (links to open the citations from this article in various online reference manager services)
Cite this article (links to download the citations from this article in formats compatible with various reference manager tools)
Energy conservation by collective movement in schooling fish
eLife 12:RP90352.
https://doi.org/10.7554/eLife.90352.3


