Membrane-bound O-acyltransferase 7 (MBOAT7) shapes lysosomal lipid homeostasis and function to control alcohol-associated liver injury
- Department of Cancer Biology, Lerner Research Institute of the Cleveland Clinic, United States
- Center for Microbiome and Human Health, Lerner Research Institute, Cleveland Clinic, United States
- Northern Ohio Alcohol Center (NOAC), Lerner Research Institute, Cleveland Clinic, United States
- Department of Biochemistry, University of Wisconsin-Madison, United States
- Department of Inflammation and Immunity, Lerner Research Institute, Cleveland Clinic, United States
- Department of Cardiovascular and Metabolic Sciences, Lerner Research Institute of the Cleveland Clinic, United States
- Center for Gene Regulation in Health and Disease (GRHD), Cleveland State University, United States
- Department of Pharmacology & Nutritional Sciences, Saha Cardiovascular Research Center, University of Kentucky College of Medicine, United States
- Department of Family Medicine, Metro Health Medical Center, Case Western Reserve University, United States
- Lutheran Hospital, Cleveland Clinic, United States
- Department of Anatomical Pathology, Cleveland Clinic, United States
Figures
Figure 1
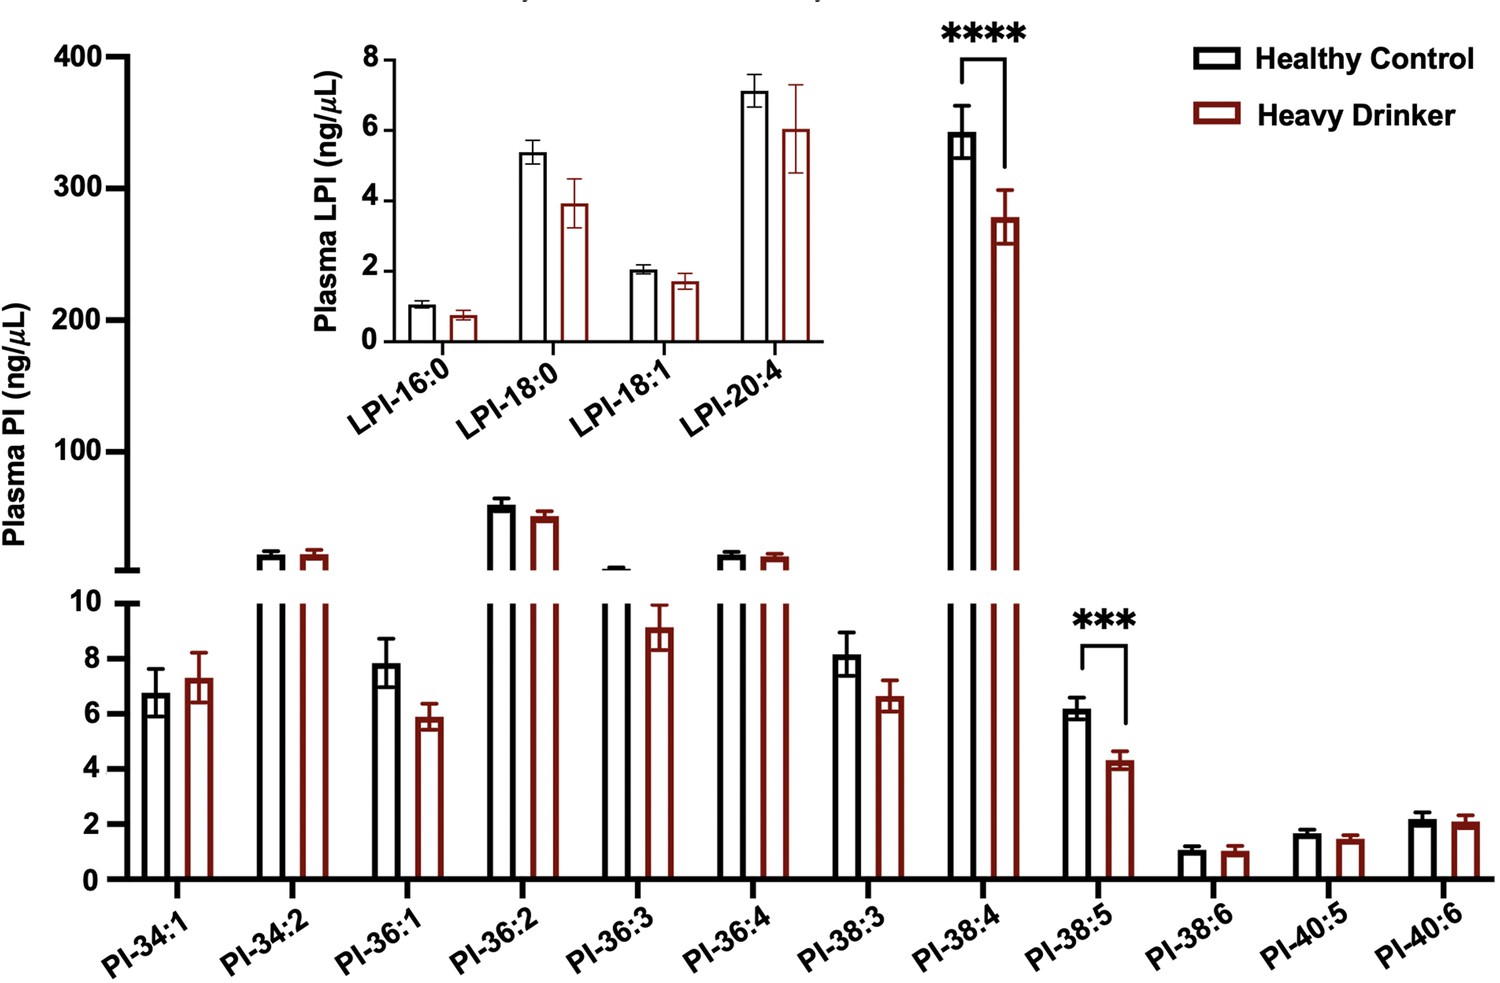
MBOAT7 products are selectively reduced in heavy drinkers.
Plasma lysophosphatidylinositol (LPI – inset graph) and phosphatidylinositol (PI) species from both male and female healthy controls and heavy drinkers were measured by liquid chromatography–tandem mass spectrometry (LC–MS/MS). n = 10–16; ***p < 0.001 and ****p < 0.0001 in the figure. Analysis of variance (ANOVA) with Tukey’s post hoc test.
-
Figure 1—source data 1
Demographic and clinical parameters for the entire cohort of healthy controls and heavy drinkers recruited for this study.
- https://cdn.elifesciences.org/articles/92243/elife-92243-fig1-data1-v1.docx
Figure 2 with 1 supplement

Hepatocyte-specific deletion of Mboat7 promotes ethanol-induced liver injury.
Female control (Mboat7fl/fl) or hepatocyte-specific Mboat7 knockout mice (Mboat7-HSKO) were fed with subjected the NIAAA (National Institute on Alcohol Abuse and Alcoholism) model of ethanol-induced liver injury. (A) Hepatic Mboat7 expression was measured via quantitative polymerase chain reaction (qPCR). (B) Western blot for hepatic microsomal MBOAT7 protein levels replicated in n = 3 mice. (C) Liver weight, (D) plasma alanine aminotransferase (ALT), (E) percent steatosis quantified by a blinded board-certified pathologist, (F) hepatic triglycerides, and (G) hepatic expression of inflammatory gene measured by qPCR. n = 5–7. Data represent the mean ± standard error of the mean (SEM) and groups not sharing a common letter superscript differ significantly (p ≤ 0.05).
-
Figure 2—source data 1
Original file for the western blot analysis in Figure 2B (anti-MBOAT7 and anti-β-actin).
- https://cdn.elifesciences.org/articles/92243/elife-92243-fig2-data1-v1.zip
-
Figure 2—source data 2
PDF containing Figure 2B and original scans of the relevant western blot analysis (anti-MBOAT7 and anti-β-actin) with highlighted bands and sample labels.
- https://cdn.elifesciences.org/articles/92243/elife-92243-fig2-data2-v1.zip
Figure 2—figure supplement 1

Myeloid-specific deletion of Mboat7 does not promote ethanol-induced liver injury.
Female control (Mboat7fl/fl) or myeloid-specific Mboat7 knockout mice (Mboat7-MSKO) were subjected to the NIAAA model of ethanol-induced liver injury. (A) Western blots from bone marrow derived macrophage (BMDM) or peritoneal macrophage (PM) collected from Mboat7fl/fl or Mboat7-MSKO mice. (B) Initial and final body weight measured in Mboat7fl/fl or Mboat7-MSKO mice. (C) Liver weight, (D, E) plasma alanine aminotransferase (ALT) and aspartate aminotransferase (AST), (F) hepatic triglycerides, and (G) hepatic expression of inflammatory gene measured by qPCR. Data represent the mean ± standard error of the mean (SEM) and groups not sharing a common letter superscript differ significantly (p ≤ 0.05).
-
Figure 2—figure supplement 1—source data 1
Original file for the western blot analysis in Figure 2A (anti-MBOAT7 and anti-β-actin).
- https://cdn.elifesciences.org/articles/92243/elife-92243-fig2-figsupp1-data1-v1.zip
-
Figure 2—figure supplement 1—source data 2
PDF containing Figure 2A and original scans of the relevant western blot analysis (anti-MBOAT7 and anti-β-actin) with highlighted bands and sample labels.
- https://cdn.elifesciences.org/articles/92243/elife-92243-fig2-figsupp1-data2-v1.zip
Figure 3 with 11 supplements
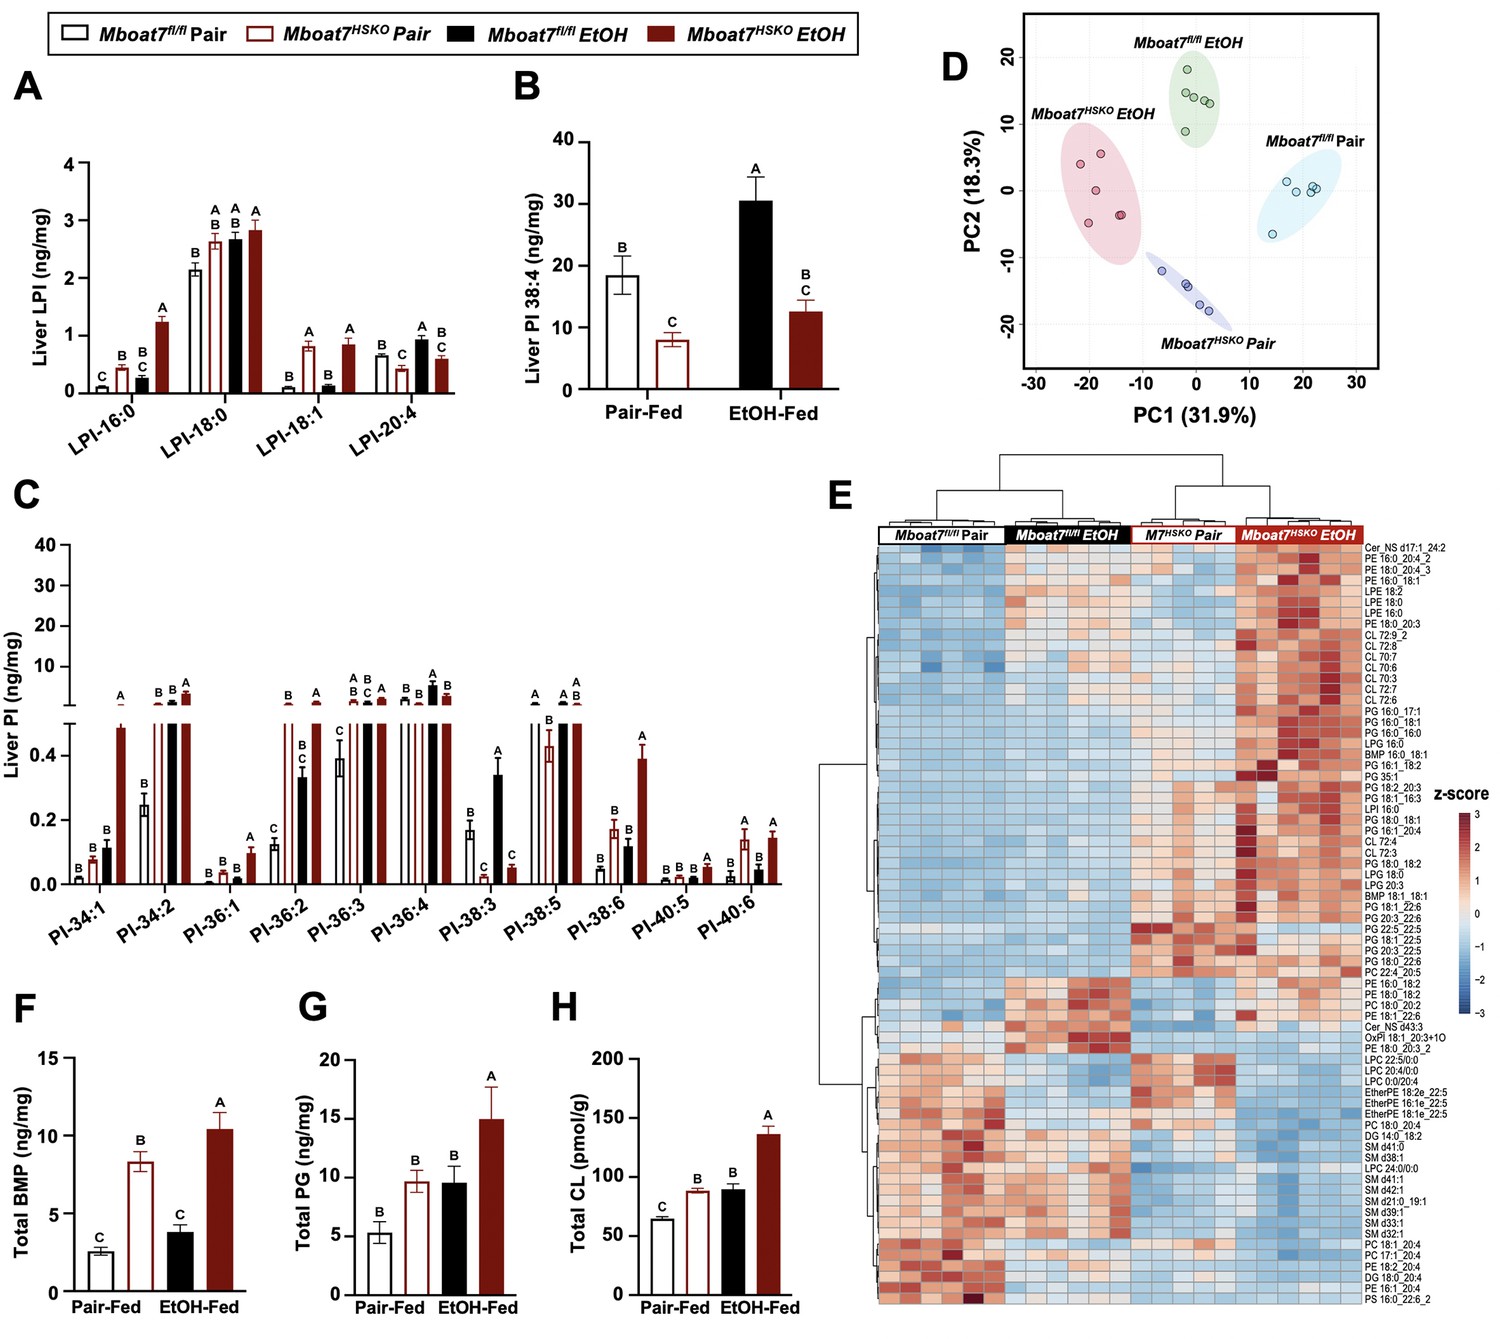
Ethanol alters the liver lipidome in a MBOAT7-dependent manner.
Mboat7fl/fl or Mboat7-HSKO mice were subjected to the NIAAA model of ethanol exposure. Liver lysophosphatidylinositol (LPI) (A) and phosphatidylinositol (PI) species, including the MBOAT7 product PI 38:4 (B) and others (C), were quantified via liquid chromatography–tandem mass spectrometry (LC–MS/MS) in n = 5–7. (D) Principal component analysis for untargeted lipidomics analysis. The first and second principal components are plotted on the x- and y-axis, respectively, and sample treatment group is indicated by color. (E) Heatmap showing global lipidomic alterations in mouse liver. Total levels of endosomal/lysosomal lipids were measured by targeted and untargeted lipidomic approach using LC–MS/MS. (F) Total bis(monoacylglycero)phosphate (BMP) levels. (G) Total phosphatidylglycerol (PG) and (H) total cardiolipin (CL) from the liver of Mboat7fl/fl or Mboat7-HSKO mice. Data represent the mean ± standard error of the mean (SEM) and groups not sharing a common letter superscript differ significantly (p ≤ 0.05).
Figure 3—figure supplement 1
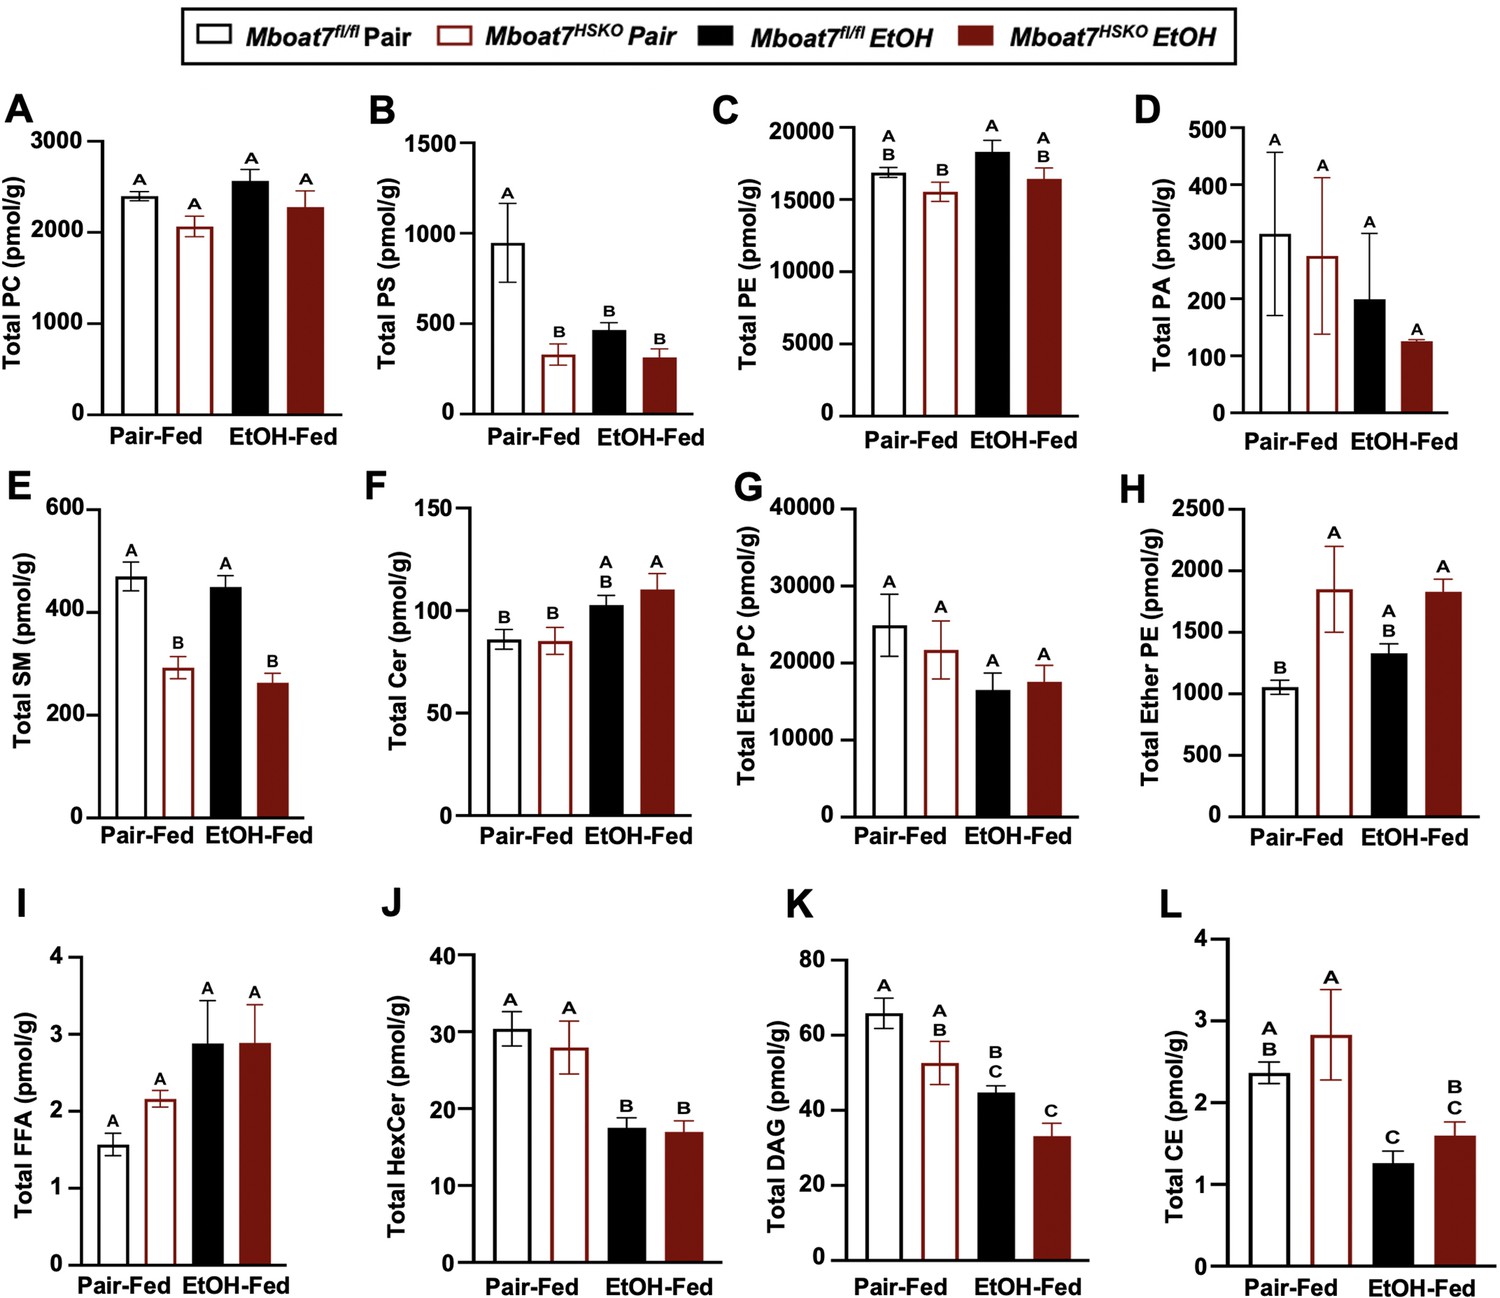
Alterations in total hepatic lipid levels in Mboat7-HSKO mice.
Age-matched female Mboat7fl/fl or Mboat7-HSKO mice were subjected to the NIAAA model of ethanol exposure, and untargeted lipidomics was performed to broadly examine major lipid classes in the liver. (A) Phosphatidylcholine (PC), (B) phosphatidylserine (PS), (C) phosphatidylethanolamine (PE), (D) phosphatidic acid (PA), (E) sphingomyelins (SM), (F) ceramides (Cer), (G) ether phosphatidylcholine, (H) ether phosphatidylethanolamine, (I) free fatty acids (FFA), (J) hexosylceramide (HexCer), (K) diacylglycerol (DAG), and (L) cholesteryl ester (CE) were quantified via liquid chromatography–mass spectrometry (n = 6/group). Data represent the mean ± standard error of the mean (SEM) and groups not sharing a common letter superscript differ significantly (p ≤ 0.05).
Figure 3—figure supplement 2

Hepatic phosphatidylcholine (PC) levels in Mboat7-HSKO mice.
Age-matched female Mboat7fl/fl or Mboat7-HSKO mice were subjected to the NIAAA model of ethanol exposure, and untargeted lipidomics were performed to broadly examine major lipid classes in the liver. The molecular species of PC were quantified via liquid chromatography–mass spectrometry (n = 6/group). Data represent the mean ± standard error of the mean (SEM) and groups not sharing a common letter superscript differ significantly (p ≤ 0.05).
Figure 3—figure supplement 3
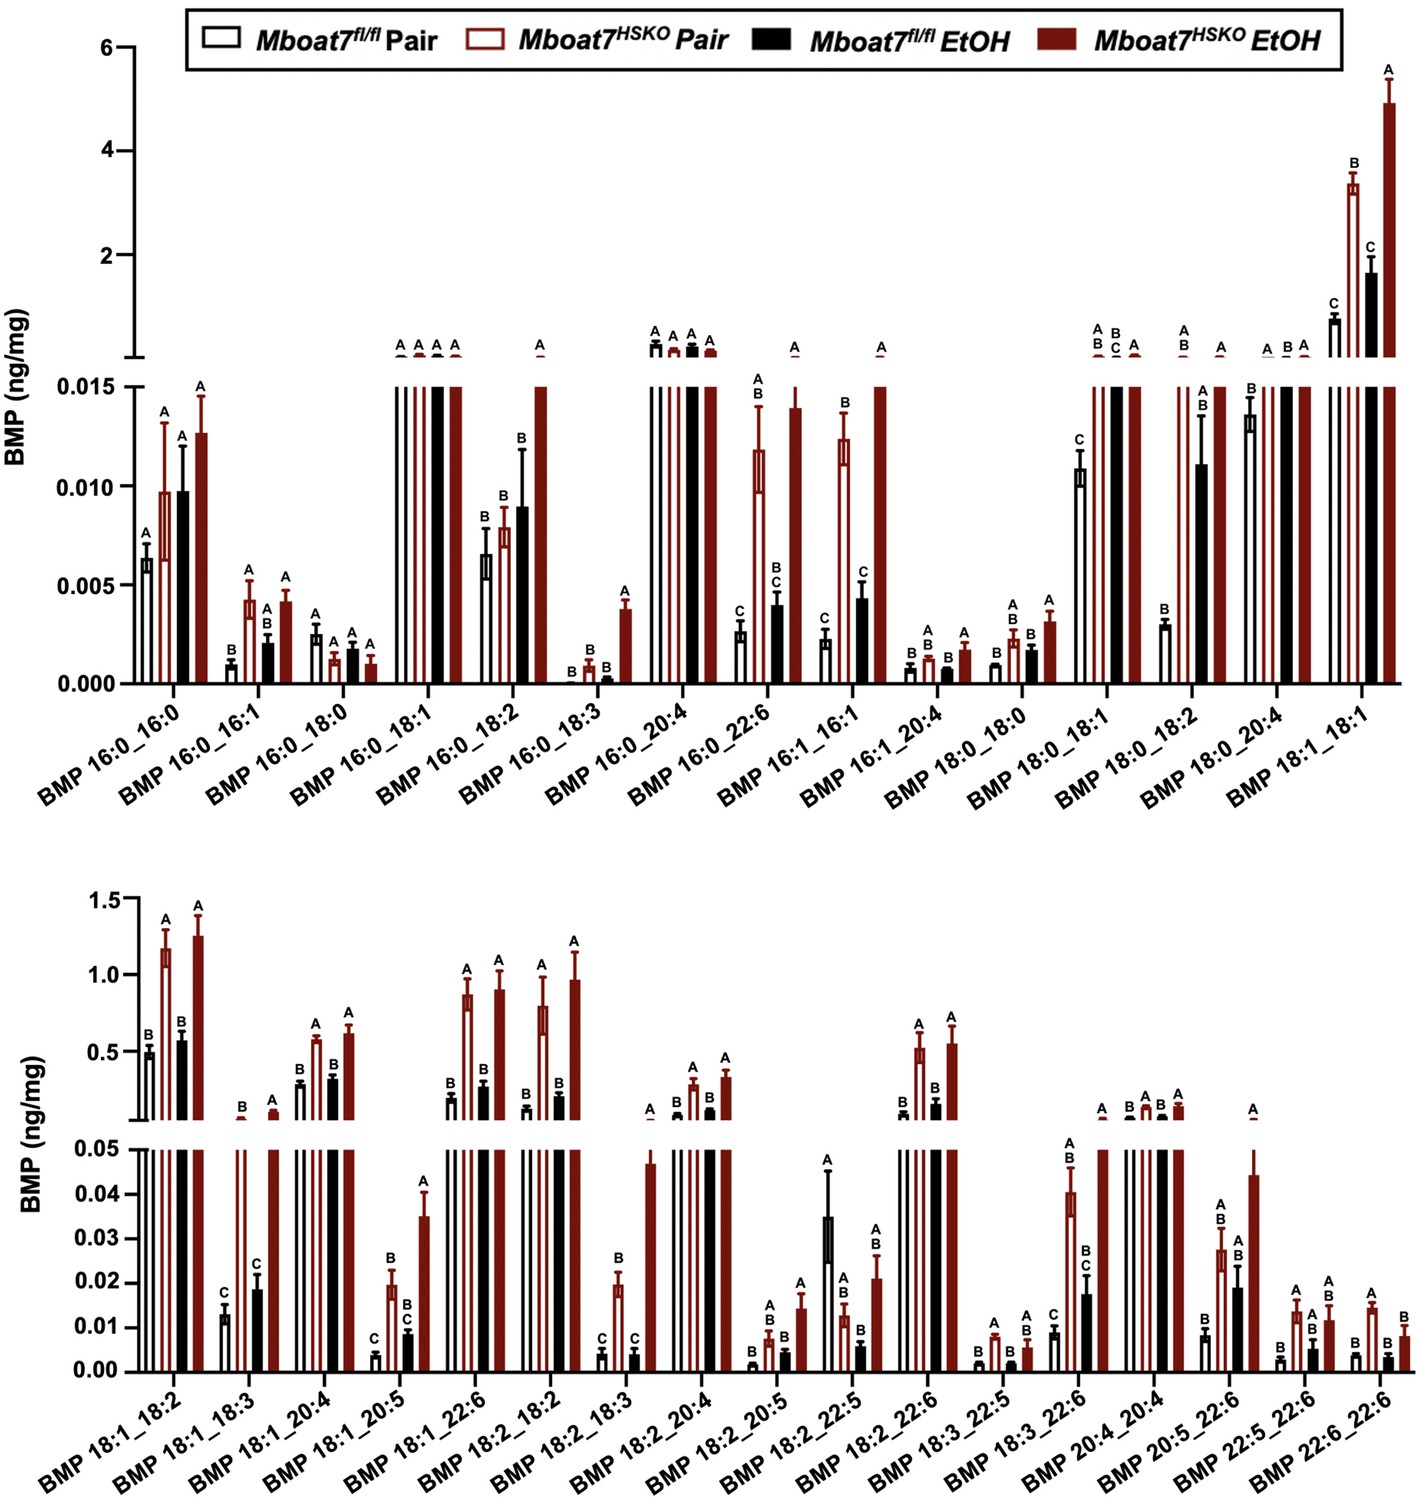
Hepatic bis(monoacylglycerol)phosphate (BMP) levels in Mboat7-HSKO mice.
Age-matched female Mboat7fl/fl or Mboat7-HSKO mice were subjected to the NIAAA model of ethanol exposure, and targeted lipidomics was performed in the liver. The molecular species of BMP were quantified via liquid chromatography–mass spectrometry (n = 6/group). Data represent the mean ± standard error of the mean (SEM) and groups not sharing a common letter superscript differ significantly (p ≤ 0.05).
Figure 3—figure supplement 4

Hepatic phosphatidylglycerol (PG) levels in Mboat7-HSKO mice.
Age-matched female Mboat7fl/fl or Mboat7-HSKO mice were subjected to the NIAAA model of ethanol exposure, and targeted lipidomics was performed in the liver. The molecular species of PG were quantified via liquid chromatography–mass spectrometry (n = 6/group). Data represent the mean ± standard error of the mean (SEM) and groups not sharing a common letter superscript differ significantly (p ≤ 0.05).
Figure 3—figure supplement 5
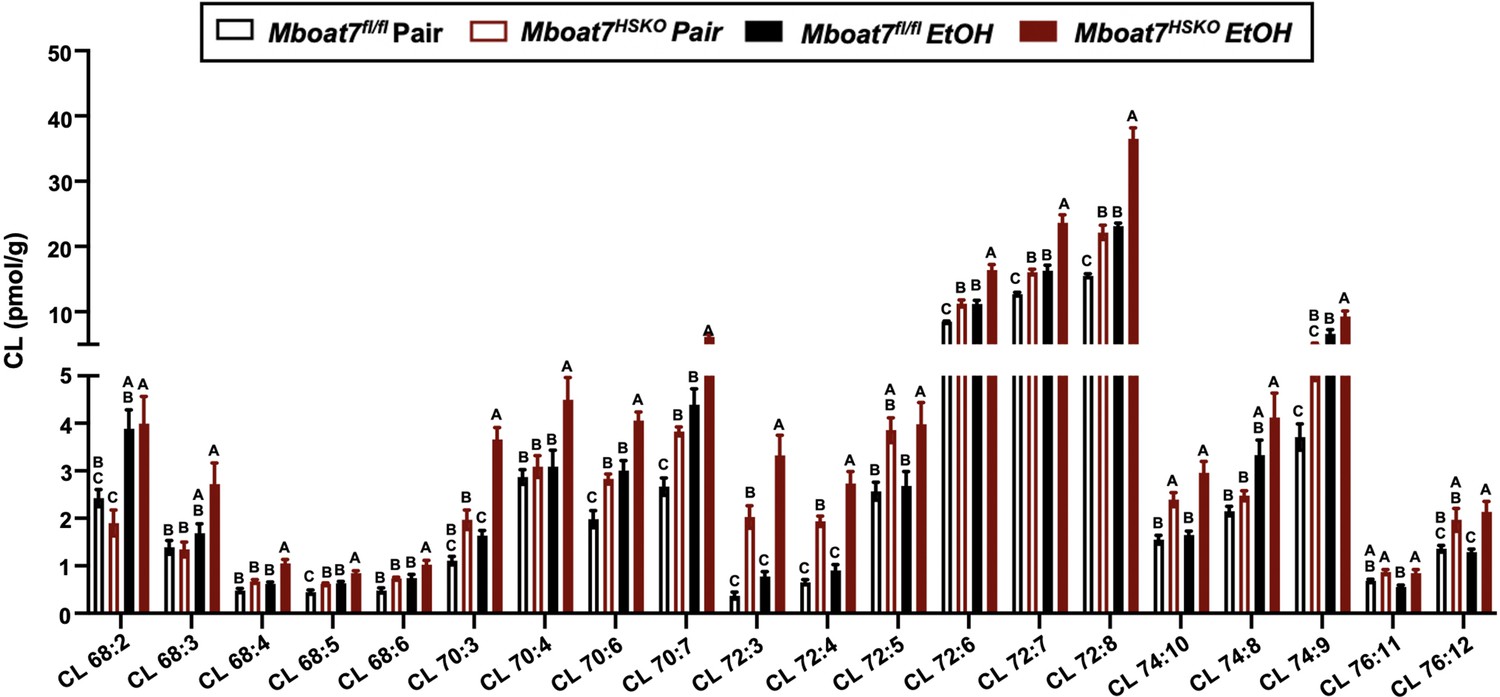
Hepatic cardiolipin (CL) levels in Mboat7-HSKO mice.
Age-matched female Mboat7fl/fl or Mboat7-HSKO mice were subjected to the NIAAA model of ethanol exposure, and untargeted lipidomics was performed in the liver. The molecular species of CL were quantified via liquid chromatography–mass spectrometry (n = 6/group). Data represent the mean ± standard error of the mean (SEM) and groups not sharing a common letter superscript differ significantly (p ≤ 0.05).
Figure 3—figure supplement 6

Hepatic phosphatidylserine (PS) levels in Mboat7-HSKO mice.
Age-matched female Mboat7fl/fl or Mboat7-HSKO mice were subjected to the NIAAA model of ethanol exposure, and untargeted lipidomics was performed in the liver. The molecular species of PS were quantified via liquid chromatography–mass spectrometry (n = 6/group). Data represent the mean ± standard error of the mean (SEM) and groups not sharing a common letter superscript differ significantly (p ≤ 0.05).
Figure 3—figure supplement 7
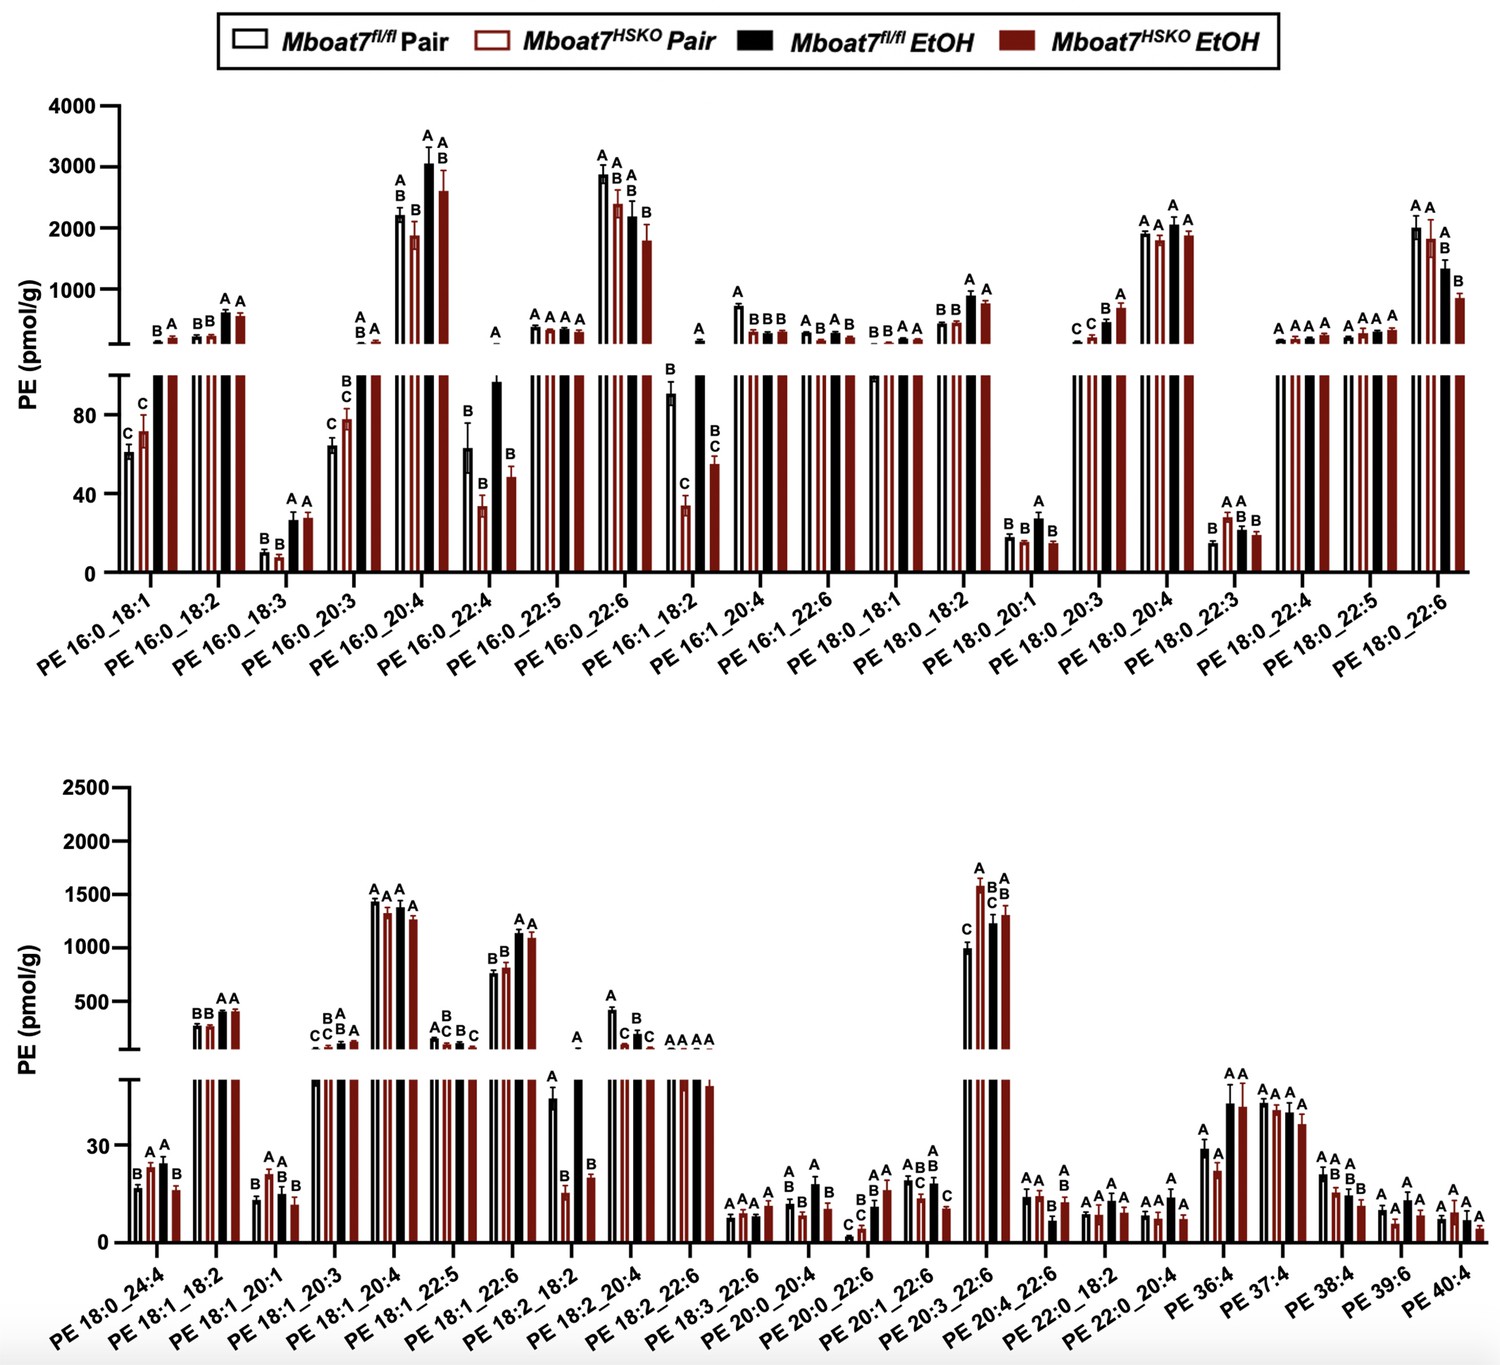
Hepatic phosphatidylethanolamine (PE) levels in Mboat7-HSKO mice.
Age-matched female Mboat7fl/fl or Mboat7-HSKO mice were subjected to the NIAAA model of ethanol exposure, and untargeted lipidomics was performed in the liver. The molecular species of PE were quantified via liquid chromatography–mass spectrometry (n = 6/group). Data represent the mean ± standard error of the mean (SEM) and groups not sharing a common letter superscript differ significantly (p ≤ 0.05).
Figure 3—figure supplement 8

Hepatic phosphatidic acid (PA) levels in Mboat7-HSKO mice.
Age-matched female Mboat7fl/fl or Mboat7-HSKO mice were subjected to the NIAAA model of ethanol exposure, and untargeted lipidomics was performed in the liver. The molecular species of PA were quantified via liquid chromatography–mass spectrometry (n = 6/group). Data represent the mean ± standard error of the mean (SEM) and groups not sharing a common letter superscript differ significantly (p ≤ 0.05).
Figure 3—figure supplement 9
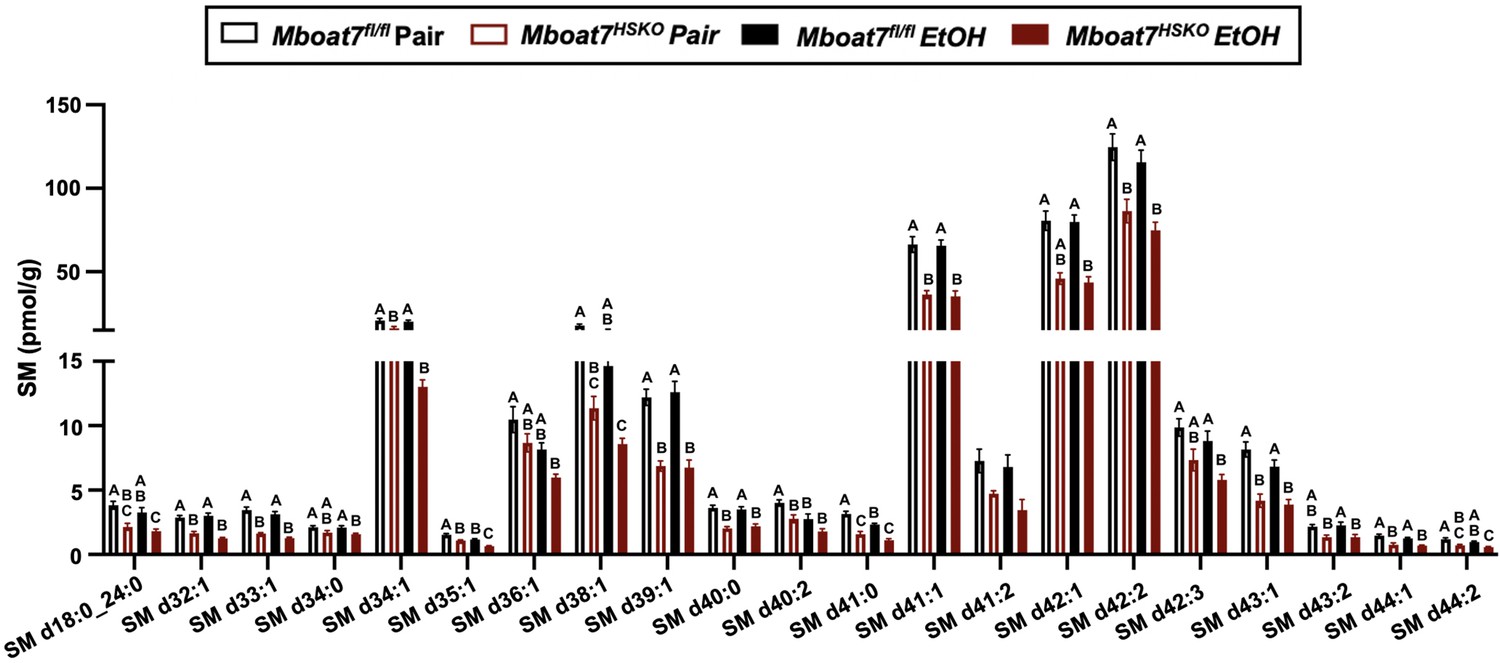
Hepatic sphingomyelin (SM) levels in Mboat7-HSKO mice.
Age-matched female Mboat7fl/fl or Mboat7-HSKO mice were subjected to the NIAAA model of ethanol exposure, and untargeted lipidomics was performed in the liver. The molecular species of SM were quantified via liquid chromatography–mass spectrometry (n = 6/group). Data represent the mean ± standard error of the mean (SEM) and groups not sharing a common letter superscript differ significantly (p ≤ 0.05).
Figure 3—figure supplement 10

Hepatic ceramide (Cer) levels in Mboat7-HSKO mice.
Age-matched female Mboat7fl/fl or Mboat-HSKO mice were subjected to the NIAAA model of ethanol exposure, and untargeted lipidomics was performed in the liver. The molecular species of ceramides were quantified via liquid chromatography–mass spectrometry (n = 6/group). Data represent the mean ± standard error of the mean (SEM) and groups not sharing a common letter superscript differ significantly (p ≤ 0.05).
Figure 3—figure supplement 11
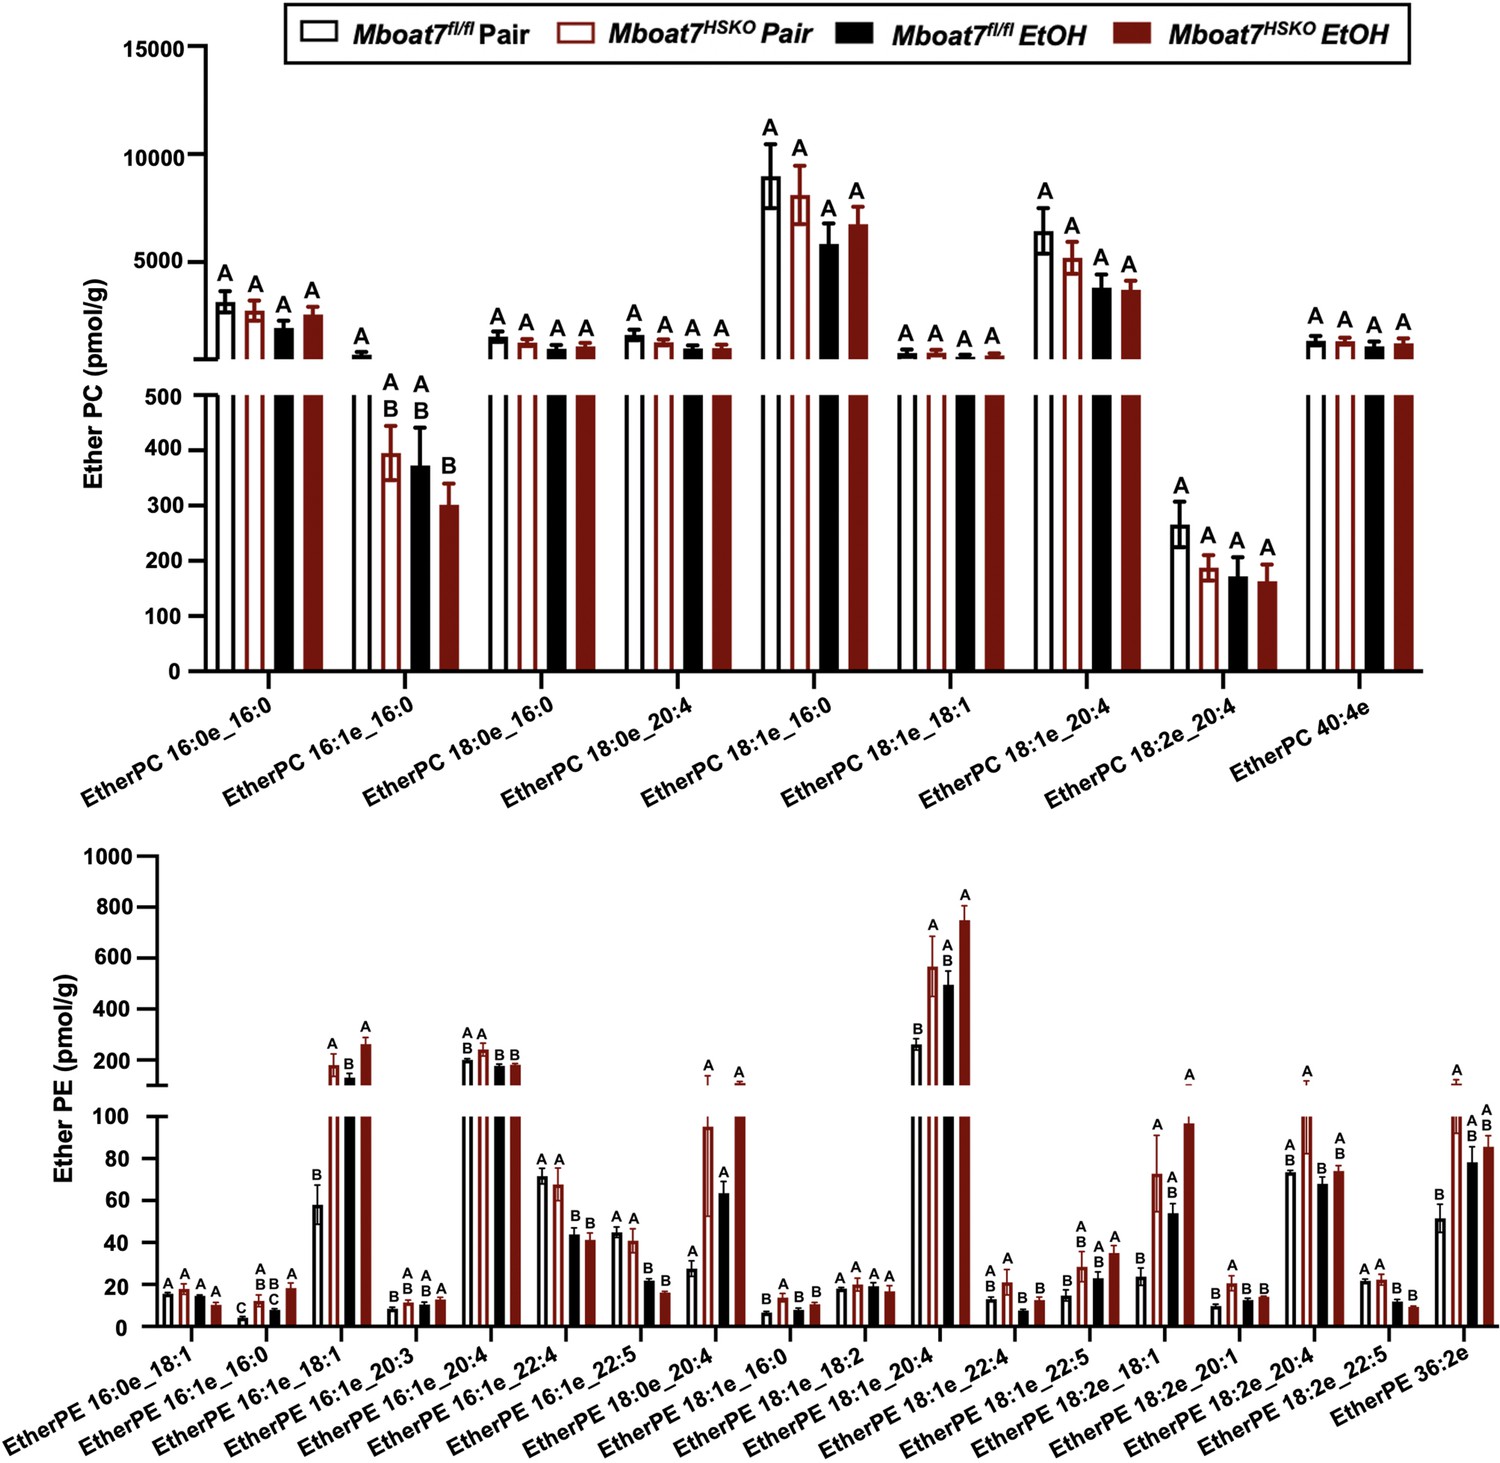
Hepatic ether-linked lipids levels in Mboat7-HSKO mice.
Age-matched female Mboat7fl/fl or Mboat7-HSKO mice were subjected to the NIAAA model of ethanol exposure, and untargeted lipidomics was performed in the liver. The molecular species of ether-linked lipids were quantified via liquid chromatography–mass spectrometry (n = 6/group). Data represent the mean ± standard error of the mean (SEM) and groups not sharing a common letter superscript differ significantly (p ≤ 0.05).
Figure 4 with 2 supplements
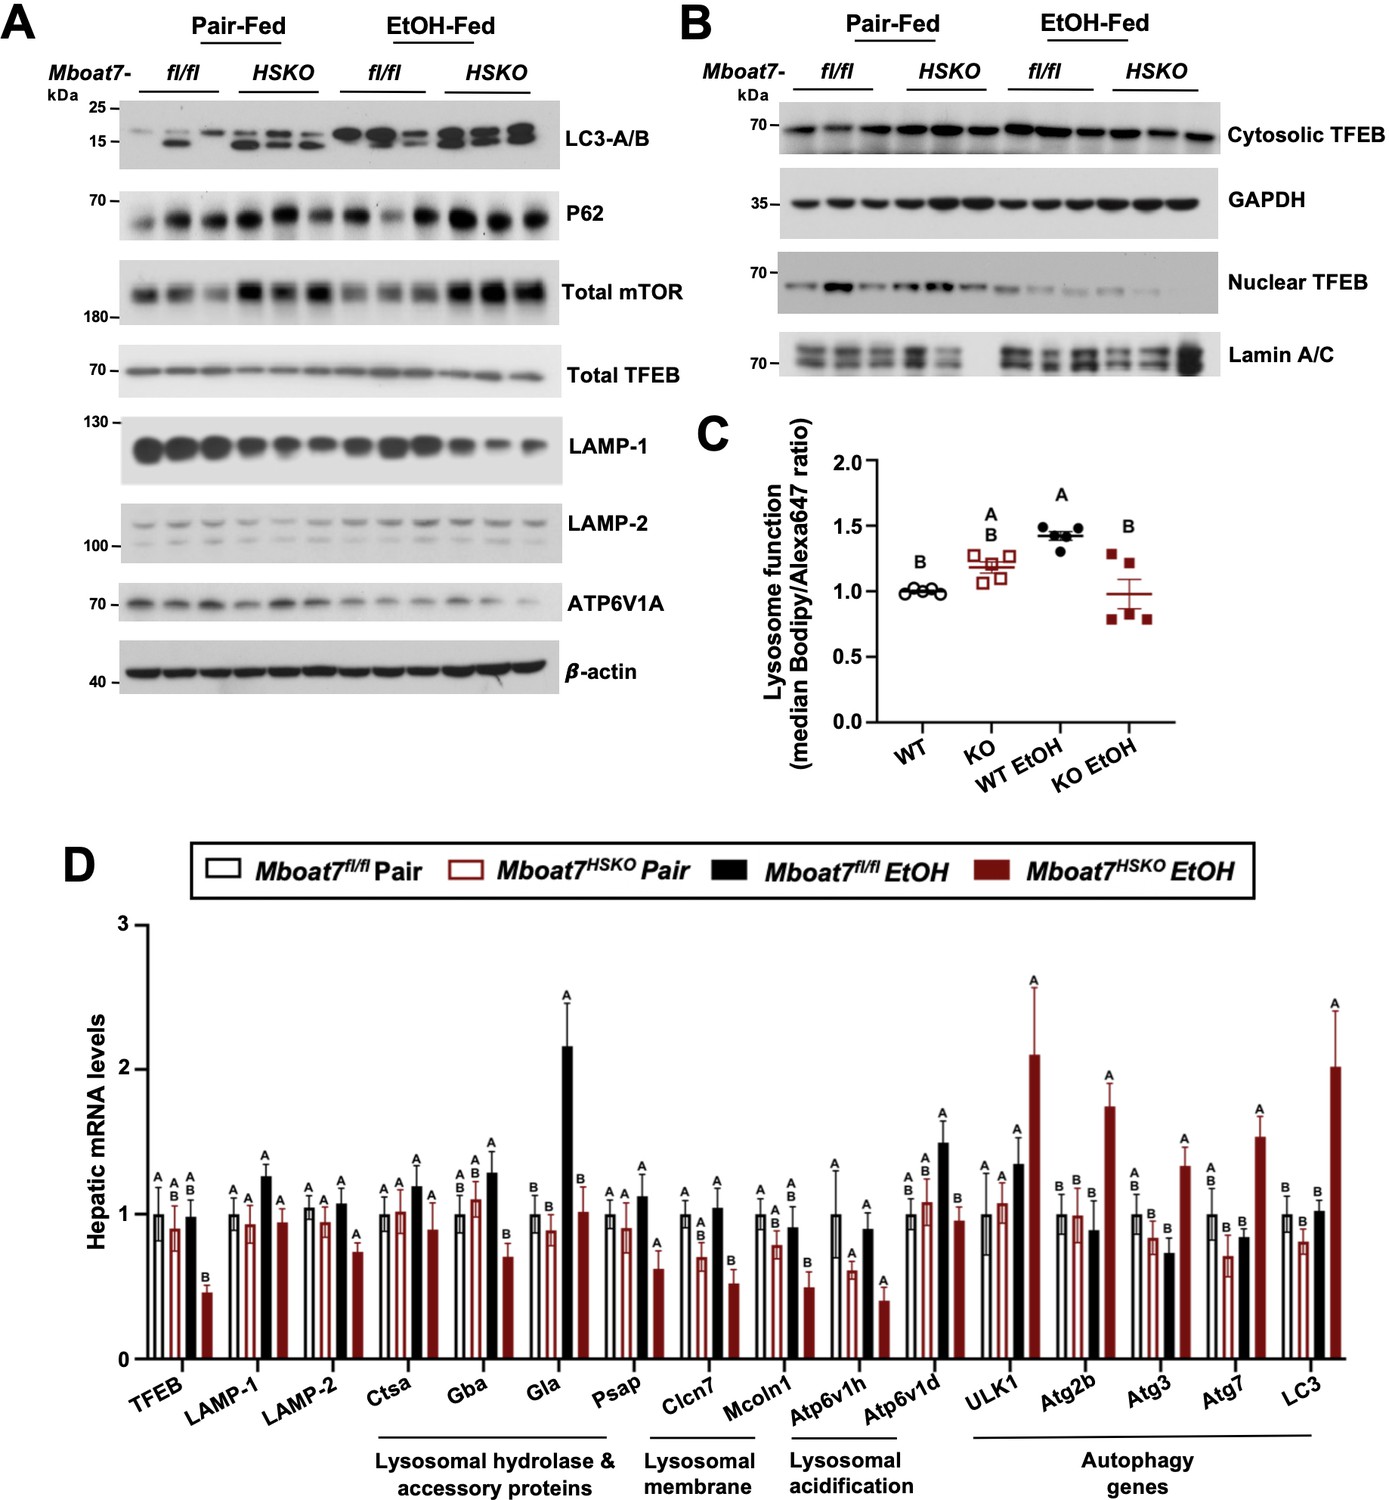
Mboat7-HSKO mice have dysregulated lysosome function in response to ethanol.
Age-matched female Mboat7fl/fl or Mboat7-HSKO mice were subjected to the NIAAA model of ethanol exposure. (A) Total liver lysates were subjected to western blot analysis of major autophagy marker genes LC3A/B (P62), mammalian target of rapamycin (mTOR) and lysosome biogenesis genes (TFEB, LAMP-1, LAMP-2, and ATP6V1A). (B) Nuclear fractions from mouse livers of Mboat7fl/fl and Mboat7-HSKO were subjected to western blot analysis of TFEB. (C) Lysosome protein degradation activity in wild-type and MBOAT7∆-Huh7 hepatoma cells treated with or without 100 mM ethanol for 48 hr was assessed by incubating cells with 10 µg/ml of lysosome indicator for 2 hr and examined by flow cytometry. n = 5 from two experiments by normalizing to wild-type group in each experiment; mean ± standard deviation (SD) (D) Expression levels of the genes encoding functions in lysosomal hydrolase and accessory, lysosomal m involved in lysosomal biogenesis in the liver of Mboat7fl/fl and Mboat7-HSKO mice upon ethanol feeding. mRNA expression levels were determined by qPCR (n = 6/group). Groups not sharing a common letter superscript differ significantly (p ≤ 0.05).
-
Figure 4—source data 1
Original file for the western blot analysis in Figure 4A (anti-LC3-A/B).
- https://cdn.elifesciences.org/articles/92243/elife-92243-fig4-data1-v1.zip
-
Figure 4—source data 2
Original file for the western blot analysis in Figure 4A (anti-p62).
- https://cdn.elifesciences.org/articles/92243/elife-92243-fig4-data2-v1.zip
-
Figure 4—source data 3
Original file for the western blot analysis in Figure 4A (anti-Total mTOR and anti-LAMP-1).
- https://cdn.elifesciences.org/articles/92243/elife-92243-fig4-data3-v1.zip
-
Figure 4—source data 4
Original file for the western blot analysis in Figure 4A (anti-TFEB).
- https://cdn.elifesciences.org/articles/92243/elife-92243-fig4-data4-v1.zip
-
Figure 4—source data 5
Original file for the western blot analysis in Figure 4A (anti-LAMP-2 and anti-ATP6V1A).
- https://cdn.elifesciences.org/articles/92243/elife-92243-fig4-data5-v1.zip
-
Figure 4—source data 6
Original file for the western blot analysis in Figure 4A (anti-β-actin).
- https://cdn.elifesciences.org/articles/92243/elife-92243-fig4-data6-v1.zip
-
Figure 4—source data 7
PDF containing Figure 4A and original scans of the relevant western blot analysis (anti-MBOAT7, anti-p62, anti-total mTOR, anti-total TFEB, anti-LAMP-1, anti-LAMP-2, anti-ATP6V1A, and anti-β-actin) with highlighted bands and sample labels.
- https://cdn.elifesciences.org/articles/92243/elife-92243-fig4-data7-v1.zip
-
Figure 4—source data 8
Original file for the western blot analysis in Figure 4B (anti-cytosolic-TFEB).
- https://cdn.elifesciences.org/articles/92243/elife-92243-fig4-data8-v1.zip
-
Figure 4—source data 9
Original file for the western blot analysis in Figure 4B (anti-nuclear TFEB).
- https://cdn.elifesciences.org/articles/92243/elife-92243-fig4-data9-v1.zip
-
Figure 4—source data 10
Original file for the western blot analysis in Figure 4B (anti-LAMIN A/C).
- https://cdn.elifesciences.org/articles/92243/elife-92243-fig4-data10-v1.zip
-
Figure 4—source data 11
Original file for the western blot analysis in Figure 4B (anti-GAPDH).
- https://cdn.elifesciences.org/articles/92243/elife-92243-fig4-data11-v1.zip
-
Figure 4—source data 12
PDF containing Figure 4B and original scans of the relevant western blot analysis (anti-cytosolic TFEB, anti-nuclear TFEB, anti-LAMIN A/C, and anti-GAPDH) with highlighted bands and sample labels.
- https://cdn.elifesciences.org/articles/92243/elife-92243-fig4-data12-v1.zip
Figure 4—figure supplement 1
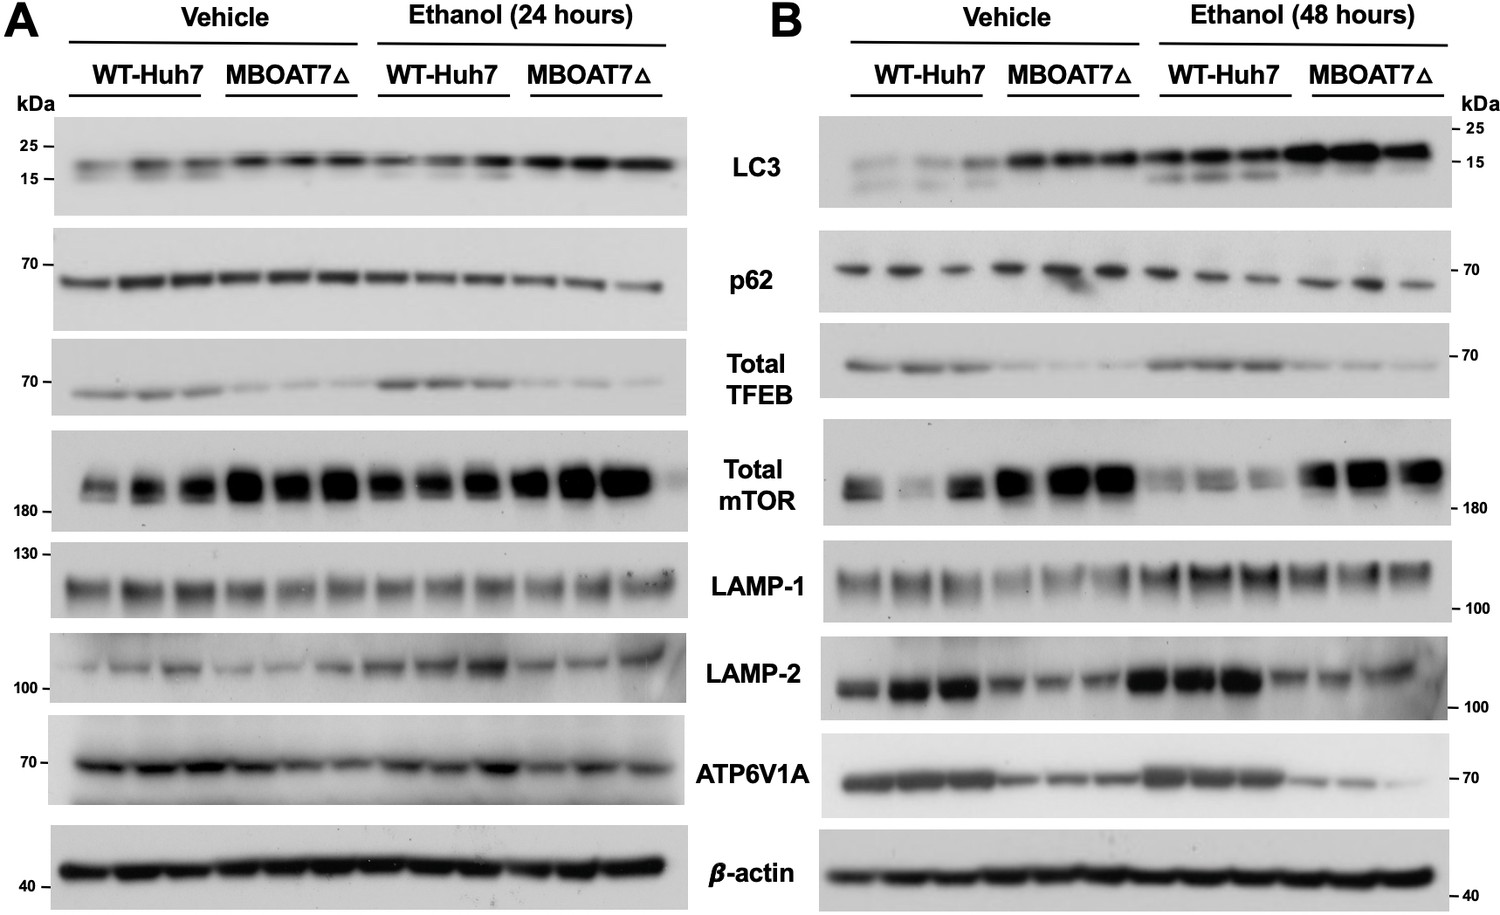
Genetic deletion of MBOAT7 in human Huh7 cells is associated with diminished lysosome biogenesis and ethanol-induced autophagy dysregulation.
WT and MBOAT7Δ Huh7 hepatoma cells were treated with and without ethanol treatment (100 mM) for 24 (A) and 48 hr (B). Total lysate were subjected to western blot analysis of LC3A/B, P62, Total mTOR, Total TFEB, LAMP-1, LAMP-2, and ATP6V1A.
-
Figure 4—figure supplement 1—source data 1
Original file for the western blot analysis in Figure 4A, B (anti-LC3-A/B).
- https://cdn.elifesciences.org/articles/92243/elife-92243-fig4-figsupp1-data1-v1.zip
-
Figure 4—figure supplement 1—source data 2
Original file for the western blot analysis in Figure 4A and B (anti-p62).
- https://cdn.elifesciences.org/articles/92243/elife-92243-fig4-figsupp1-data2-v1.zip
-
Figure 4—figure supplement 1—source data 3
Original file for the western blot analysis in Figure 4A and B (anti-Total mTOR and anti-LAMP-1).
- https://cdn.elifesciences.org/articles/92243/elife-92243-fig4-figsupp1-data3-v1.zip
-
Figure 4—figure supplement 1—source data 4
Original file for the western blot analysis in Figure 4A and B (anti-TFEB).
- https://cdn.elifesciences.org/articles/92243/elife-92243-fig4-figsupp1-data4-v1.zip
-
Figure 4—figure supplement 1—source data 5
Original file for the western blot analysis in Figure 4A and B (anti-LAMP-2 and anti-ATP6V1A).
- https://cdn.elifesciences.org/articles/92243/elife-92243-fig4-figsupp1-data5-v1.zip
-
Figure 4—figure supplement 1—source data 6
Original file for the western blot analysis in Figure 4A and B (anti-β-actin).
- https://cdn.elifesciences.org/articles/92243/elife-92243-fig4-figsupp1-data6-v1.zip
-
Figure 4—figure supplement 1—source data 7
PDF containing Figure 4A and B and original scans of the relevant western blot analysis (anti-MBOAT7, anti-p62, anti-total mTOR, anti-total TFEB, anti-LAMP-1, anti-LAMP-2, anti-ATP6V1A, and anti-β-actin) with highlighted bands and sample labels.
- https://cdn.elifesciences.org/articles/92243/elife-92243-fig4-figsupp1-data7-v1.zip
Figure 4—figure supplement 2
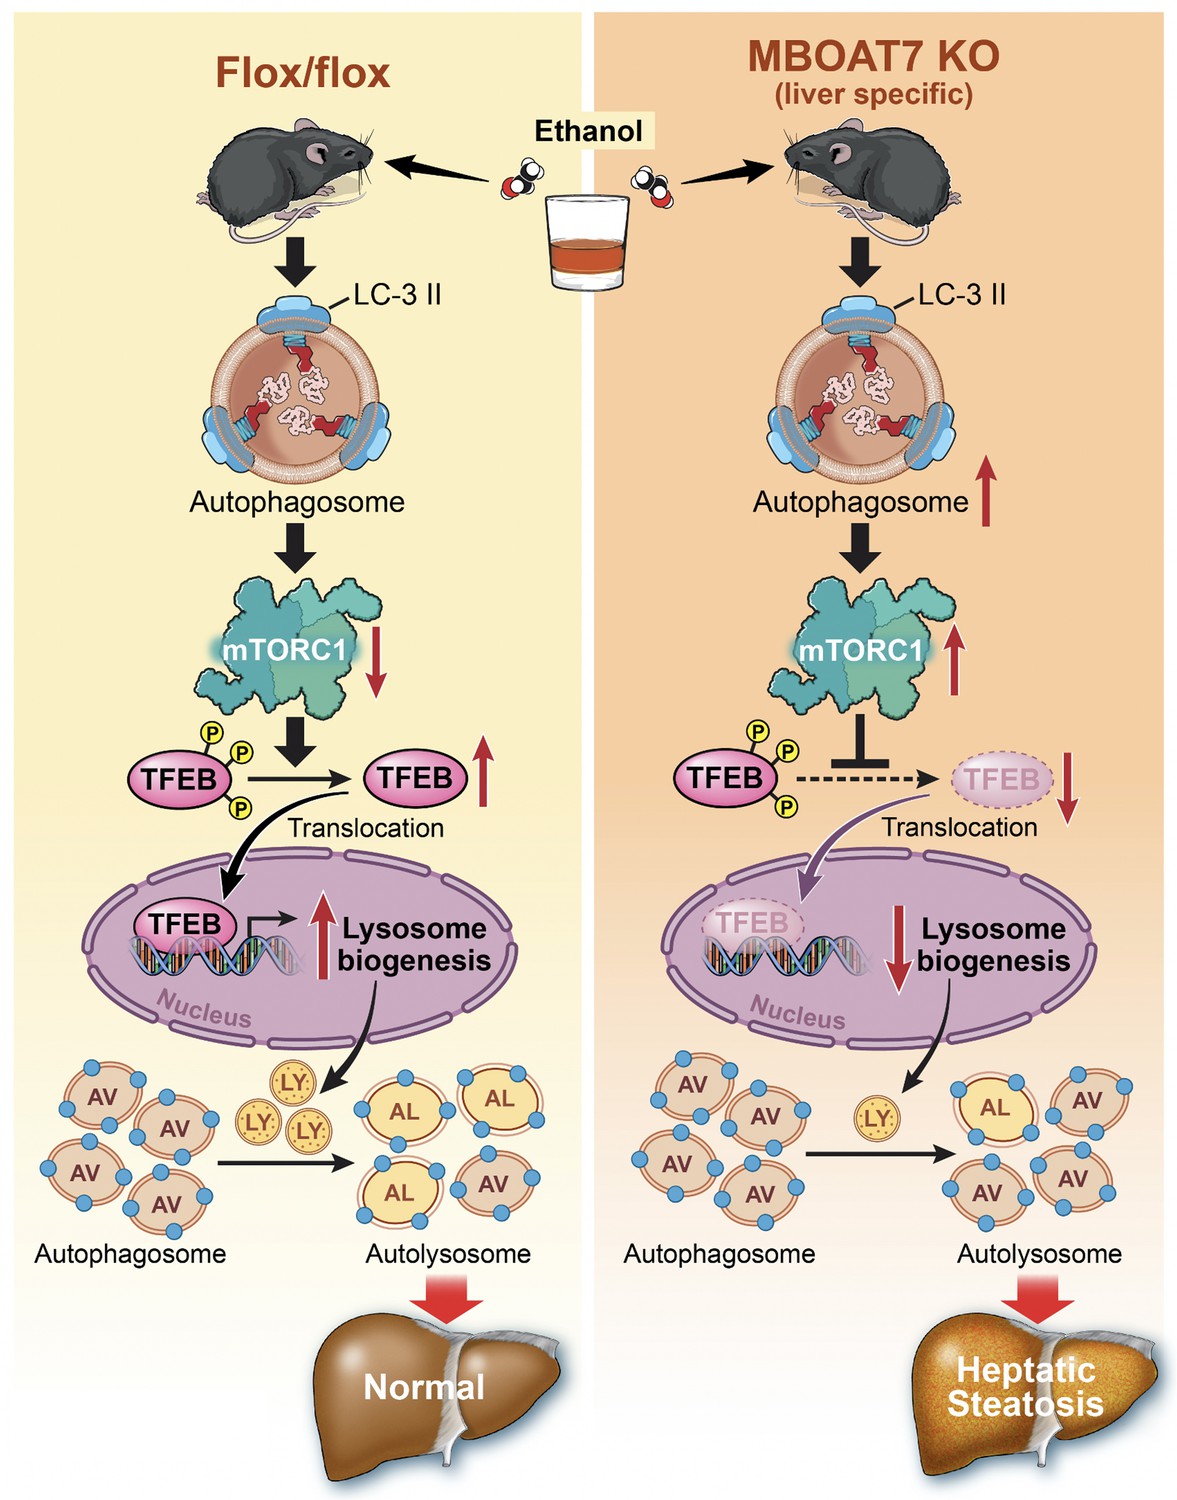
Working model.
MBOAT7 loss of function in either mouse or human hepatocytes is associated with decreased transcription factor EB (TFEB)-driven lysosomal biogenesis and defective autophagy secondary to lysosomal dysfunction.
Tables
Key resources table
| Reagent type (species) or resource | Designation | Source or reference | Identifiers | Additional information |
|---|---|---|---|---|
| Genetic reagent (M. musculus) | Mboat7tm1a(KOMP)Wtsi/Mboat7tm1a(KOMP)Wtsi | PMID:23472195 | RRID: MGI:5510874 | |
| Genetic reagent (M. musculus) | B6N.Cg-Speer6-ps1Tg(Alb-cre)21Mgn/J | Jackson Laboratory | Stock#: 018961 RRID: IMSR_JAX:018961 | |
| Genetic reagent (M. musculus) | B6.129P2-Lyz2tm1(cre)Ifo/J | Jackson Laboratory | Stock#: 004781 RRID: IMSR_JAX:004781 | |
| Cell line (Homo sapiens) | HUH7 (well differentiated human hepatocellular carcinoma) | Japanese Collection of Research Biosources Cell Bank | JCRB0403 | |
| Antibody | Anti-MBOAT7 (Rat monoclonal) | PMID:23097495 | RRID: AB_2813851 | WB (1:1000) |
| Antibody | Anti-rat IgG HRP secondary antibody | Cell Signaling | Cat#: 7077 RRID: AB_10694715 | WB (1:5000) |
| Antibody | LC3A/B (D3U4C) XP (Rabbit monoclonal) | Cell Signaling | Cat#: 12741 RRID: AB_2617131 | WB (1:1000) |
| Antibody | SQSTM1/p62 (Rabbit polyclonal) | Cell Signaling | Cat#: 5114 RRID: AB_10624872 | WB (1:1000) |
| Antibody | mTOR (7C10) (Rabbit monoclonal) | Cell Signaling | Cat#: 2983 RRID: AB_2105622 | WB (1:1000) |
| Antibody | TFEB (D2O7D) (Rabbit monoclonal) | Cell Signaling | Cat#: 37785 | WB (1:1000) |
| Antibody | TFEB (Rabbit polyclonal) | Thermo Fisher Scientific | Cat#: A303-673A RRID: AB_11204751 | WB (1:1000) |
| Antibody | LAMP1 (D2D11) XP Rabbit monoclonal | Cell Signaling | Cat#: 9091 RRID: AB_2687579 | WB (1:1000) |
| Antibody | LAMP-1 (Rat monoclonal) | Developmental Studies Hybridoma Bank (DSHB) | Cat#: ID4B RRID: AB_528127 | WB (1:1000) |
| Antibody | LAMP-2 (Rat monoclonal) | Developmental Studies Hybridoma Bank (DSHB) | Cat#: ABL-93 RRID: AB_2134767 | WB (1:1000) |
| Antibody | LAMP2 (D5C2P) (Rabbit monoclonal) | Cell Signaling | Cat#: 49067 RRID: AB_2799349 | WB (1:1000) |
| Antibody | ATP6V1A (Rabbit polyclonal) | GeneTex | Cat#: GTX110815 RRID: AB_1949704 | WB (1:1000) |
| antibody | Anti-GAPDH-HRP (Rabbit monoclonal) | Cell Signaling | Cat#: 8884 RRID: AB_11129865 | WB (1:5000) |
| Antibody | Lamin A/C (4C11) (Mouse monoclonal) | Cell Signaling | Cat#: 4777 | WB (1:1000) |
| Antibody | HRP-conjugated Beta Actin (Mouse monoclonal) | Proteintech | Cat#: HRP-60008 RRID: AB_2289225 | WB (1:10,000) |
| Commercial assay or kit | Alanine Aminotransaminase (ALT) kit | Sekisui Diagnostics | 318-30 | |
| Commercial assay or kit | Aspartate Aminotransferase (AST) kit | Sekisui Diagnostics | 319-30 | |
| Commercial assay or kit | Liver Triglyceride | Wako | 994-02891 | |
| Commercial assay or kit | Microsome Isolation | Abcam | ab206995 | |
| Commercial assay or kit | NE-PER Nuclear and Cytoplasmic Extraction Reagents | Thermo Fisher Scientific | 78833 | |
| Commercial assay or kit | Supersignal West Pico Plus substrate | Thermo Fisher Scientific | 34577 | |
| Chemical compound, drug | Ammonium formate | Honeywell | Cat# 55674 | |
| Chemical compound, drug | Methanol | Honeywell | Cat# LC230-4 | |
| Chemical compound, drug | Water | Honeywell | Cat# LC365-4 | |
| Chemical compound, drug | Acetonitrile | Honeywell | Cat# LC015-4 | |
| Chemical compound, drug | Isopropanol | Fisher Scientific | Cat# A461-4 | |
| Chemical compound, drug | Ethyl acetate | Sigma-Aldrich | Cat# 650528 | |
| Chemical compound, drug | Formic acid | Thermo Scientific | Cat# 28905 | |
| Chemical compound, drug | FA 18:0d35 | Cayman Chemical | Cat# 9003318 | |
| Chemical compound, drug | ACar 18:1d3 | Cayman Chemical | Cat# 26578 | |
| Chemical compound, drug | BMP 14:0_14:0 | Avanti | Cat# 857131 | |
| Chemical compound, drug | PG 15:0_18:1d7 | Avanti | Cat# 91640 | |
| Chemical compound, drug | Cer d18:1d7_15:0 | Avanti | Cat# 860681P | |
| Chemical compound, drug | PA 15:0_18:1d7 | Avanti | Cat# 791642 | |
| Chemical compound, drug | SPLASH LipidoMix II | Avanti | Cat# 330709 | |
| Chemical compound, drug | BMP 18:1_18:1 | Avanti | Cat# 857133P | |
| Chemical compound, drug | PG 18:1_18:1 | Avanti | Cat# 840475P |
Additional files
Download links
A two-part list of links to download the article, or parts of the article, in various formats.
Downloads (link to download the article as PDF)
Open citations (links to open the citations from this article in various online reference manager services)
Cite this article (links to download the citations from this article in formats compatible with various reference manager tools)
Membrane-bound O-acyltransferase 7 (MBOAT7) shapes lysosomal lipid homeostasis and function to control alcohol-associated liver injury
eLife 12:RP92243.
https://doi.org/10.7554/eLife.92243.3


