A multi-hierarchical approach reveals d-serine as a hidden substrate of sodium-coupled monocarboxylate transporters
- Center for SI Medical Research, The Jikei University School of Medicine, Japan
- Department of Laboratory Medicine, The Jikei University School of Medicine, Japan
- Department of Collaborative Research for Biomolecular Dynamics, Nara Medical University, Japan
- Department of Pharmacology, Keio University School of Medicine, Japan
- Graduate School of Pharmaceutical Sciences, Kyushu University, Japan
- KAGAMI Project, National Institutes of Biomedical Innovation, Health and Nutrition, Japan
- Reverse Translational Research Project, Center for Rare Disease Research, National Institutes of Biomedical Innovation, Health and Nutrition, Japan
- KAGAMI Inc, Japan
Figures
Figure 1 with 2 supplements
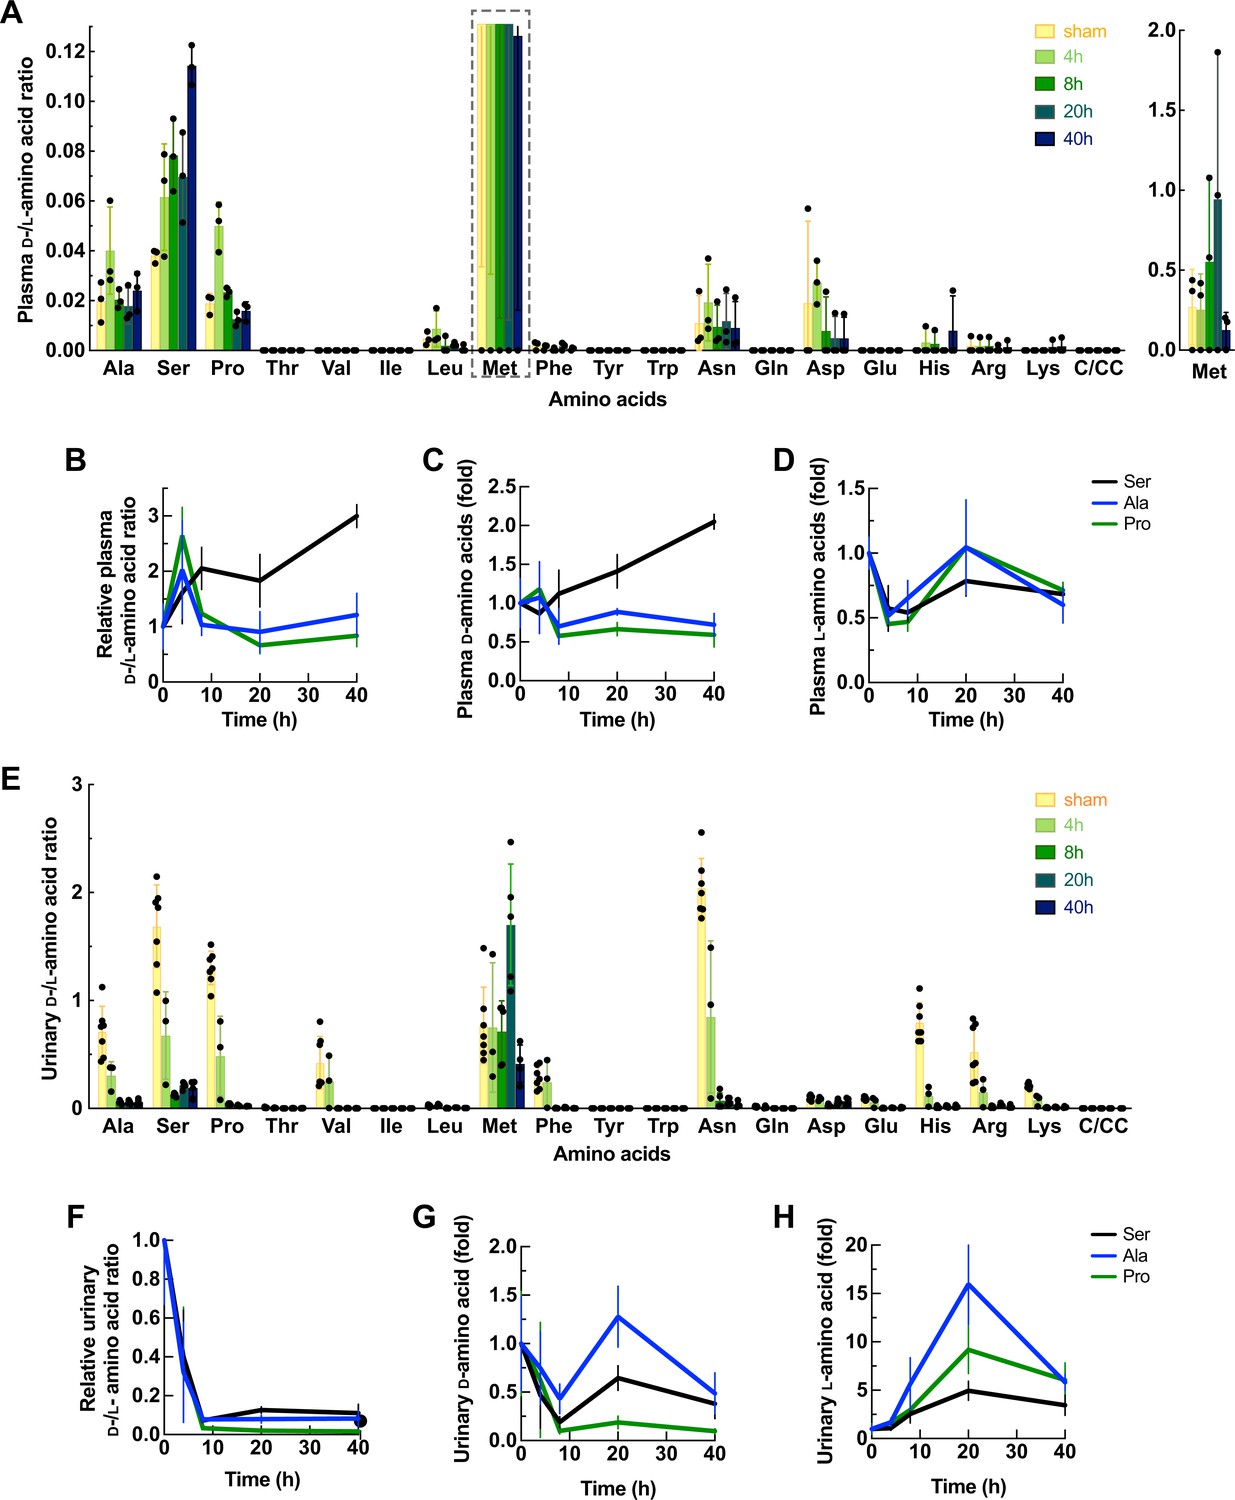
Enantiomeric profiles of d- and l-amino acids in plasma and urine of the ischemia-reperfusion injury (IRI) model.
Plasma and urine were collected from the mice after ischemia operation for 4, 8, 20, and 40 hr or sham operation (0 hr). The concentrations of 20 amino acids were measured by two-dimensional high-performance liquid chromatography (2D-HPLC) and plotted as mean ± SD. (A) Ratio of d-/l-amino acids from the plasma of the IRI model. The graph of Met is shown separately. n=3. (B–D) Plasma amino acid profiles of serine, alanine, and proline from (A) were normalized with 0 hr and plotted as ratios of d-/l- enantiomers (B), relative concentrations of d-isomers (C), and relative concentrations of l-isomers (D). (E) Ratio of d-/l-amino acids from the urine of the IRI model. n=3–7. (F–H) Urinary amino acid profiles of serine, alanine, and proline from (E) were normalized with those at 0 hr and plotted as ratios of d-/l- enantiomers (F), relative concentrations of d-isomers (G), and relative concentrations of l-isomers (H). C/CC: cysteine or cystine.
Figure 1—figure supplement 1
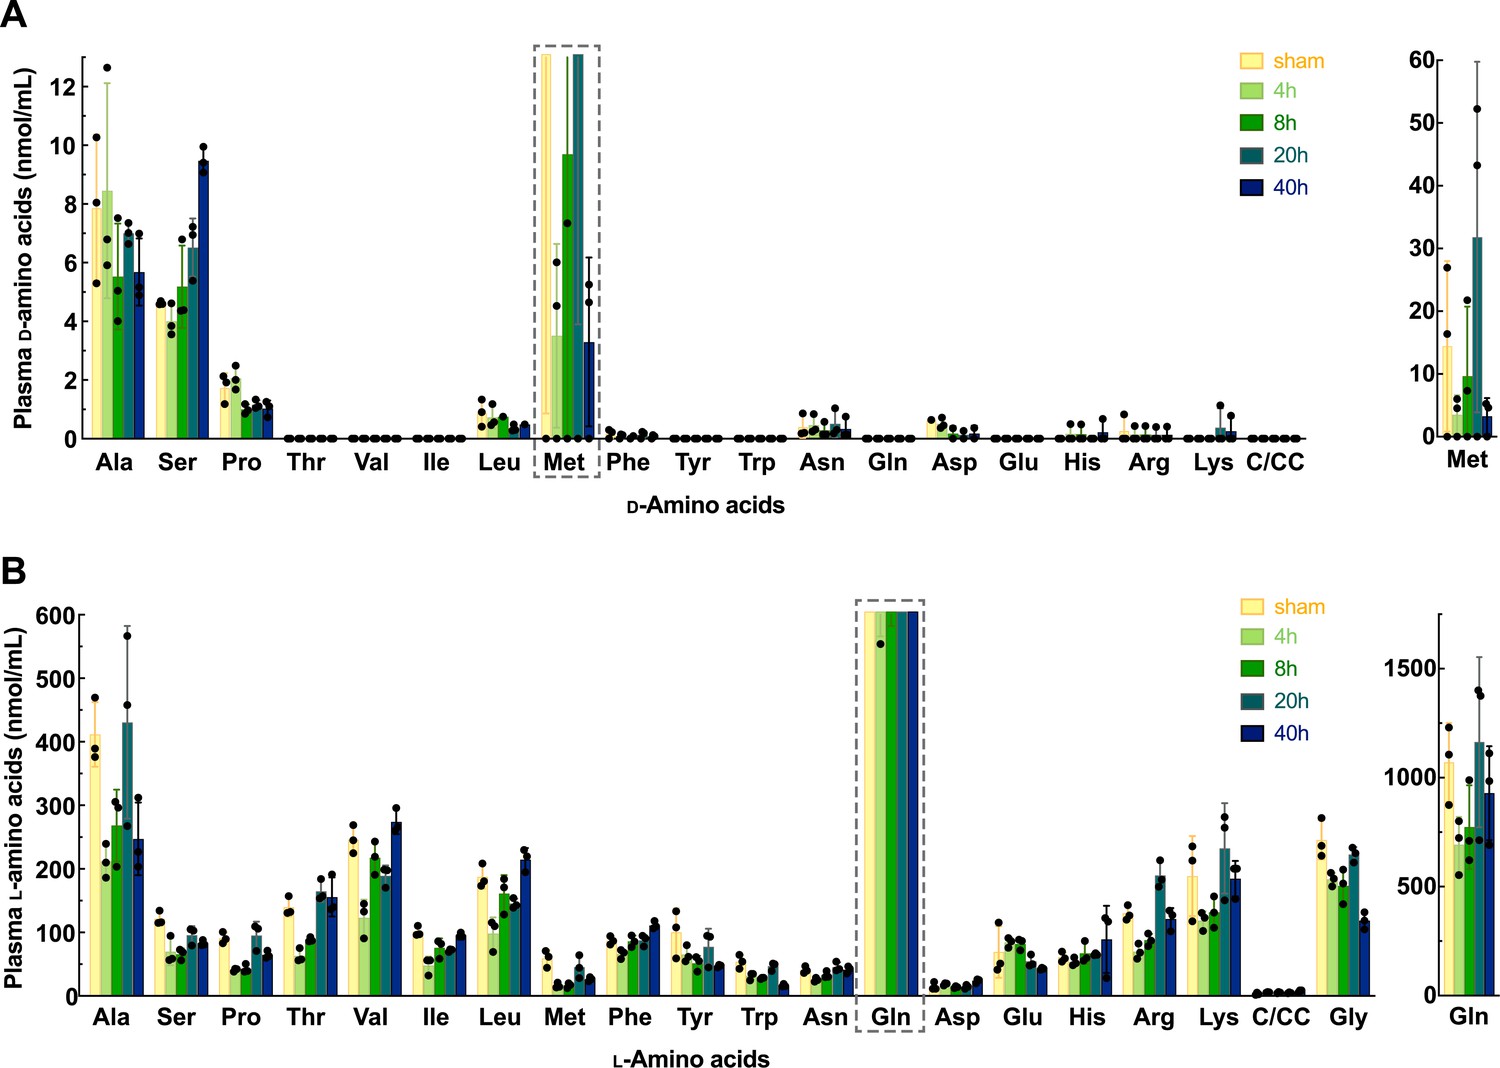
Enantiomeric profiles of d- and l-amino acids in plasma of the ischemia-reperfusion injury (IRI) model.
Plasma samples were collected from the mice after ischemia operation for 0, 4, 8, 20, and 40 hr or sham operation. Both d- and l-enantiomers of 20 amino acids were measured by two-dimensional high-performance liquid chromatography (2D-HPLC) and plotted as mean ± SD. (A) Concentration of plasma d-amino acids. Graphs of d-Met are shown separately for the proper resolution. (B) Concentration of plasma l-amino acids. Graphs of d-Gln are shown separately for the proper resolution. Glycine plots are included in (B). C/CC: cysteine or cystine. n=3.
Figure 1—figure supplement 2

Enantiomeric profiles of d- and l-amino acids in urine of the ischemia-reperfusion injury (IRI) model.
Urine samples were collected from the mice after ischemia operation for 0, 4, 8, 20, and 40 hr or sham operation. Both d- and l-enantiomers of 20 amino acids were measured by two-dimensional high-performance liquid chromatography (2D-HPLC) and plotted as mean ± SD. (A) Concentration of urinary d-amino acids. Graphs of d-Met are shown separately for the proper resolution. (B) Concentration of urinary l-amino acids. Graphs of d-Gln are shown separately for the proper resolution. Glycine plots are included in (B). C/CC: cysteine or cystine. n=3–7.
Figure 2
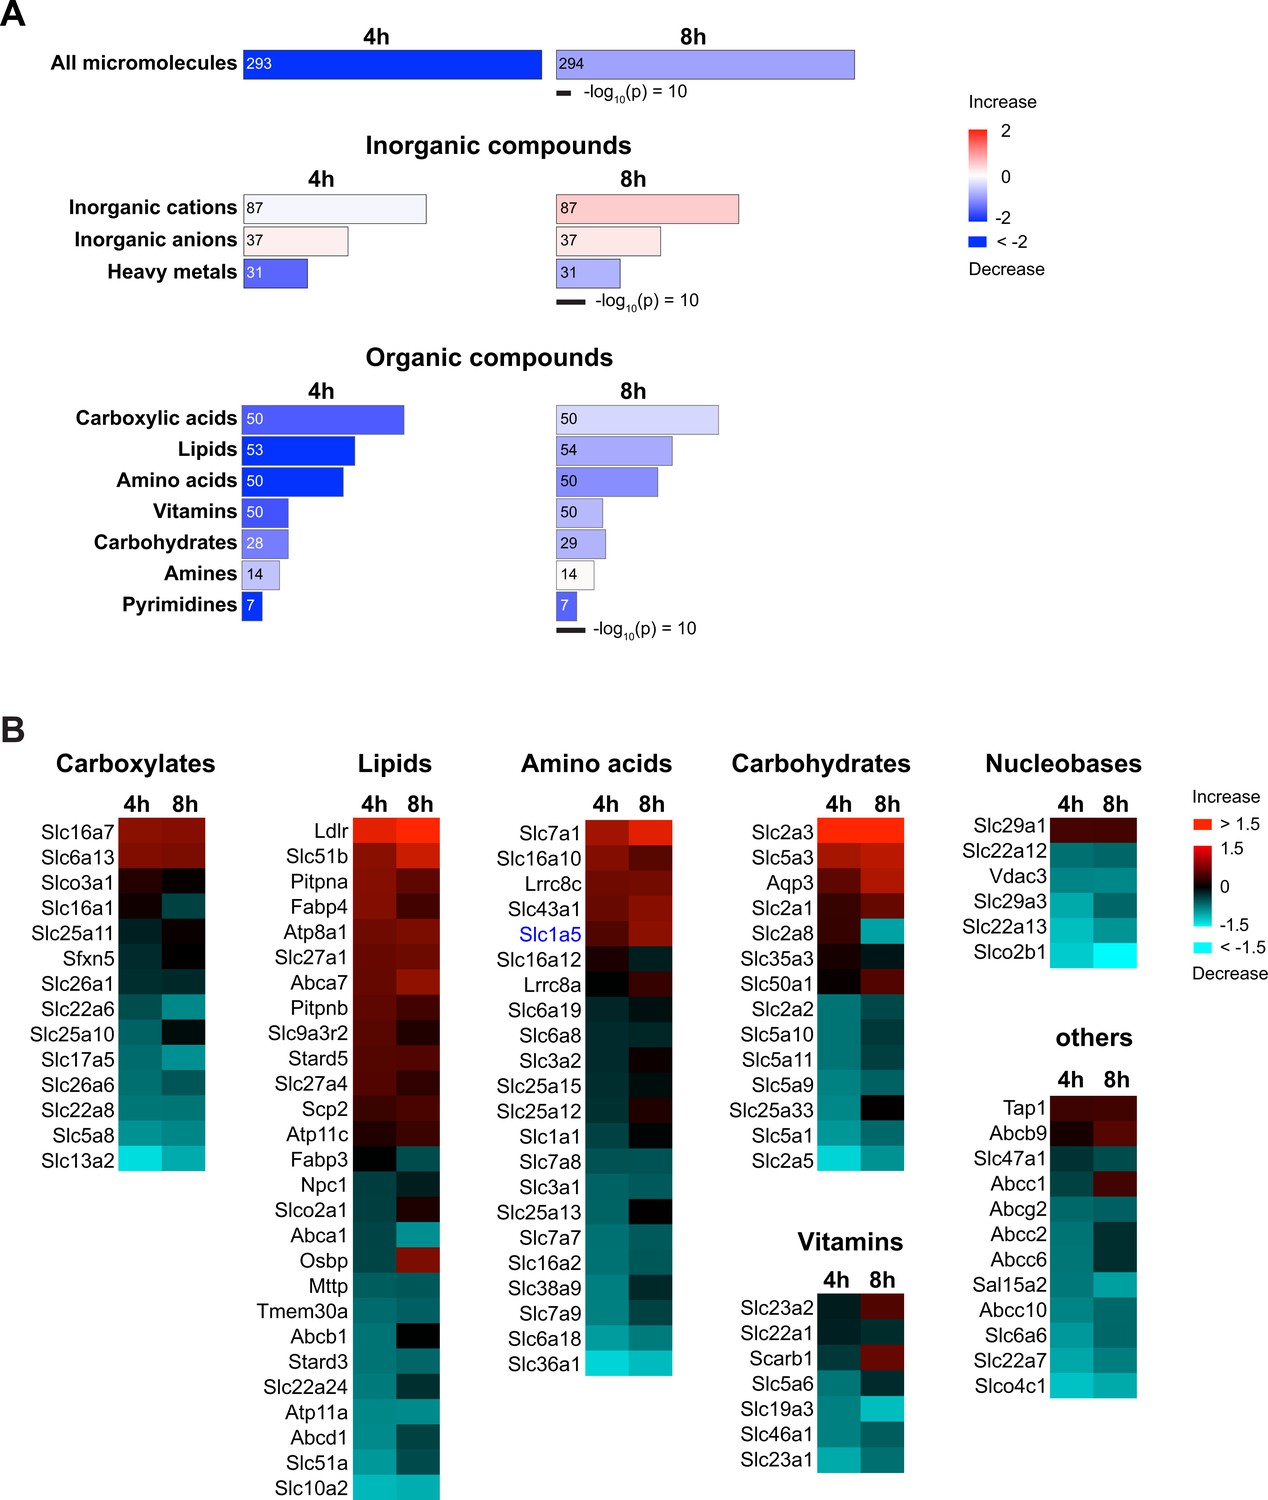
Molecular Transport in renal brush border membrane vesicles (BBMVs) proteome of the ischemia-reperfusion injury (IRI) model.
(A) Ingenuity Pathway Analysis (IPA) shows the heatmaps of Molecular Transport in the membrane proteome from BBMVs of the IRI model (4 hr IRI/sham [4 hr] or 8 hr IRI/sham [8 hr]). Transport functions are categorized by types of substrates. Transport of all micromolecules (top) is derived from the combination of inorganic (middle) and organic compounds (bottom). Area and colors represent –log10(p-value) and annotated functions (z-score), respectively. Numbers inside the columns indicate the numbers of corresponding proteins. (B) Heatmaps of membrane transport proteins that mediate the transport of organic compounds. The proteins with ratios of more than 1.1-fold change are shown. The category ‘others’ includes the transport of peptides, organic cations, organic anions, and drugs. Colors indicate log2 fold of 4 hr IRI/sham (4 hr) or 8 hr IRI/sham (8 hr).
Figure 3 with 1 supplement
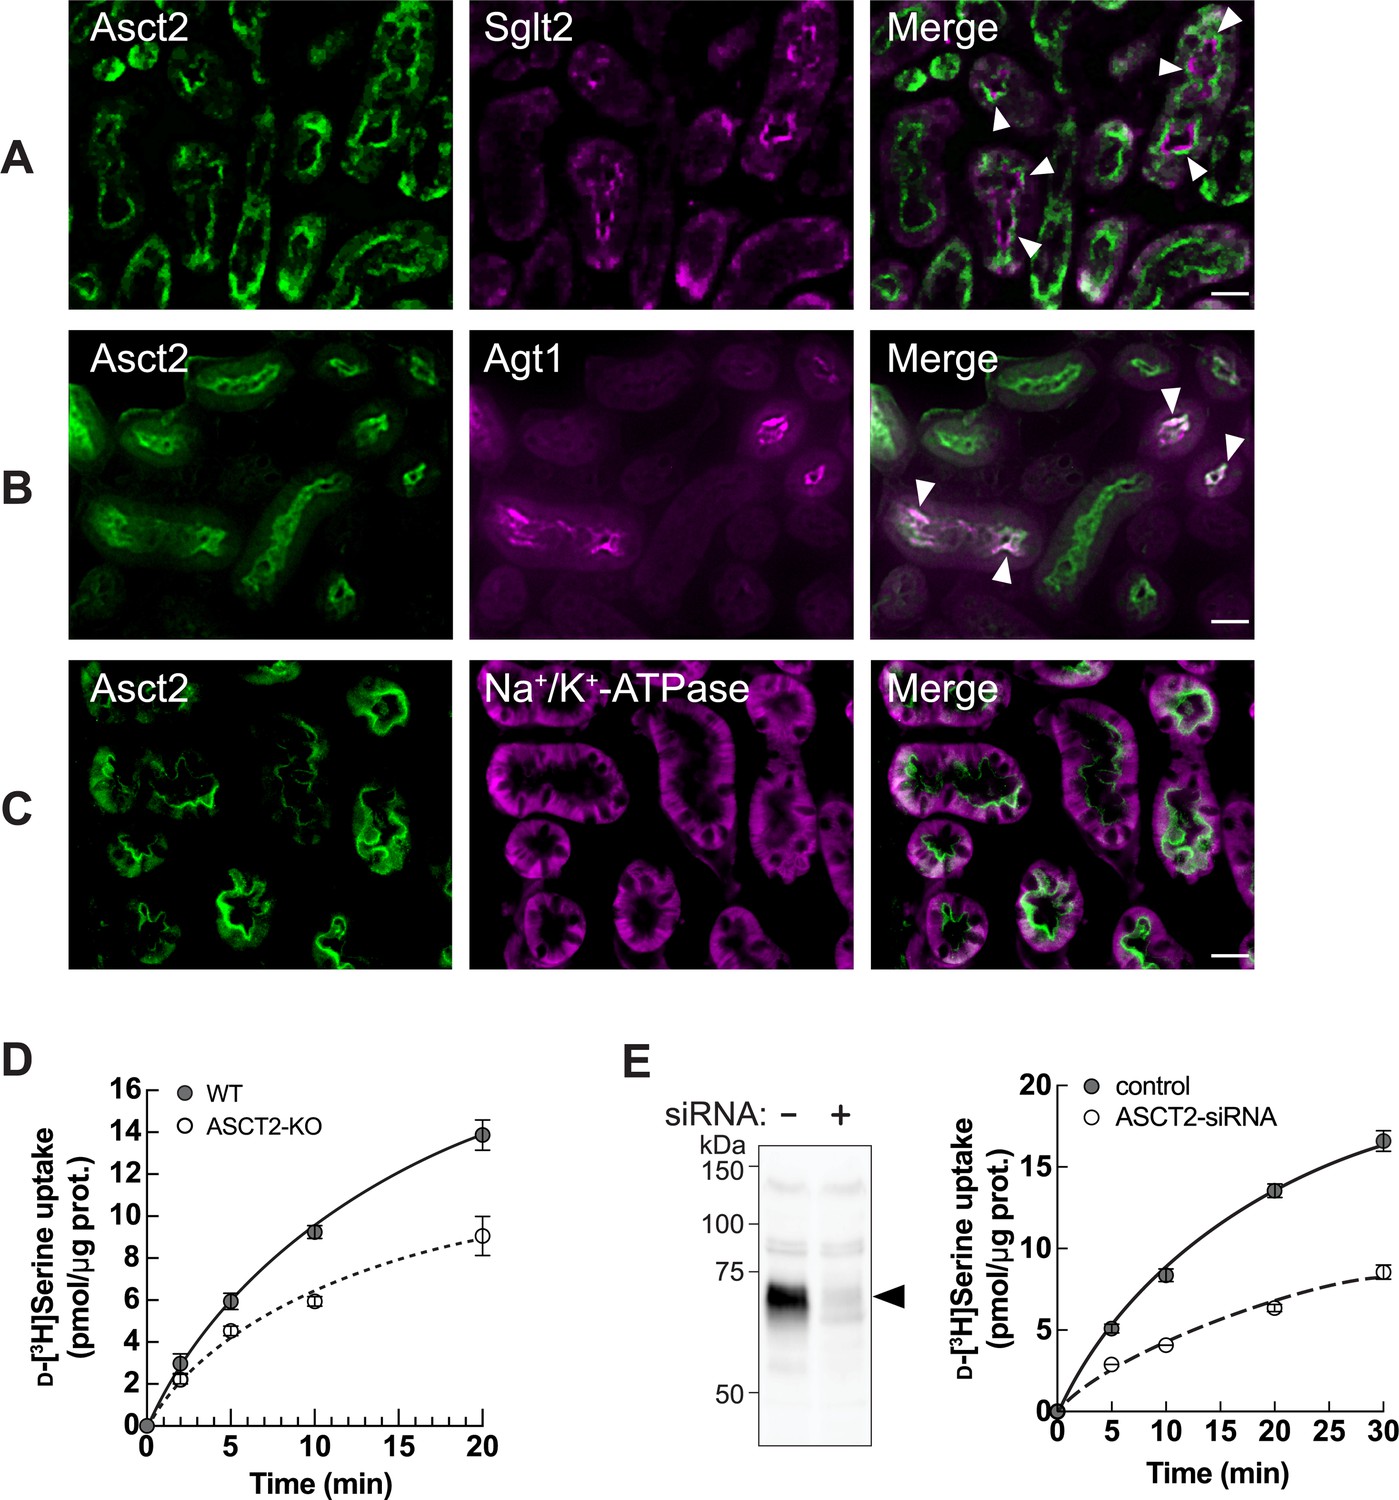
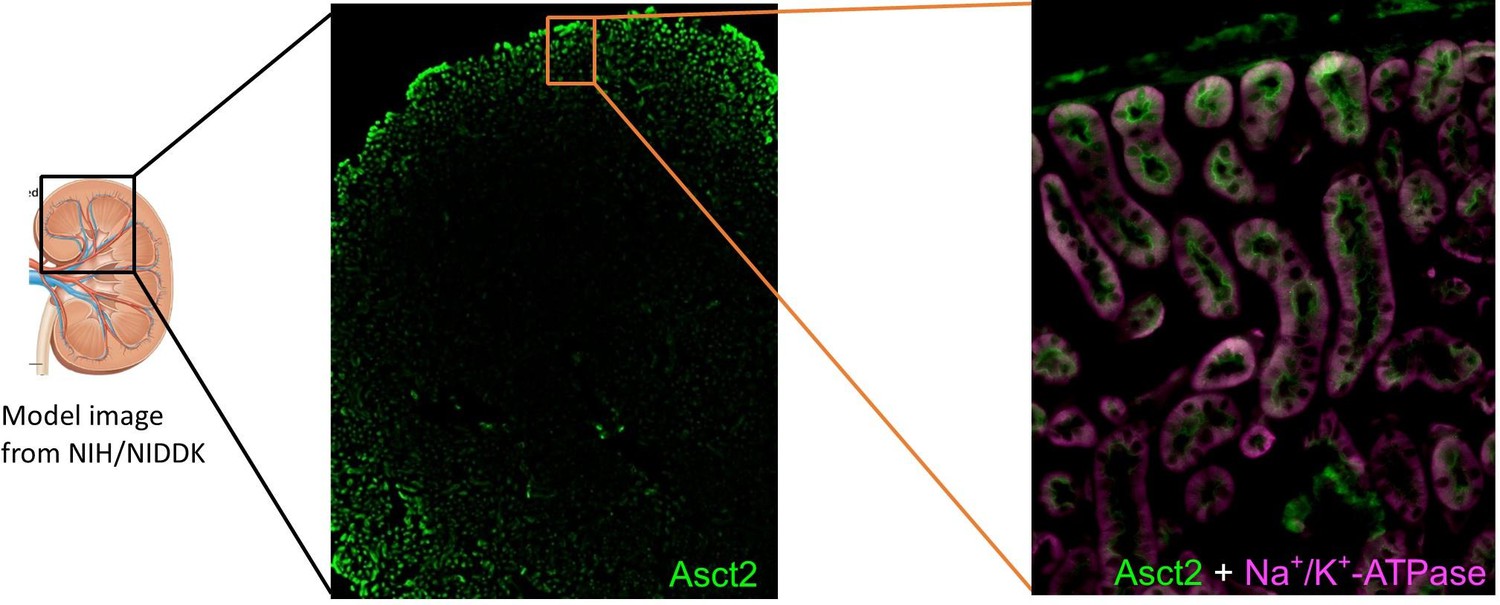
ASCT2 is one of d-serine transporters at the apical membrane of renal proximal tubular epithelia.
(A–C) Localization of Asct2 in mouse kidney by immunofluorescence staining. Mouse kidney slides were co-stained with anti-Asct2(NT) antibody (Asct2; green) and protein markers for renal proximal tubule segments: anti-Sglt2 antibody (A: Sglt2, apical membrane marker of S1+S2 segments), anti-Agt1 antibody (B: Agt1, apical membrane marker of S3 segment), and anti-Na+/K+-ATPase antibody (C: Na+/K+-ATPase, basolateral membrane marker). Merge images are shown in the right panel. Arrowheads indicate co-localization of the proteins. Scale bar = 20 μm. (D) Time course of 100 μM d-[3H]serine transport in wild-type (WT) and ASCT2 knockout (ASCT2-KO) HAP1 cells measured in PBS pH 7.4. Dot plot = mean ± SEM; n=3. (E) Left: Western blot using anti-ASCT2 antibody verified the suppression of ASCT2 in ASCT2-siRNA-transfected HEK293 cells. Right: Transport of 100 μM d-[3H]serine (in PBS pH 7.4) was measured in ASCT2 knockdown (ASCT2-siRNA) in comparison to the Mock cells (control). Dot plot = mean ± SEM; n=3.
-
Figure 3—source data 1
The original unedited picture of western blot for Figure 3E.
- https://cdn.elifesciences.org/articles/92615/elife-92615-fig3-data1-v1.zip
-
Figure 3—source data 2
The file containing Figure 3E and uncropped picture of western blot with indicated bands used in the figure.
- https://cdn.elifesciences.org/articles/92615/elife-92615-fig3-data2-v1.pdf
Figure 3—figure supplement 1

Characterization of ASCT2 as a d-serine transporter in HEK293 cells.
(A) Western blot of Asct2 from renal brush border membrane vesicles (BBMVs) of the normal mice. Asct2 was detected by anti-Asct2(NT) (left) or anti-Asct2(CT) (right) antibodies. (B) Transport of 10 μM d-[3H]serine was measured for 10 or 20 min in HEK293 cells in the presence or absence of Na+. Bar graph = mean ± SEM; n=3. (C) Inhibition of d-[3H]serine transport by several compounds. Left: 5 μM d-[3H]serine uptake was measured for 10 min in the presence or absence of 2 mM l-amino acids. Bar graph = mean ± SEM; n=5. Right: 2 μM d-[3H]serine uptake was measured in the presence or absence of 1 mM inhibitors; Ben-Cys: S-benzyl-l-cysteine, a non-specific inhibitor of ASCT2; GPNA: l-γ-glutamyl-p-nitroanilide, an inhibitor of ASCT2, SNATs, and LATs; MeAIB: 2-(methylamino)isobutyric acid, a system A inhibitor. Bar graph = mean ± SEM; n=3. (D) Cell growth measurement (XTT assay) of HEK293 cells treated with either l-serine or d-serine 5–30 mM for 2 days. d-Serine inhibition curve was fitted to non-linear regression of log10[d-Ser] vs cell growth, resulting in IC50 of 17.4±1.05 mM and minimum growth at OD 450 nm of 1.15 arbitrary units (AU). Dot plot = mean ± SEM; n=3–5.
-
Figure 3—figure supplement 1—source data 1
The original unedited picture of western blot:anti-Asct2(NT) for Figure 3—figure supplement 1A: left.
- https://cdn.elifesciences.org/articles/92615/elife-92615-fig3-figsupp1-data1-v1.zip
-
Figure 3—figure supplement 1—source data 2
The original unedited picture of western blot:anti-Asct2(CT) for Figure 3—figure supplement 1A: right.
- https://cdn.elifesciences.org/articles/92615/elife-92615-fig3-figsupp1-data2-v1.zip
-
Figure 3—figure supplement 1—source data 3
The file containing Figure 3—figure supplement 1A and uncropped picture of western blot with indicated bands used in the figure.
- https://cdn.elifesciences.org/articles/92615/elife-92615-fig3-figsupp1-data3-v1.pdf
Figure 4 with 1 supplement
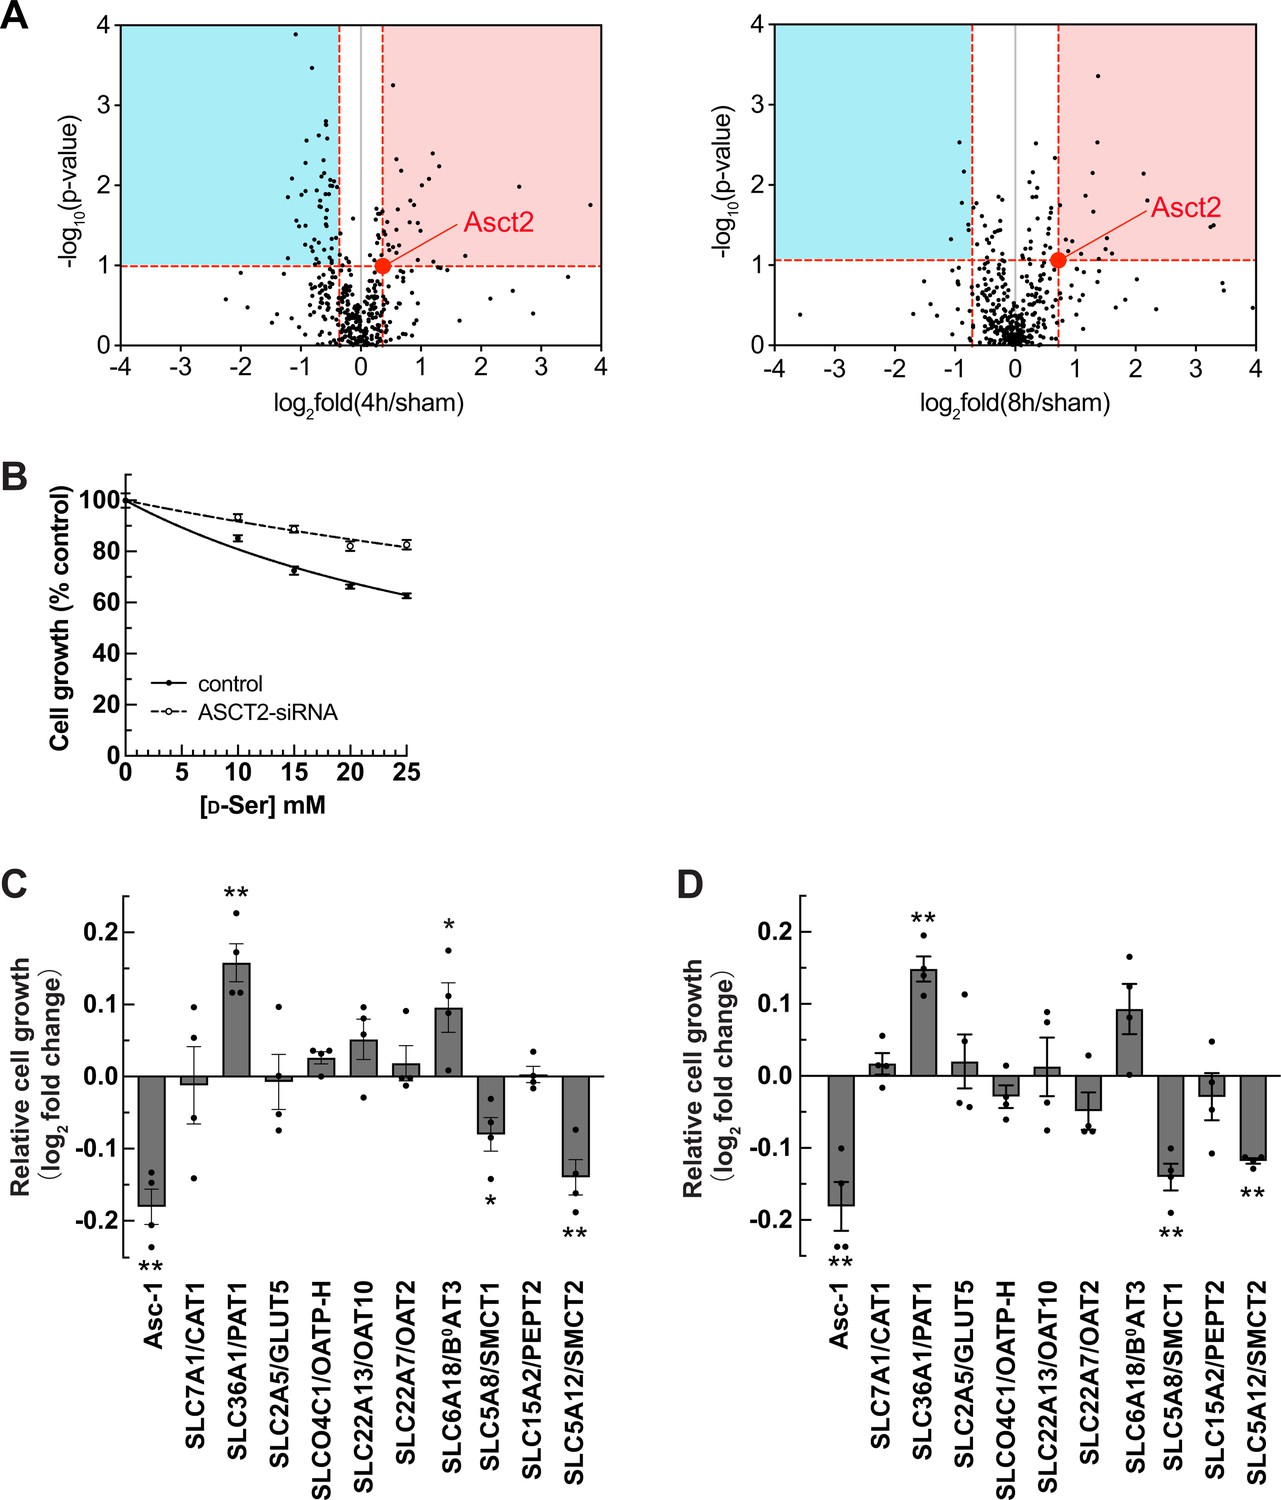
Identification of SMCT1 and SMCT2 as candidates of d-serine transporters.
(A) Volcano plots of 398 membrane transport proteins identified from the brush border membrane vesicle (BBMV) proteome of the ischemia-reperfusion injury (IRI) model. The median of log2 fold of 4 hr IRI/sham (left) or 8 hr IRI/sham (right) were plotted against –log10 of p-value. Three proteins with log2 fold more than 4.0 (see values in Supplementary file 1) are omitted for a better view. The value of Asct2 (red dot) was set as a cutoff value to select d-serine transporter candidates (both increased [red area] and decreased [blue area] expressions). (B) Cell growth measurement (XTT assay) of ASCT2-siRNA or without siRNA (control) transfected HEK293 cells treated with d-serine. Data represent percent cell growth compared to the non-treated cells. The graphs were fitted to inhibition kinetics (dose-response – inhibition). Dot plot = mean ± SEM; n=5. (C and D) Candidates of d-serine transporters were screened by cell growth measurement. HEK293 cells were transfected with various cDNA clones, as indicated. After transfection, the cells were treated with either 15 mM (C) or 25 mM (D) d-serine for 2 days and cell growth was examined. The growth effect by d-serine treatment was normalized with that of no treatment and then calculated as log2 fold change of Mock at the same d-serine concentration. Asc-1 is used as the positive control. Bar graph = mean ± SEM; n=4; *p<0.05; **p<0.01. SMCT, sodium-coupled monocarboxylate transporter.
Figure 4—figure supplement 1
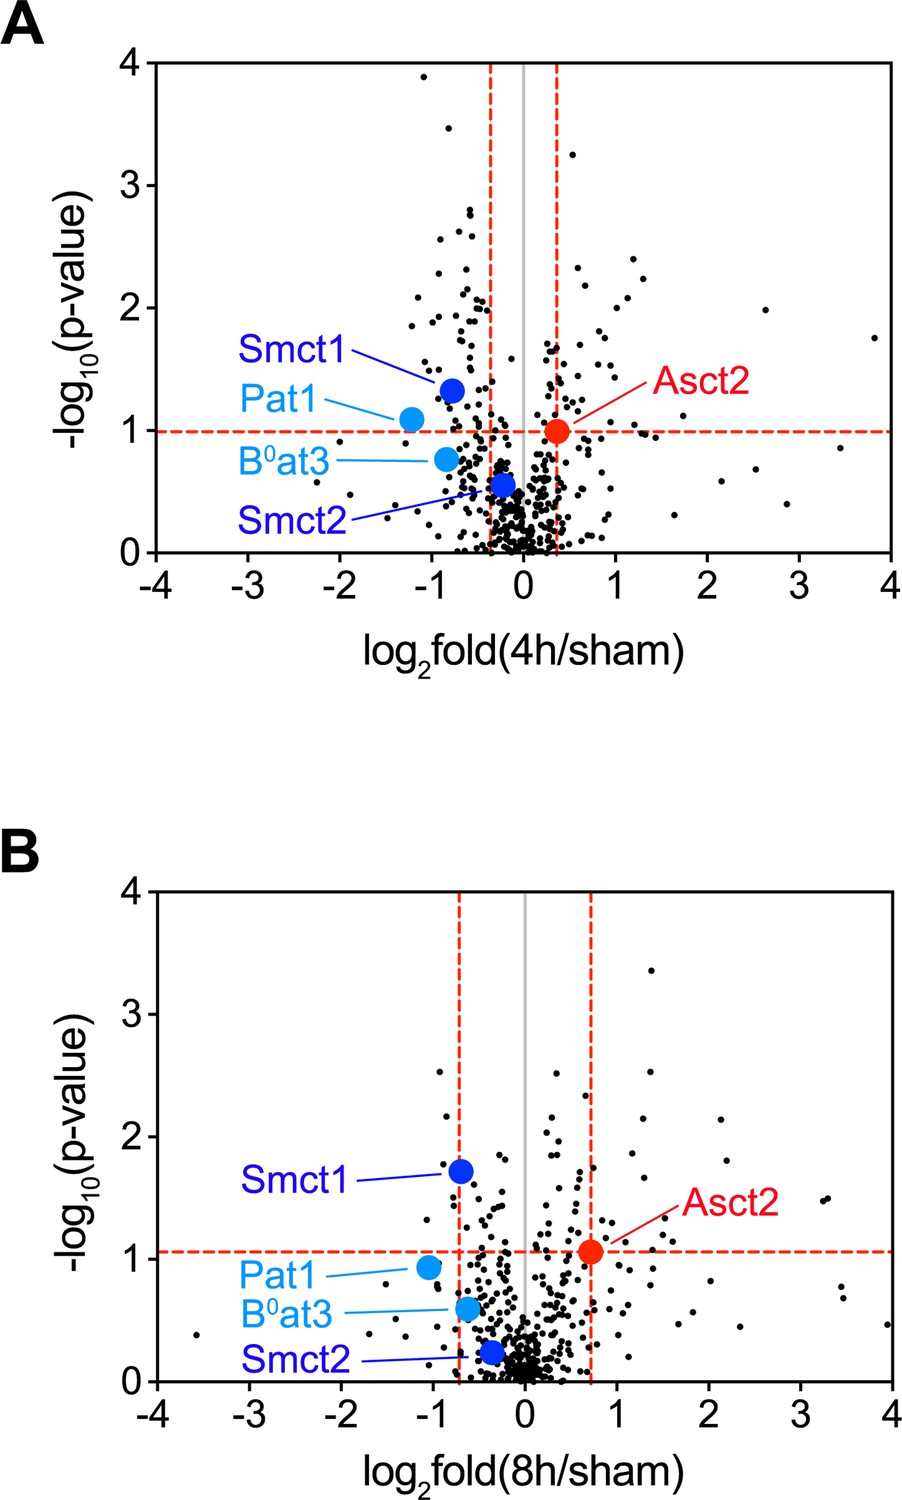
Expressions of Smct1, Smct2, Pat1, and B0at3 in the volcano plots of membrane transport proteins.
Volcano plot of 389 membrane transport proteins as identically shown in Figure 4A. Positions of Smct1, Smct2, Pat1, and B0at3 are indicated. (A) The plot of proteins from 4 hr/sham. (B) The plot of proteins from 8 hr/sham.
Figure 5 with 1 supplement

Characterization of SMCT1 and SMCT2 as d-serine transporters using SMCT1 and SMCT2 stably expressing cells.
(A) Inhibition effect of ibuprofen on d-serine-induced cell growth. FlpInTR-Mock (Mock), FlpInTR-SMCT1 (SMCT1), or FlpInTR-SMCT2 (SMCT2) cells were treated with d-serine for 2 days in the presence or absence of 0.5 mM ibuprofen. Cell growth was measured by XTT assay. For comparison, the maximum growth inhibition by 25 mM d-serine treatment was set as 100% inhibition, and no d-serine treatment was set as 0% inhibition. The graphs were fitted to inhibition kinetics (dose-response – inhibition). Dot plot = mean ± SEM; n=5. (B) Time course of 100 μM d-[3H]serine uptake in FlpInTR-SMCT1 (SMCT1), FlpInTR-SMCT2 (SMCT2), and Mock cells. d-[3H]Serine transport was measured in PBS pH 7.4. Dot plot = mean ± SEM; n=4. (C) Time course of 100 μM d-[3H]serine uptake was measured similarly to (B), but the cells were subjected to ASCT2 knockdown (siRNA transfection) 2 days before the assay. Dot plot = mean ± SEM; n=4. (D) Transport of 20 μM d-[3H]serine by ASCT2-siRNA-transfected FlpInTR-SMCT1 or FlpInTR-SMCT2-stable cell lines were measured in the absence (-) or presence of 5 mM indicated inhibitors. The uptake was measured for 10 min in PBS pH 7.4. Graphs represented the uptake data subtracted from those of Mock cells. Bar graph = mean ± SEM; n=3. (E) Concentration dependence of d-[3H]serine transport in ASCT2-siRNA-transfected FlpInTR-SMCT1 cells. Uptake of d-[3H]serine (0.5–10 mM) was measured for 10 min in PBS pH 7.4. Raw data was shown in Figure 5—figure supplement 1D. The uptake data in FlpInTR-SMCT1 were subtracted from those of Mock cells and fitted to Michaelis-Menten plot with the apparent Km of 3.39±0.79 mM and Vmax of 18.23±1.73 pmol/μg protein/min. Dot plot = mean ± SEM; n=3–4. SMCT, sodium-coupled monocarboxylate transporter.
Figure 5—figure supplement 1

SMCT1 and SMCT2 functions in FlpInTR-SMCT1 and FlpInTR-SMCT2-stable cell lines.
(A) Western blot of membrane fractions from FlpInTR-Mock, -SMCT1, and -SMCT2 cells with ASCT2-siRNA transfection. Flp-In T-REx 293 stably expressing SMCT1 (SMCT1) and SMCT2 (SMCT2), as well as Mock, were transfected with ASCT2-siRNA for 2 days. Membrane proteins were extracted from crude membrane fractions and subjected to western blot analysis. ASCT2 knockdown efficiency was evaluated by anti-ASCT2 antibody. Expression of SMCT1 and SMCT2 were verified by anti-FLAG antibody. (B and C) Evaluation of SMCT1 and SMCT2 functions by transport assay. Time course of 50 μM [14C]nicotinate uptake was measured for 0.5–5 min in FlpInTR-SMCT1 (B) and FlpInTR-SMCT2 (C) cells, compared to Mock cells. Dot plot = mean ± SEM; n=3. (D) Raw data of Figure 5E: d-[3H]serine uptake in FlpIn293TR-SMCT1 compared to FlpIn293TR-Mock cells. The uptake values were fitted to Michaelis-Menten plot. Dot plot = mean ± SEM; n=3–4. SMCT, sodium-coupled monocarboxylate transporter.
-
Figure 5—figure supplement 1—source data 1
The original unedited picture of western blot:anti-ASCT2 for Figure 5—figure supplement 1A: top.
- https://cdn.elifesciences.org/articles/92615/elife-92615-fig5-figsupp1-data1-v1.zip
-
Figure 5—figure supplement 1—source data 2
The original unedited picture of western blot:anti-FLAG for Figure 5—figure supplement 1A: bottom.
- https://cdn.elifesciences.org/articles/92615/elife-92615-fig5-figsupp1-data2-v1.zip
-
Figure 5—figure supplement 1—source data 3
The file containing Figure 5—figure supplement 1A and uncropped picture of western blot with indicated bands used in the figure.
- https://cdn.elifesciences.org/articles/92615/elife-92615-fig5-figsupp1-data3-v1.pdf
Figure 6 with 1 supplement
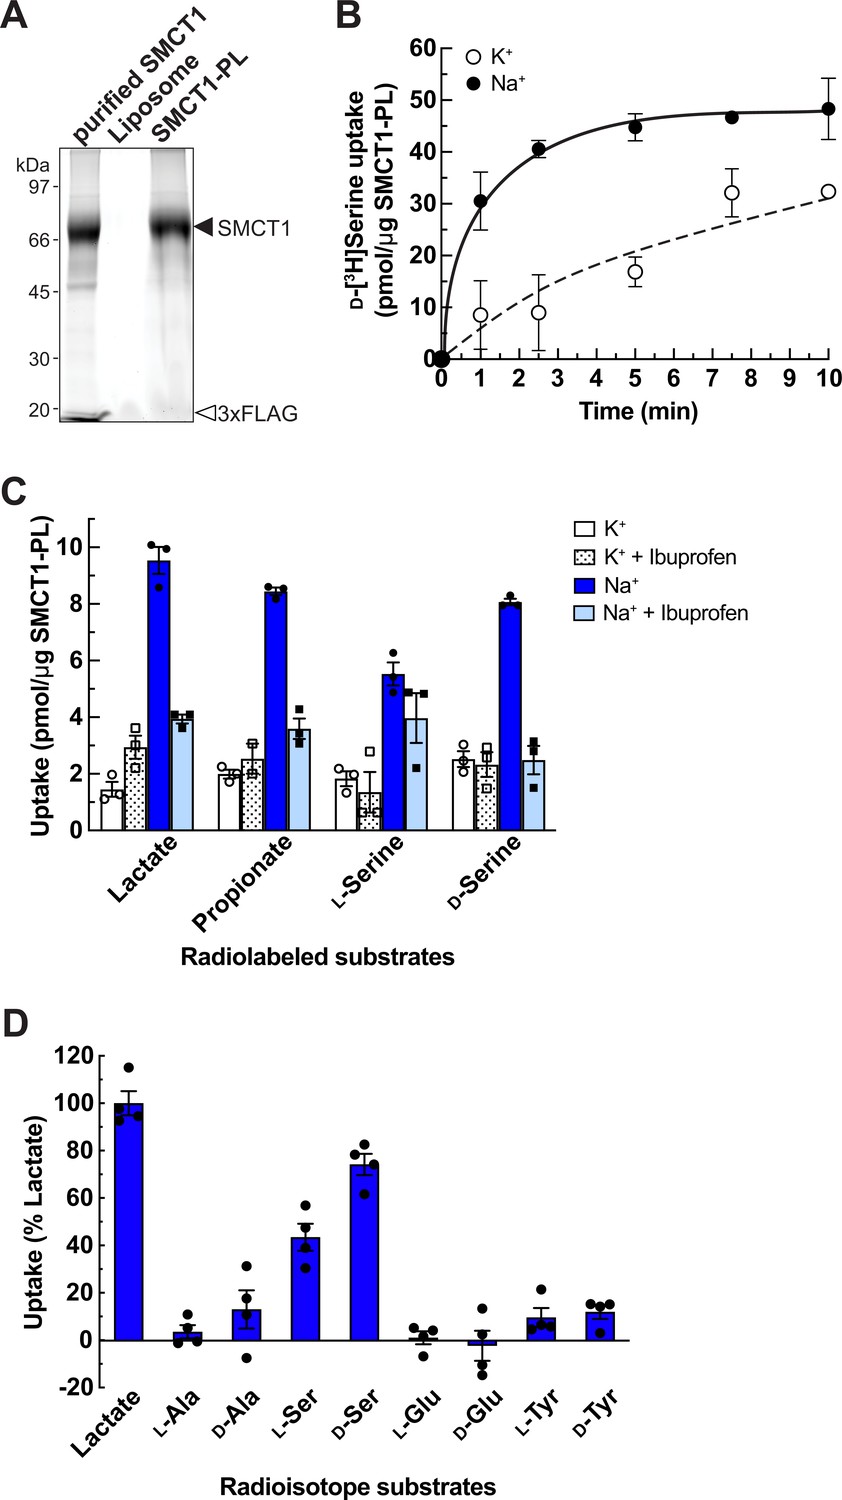
Characterization of SMCT1 as d-serine transporter using SMCT1-reconstituted proteoliposomes (SMCT1-PL).
(A) Left: Stain-free SDS-PAGE gel shows SMCT1 (purified SMCT1) purified from pCMV14-SMCT1-transfected Expi293F cells, reconstituted empty liposomes (Liposome) and SMCT1-reconstituted proteoliposomes (SMCT1-PL). (B) Time course of d-[3H]serine transport in SMCT1-PL. Uptake of 200 μM d-[3H]serine was measured in Na+-containing buffer (Na+) compared to Na+-free buffer (K+). Dot plot = mean ± SEM; n=3. (C) Ibuprofen effect on the uptake of [3H]lactate, [3H]propionate, l-[3H]serine, and d-[3H]serine in SMCT1-PL. Uptakes of 50 μM radiolabeled substrates were measured for 5 min in Na+-containing buffer (Na+) or Na+-free buffer (K+) in the presence or absence of 1 mM ibuprofen. Bar graph = mean ± SEM; n=3. (D) Amino acid selectivity of SMCT1-PL. Transport of 50 μM radiolabeled amino acids was measured in SMCT1-PL for 5 min. The substrate uptake in Na+-containing buffer was subtracted from those in Na+-free buffer and calculated as % lactate uptake. Bar graph = mean ± SEM; n=4. SMCT, sodium-coupled monocarboxylate transporter.
-
Figure 6—source data 1
The original unedited picture of SDS-PAGE gel for Figure 6A.
- https://cdn.elifesciences.org/articles/92615/elife-92615-fig6-data1-v1.zip
-
Figure 6—source data 2
The file containing Figure 6A and uncropped picture of SDS-PAGE gel with indicated bands used in the figure.
- https://cdn.elifesciences.org/articles/92615/elife-92615-fig6-data2-v1.pdf
Figure 6—figure supplement 1
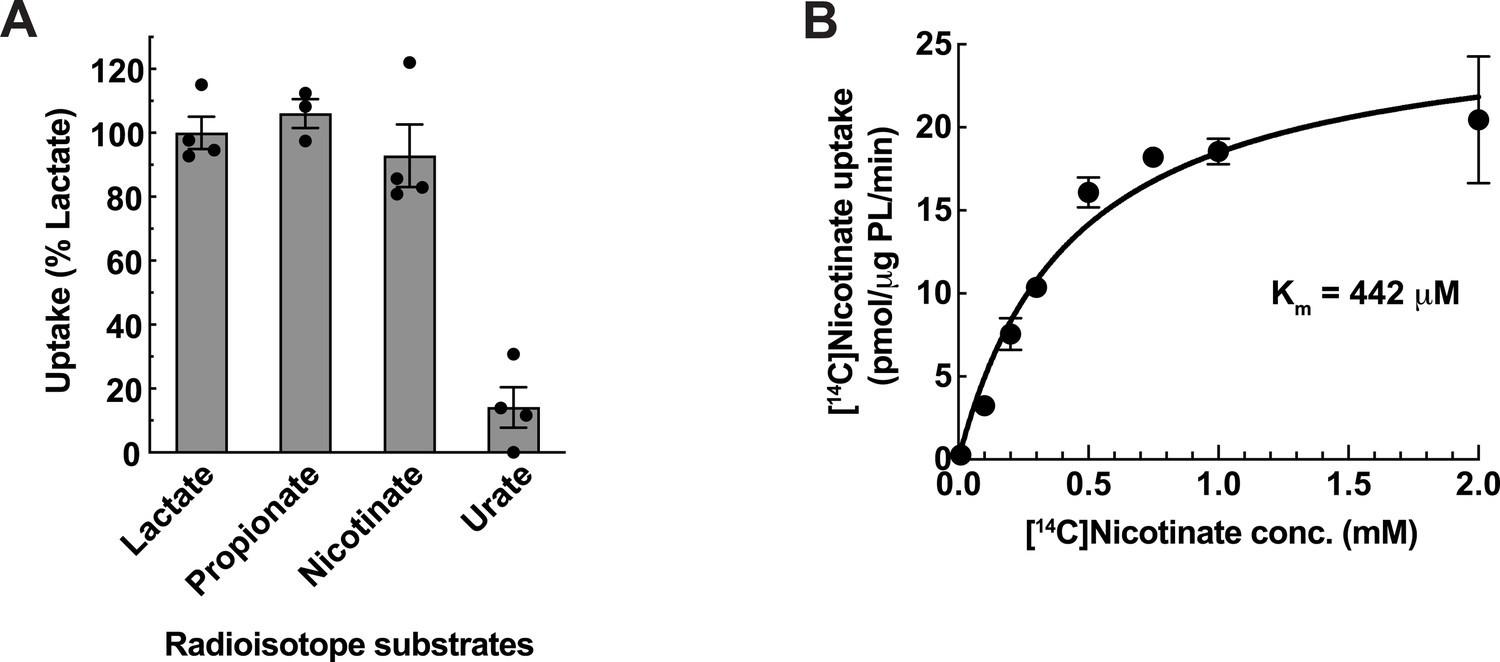
SMCT1 function in SMCT1-reconstituted proteoliposomes.
(A) Transport of SMCT1 canonical substrates in SMCT1-reconstituted proteoliposome (SMCT1-PL). Uptake of 50 μM radiolabeled substrates was measured for 5 min in Na+-containing buffer and subtracted with the uptake in Na+-free buffer. Urate is used as a negative control. Bar graph = mean ± SEM; n=3–4. (B) Concentration dependence of [14C]nicotinate uptake in SMCT1-PL. Uptake of [14C]nicotinate (0.01–2 mM) by SMCT1-PL was measured for 3 min in Na+-containing buffer and then subtracted with the uptake in Na+-free buffer. The graph was fitted to Michaelis-Menten plot with the apparent Km of 442±94 μM and Vmax of 26.7±2.23 pmol/μg PL/min. Dot plot = mean ± SEM; n=3–4. SMCT, sodium-coupled monocarboxylate transporter.
Figure 7 with 3 supplements
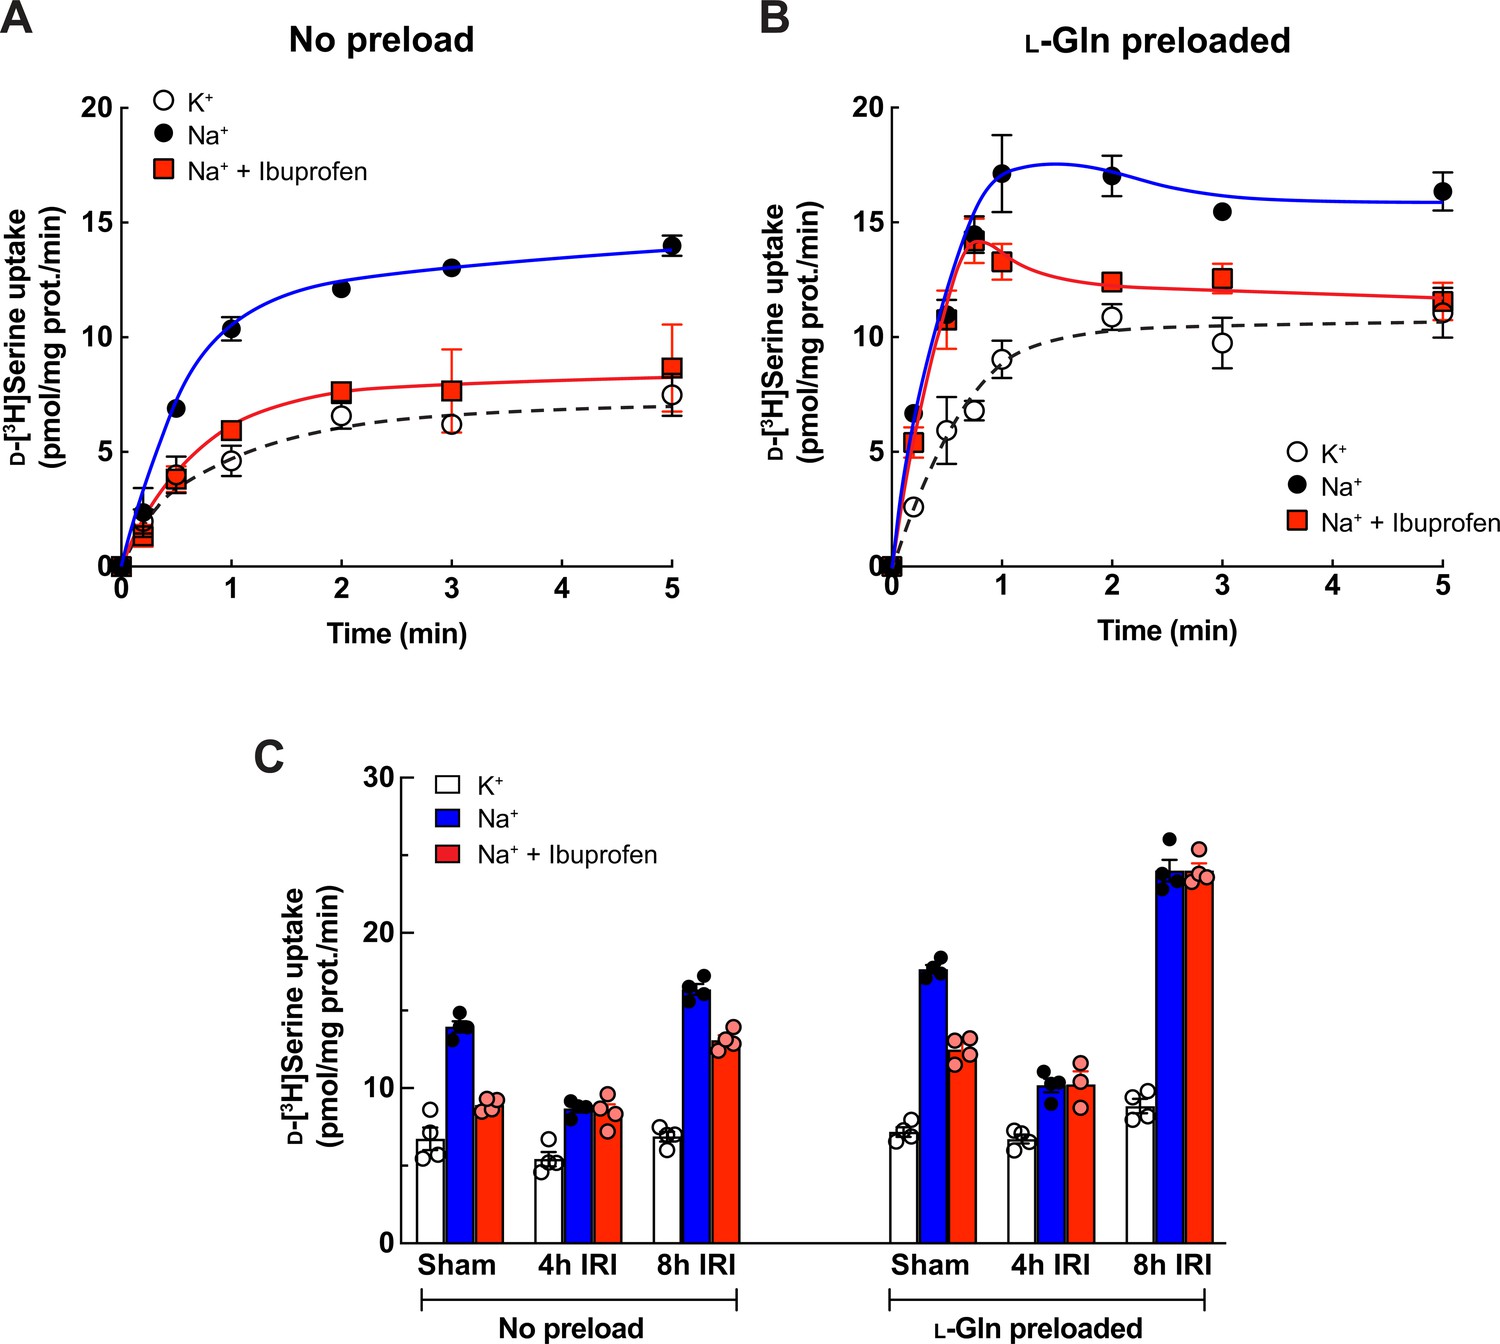
Characterization of d-serine transporters in brush border membrane vesicles (BBMVs) of normal mice and the ischemia-reperfusion injury (IRI) model.
(A) Transport of 10 μM d-[3H]serine in renal BBMVs isolated from normal mice. The uptake was measured in Na+-free buffer (K+), Na+-containing buffer (Na+), or the presence of 1 mM ibuprofen (Na++Ibuprofen). Dot plot = mean ± SEM; n=3. (B) Transport of 10 μM d-[3H]serine in renal BBMVs isolated from the normal mice was performed similarly to (A) but the BBMVs were preloaded with 4 mM l-Gln prior to the measurement. Dot plot = mean ± SEM; n=4. (C) Transport of 10 μM d-[3H]serine in renal BBMVs isolated from IRI model. Prior to uptake measurement, the BBMVs were preloaded with 4 mM l-Gln or buffer (no preload). The uptake was measured for 1 min in Na+-free buffer (K+), Na+-containing buffer (Na+), or the presence of 1 mM ibuprofen (Na++Ibuprofen). Bar graph = mean ± SEM; n=3–4.
Figure 7—figure supplement 1

Expression of Smct1, Smct2, and Asct2 in renal proximal tubules of the ischemia-reperfusion injury (IRI) model by single-nucleus RNA sequencing (snRNA-seq).
Data of Smct1, Smct2, and Asct2 expression in the IRI model by snRNA-seq were obtained from the open-sourced dataset. Bubble plots indicate the expressions of Smct1, Smct2, and Asct2 in clusters of proximal tubule segments 1 (S1) (A), 2 (S2) (B), and 3 (S3) (C). The mRNA expressions at early IRI stages (4 and 12 hr) were compared to the sham controls (Ctrl). (D) The zoom-in plots of Asct2 from (A–C). ‘Percent Expressed’ represents the percentage of cells expressing each gene in each cluster. ‘Average Expression’ indicates the scaled expression level: 0, the mean expression of a gene across cells; the positive variance, increased expression; the negative variance, decreased expression.
Figure 7—figure supplement 2
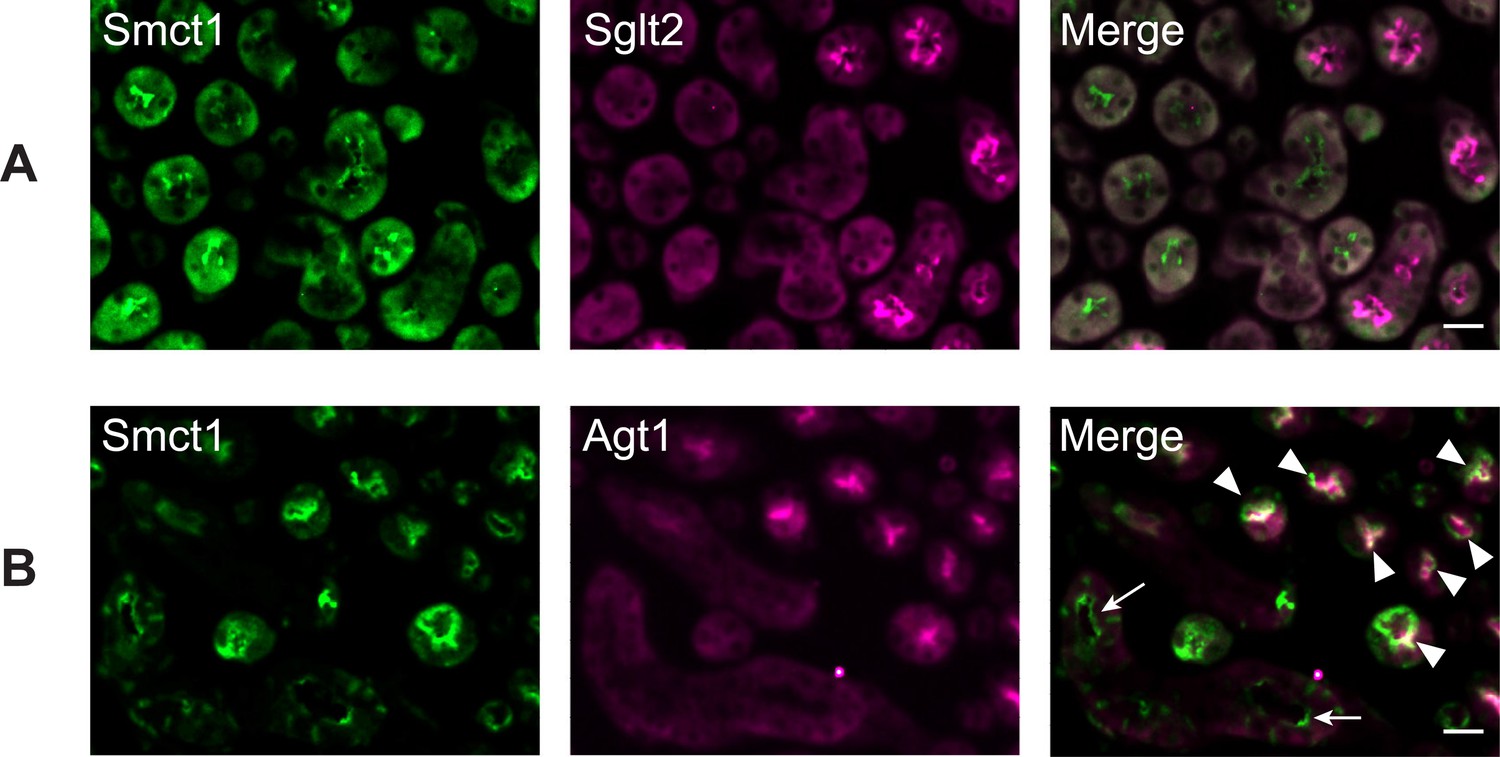
SMCT1 is mainly localized at the apical membrane of renal proximal tubular S3 segment.
Localization of Smct1 in the mouse kidney was determined by immunofluorescence staining. Mouse kidney slide was co-stained with anti-Smct1 (Smct1; green) antibody and protein markers for renal proximal tubule segments: anti-Sglt2 antibody (A: Sglt2, apical membrane marker of S1 + S2 segments) or anti-Agt1 antibody (B: Agt1, apical membrane marker of S3 segment). Merge images are shown in the right panel. Arrowheads indicate co-localization of the proteins. Arrow shows some parts of the faint Smct1 without Agt1 co-localization. Scale bar = 20 μm. SMCT, sodium-coupled monocarboxylate transporter.
Figure 7—figure supplement 3
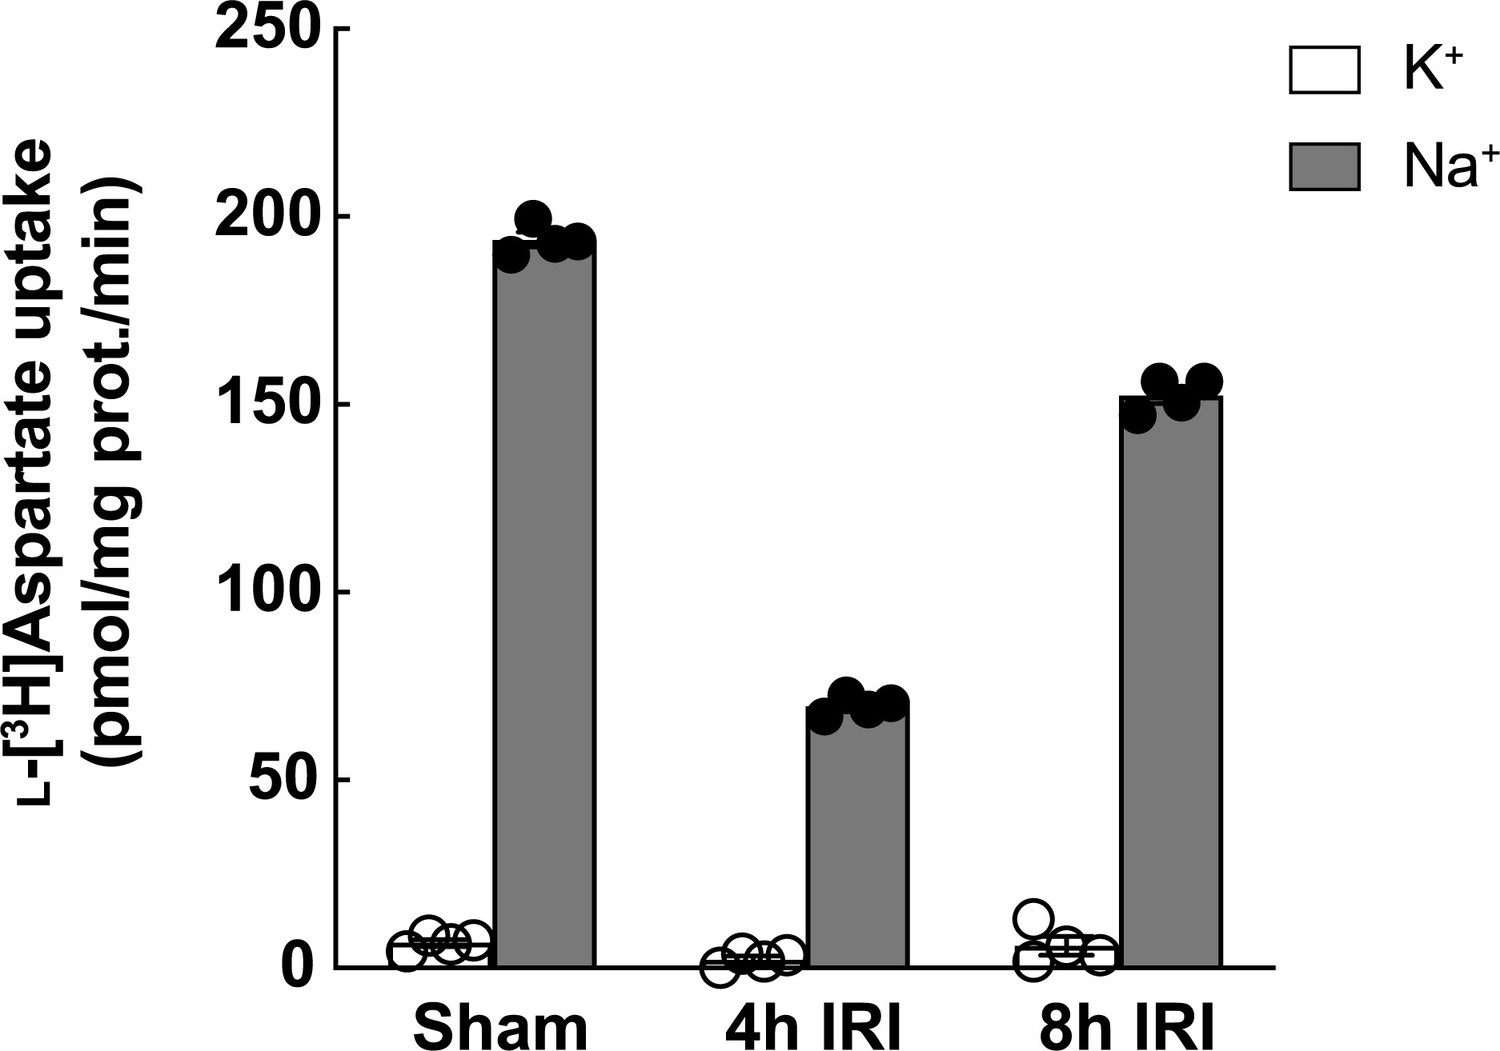
Functional l-aspartate transport in brush border membrane vesicles (BBMVs) from ischemia-reperfusion injury (IRI) model.
Function of l-aspartate transport, chiefly by excitatory amino acid transporter Slc1a1/Eaac1, in the IRI model was determined by l-[3H]aspartate transport. Uptake of 10 μM l-[3H]aspartate in renal BBMVs isolated from IRI model was measured for 1 min in Na+-free buffer (K+) or Na+-containing buffer (Na+). Bar graph = mean ± SEM; n=4.
Figure 8
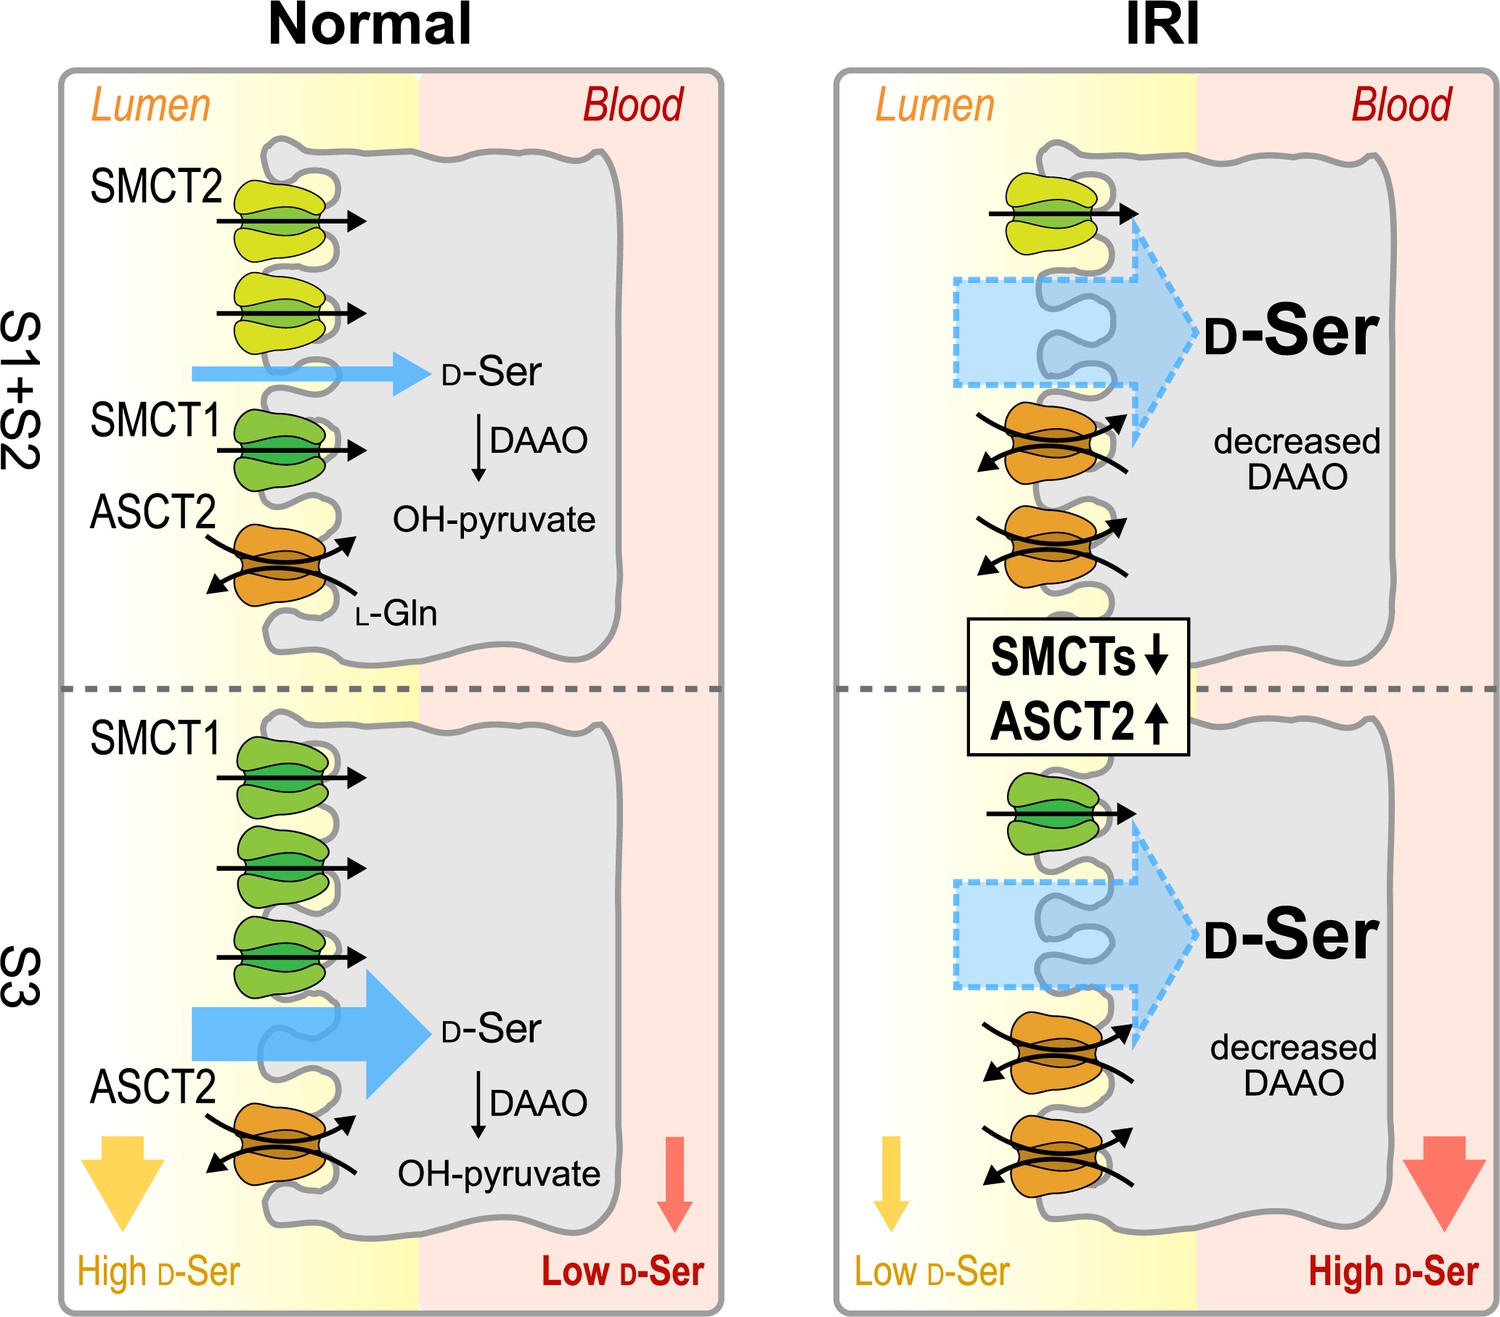
Proposed model of D-serine transport systems in renal proximal tubules.
The model summarizes the contributions of ASCT2, SMCT1, and SMCT2 to D-serine transport in renal proximal tubules. Left: The physiological conditions (normal kidney). SMCT2 at S1 + S2 segments and SMCT1 at segment S3 have high expression levels, whereas the expression of ASCT2 is low. The higher D-serine affinity of SMCT1 compared to SMCT2 supports that the D-serine reabsorption tends to be exceeded at the S3 segment. Right: The pathological conditions (ischemia-reperfusion injury [IRI] model). Expressions of SMCTs decrease while that of ASCT2 increases. ASCT2 expresses ubiquitously and exhibits high D-serine affinity. Blue arrows anticipate total D-serine fluxes in each proximal tubular segment. SMCT, sodium-coupled monocarboxylate transporter.
Author response image 1
Tables
Table 1
Candidate transporters from proteomics of the brush border membrane vesicles (BBMVs) from the ischemia-reperfusion injury (IRI) model.
The list is ordered according to the fold change.
| Transporters | Accession | log2 fold 4 hr IRI/ sham | p-Value of 4 hr IRI/ sham | log2 fold 8 hr IRI/ sham | p-Value of 8 hr IRI/ sham | Peptides | Score Mascot | Abundance in sham* |
|---|---|---|---|---|---|---|---|---|
| Increased | ||||||||
| Slc7a1/Cat1 | Q09143 | 0.8 | 0.12 | 1.3 | 0.01 | 1 | 131 | 2.6E+06 |
| Slc1a5/Asct2 | P51912 | 0.4 | 0.10 | 0.7 | 0.09 | 4 | 767 | 1.5E+07 |
| Decreased | ||||||||
| Slc36a1/Pat1 | Q8K4D3 | –1.2 | 0.08 | –1.0 | 0.12 | 3 | 103 | 5.4E+06 |
| Slc2a5/Glut5 | Q9WV38 | –1.2 | 0.01 | –0.8 | 0.04 | 2 | 1,140 | 6.5E+07 |
| Slco4c1/Oatp-m1 | Q8BGD4 | –1.1 | 0.00 | –0.9 | 0.00 | 9 | 4,011 | 1.5E+08 |
| Slc22a13/Oat10 | Q6A4L0 | –1.1 | 0.03 | –0.8 | 0.03 | 15 | 5,948 | 5.6E+08 |
| Slc22a7/Oat2 | Q91WU2 | –0.9 | 0.00 | –0.6 | 0.02 | 13 | 6,100 | 4.3E+08 |
| Slc6a18/B0at3 | O88576 | –0.8 | 0.17 | –0.6 | 0.25 | 11 | 4,310 | 2.1E+08 |
| Slc5a8/Smct1 | Q8BYF6 | –0.8 | 0.05 | –0.7 | 0.02 | 25 | 26,044 | 2.9E+09 |
| Slc15a2/Pept2 | Q9ES07 | –0.7 | 0.01 | –1.1 | 0.05 | 9 | 2,379 | 4.6E+07 |
| Slc5a12/Smct2 | Q49B93 | –0.6 | 0.01 | –0.9 | 0.01 | 12 | 4,725 | 1.6E+08 |
| TMEM27/ Collectrin† | Q9ESG4 | –0.4 | 0.01 | –0.1 | 0.17 | 9 | 23,686 | 3.3E+09 |
-
*
Median from n=3.
-
†
Collectrin is a regulatory protein for B0at3 function.
Author response table 1
| Transport systems | Normal condition | IRI | ||
|---|---|---|---|---|
| L-serine | D-serine | L-serine | D-serine | |
| SMCTs | - | + | - | - |
| ASCT2 | ++ | + | +++ | ++ |
| B^(0)ATs | ++++++ | (-?) | +++ | (-?) |
| DAAO | Degrade D- serine | No additional role |
Additional files
-
Supplementary file 1
Proteomics of brush border membrane vesicles (BBMVs) from the ischemia-reperfusion injury (IRI) model.
- https://cdn.elifesciences.org/articles/92615/elife-92615-supp1-v1.xlsx
-
Supplementary file 2
Annotation of membrane transport proteins from brush border membrane vesicle (BBMV) proteomics.
- https://cdn.elifesciences.org/articles/92615/elife-92615-supp2-v1.xlsx
-
Supplementary file 3
Proteomics of HEK293 membrane.
- https://cdn.elifesciences.org/articles/92615/elife-92615-supp3-v1.xlsx
-
MDAR checklist
- https://cdn.elifesciences.org/articles/92615/elife-92615-mdarchecklist1-v1.pdf
Download links
A two-part list of links to download the article, or parts of the article, in various formats.
Downloads (link to download the article as PDF)
Open citations (links to open the citations from this article in various online reference manager services)
Cite this article (links to download the citations from this article in formats compatible with various reference manager tools)
A multi-hierarchical approach reveals d-serine as a hidden substrate of sodium-coupled monocarboxylate transporters
eLife 12:RP92615.
https://doi.org/10.7554/eLife.92615.3


