A translation proofreader of archaeal origin imparts multi-aldehyde stress tolerance to land plants
- CSIR–Centre for Cellular and Molecular Biology, India
- Academy of Scientific and Innovative Research (AcSIR), CSIR–CCMB Campus, India
- Academy of Scientific and Innovative Research (AcSIR), India
Figures
Figure 1 with 1 supplement
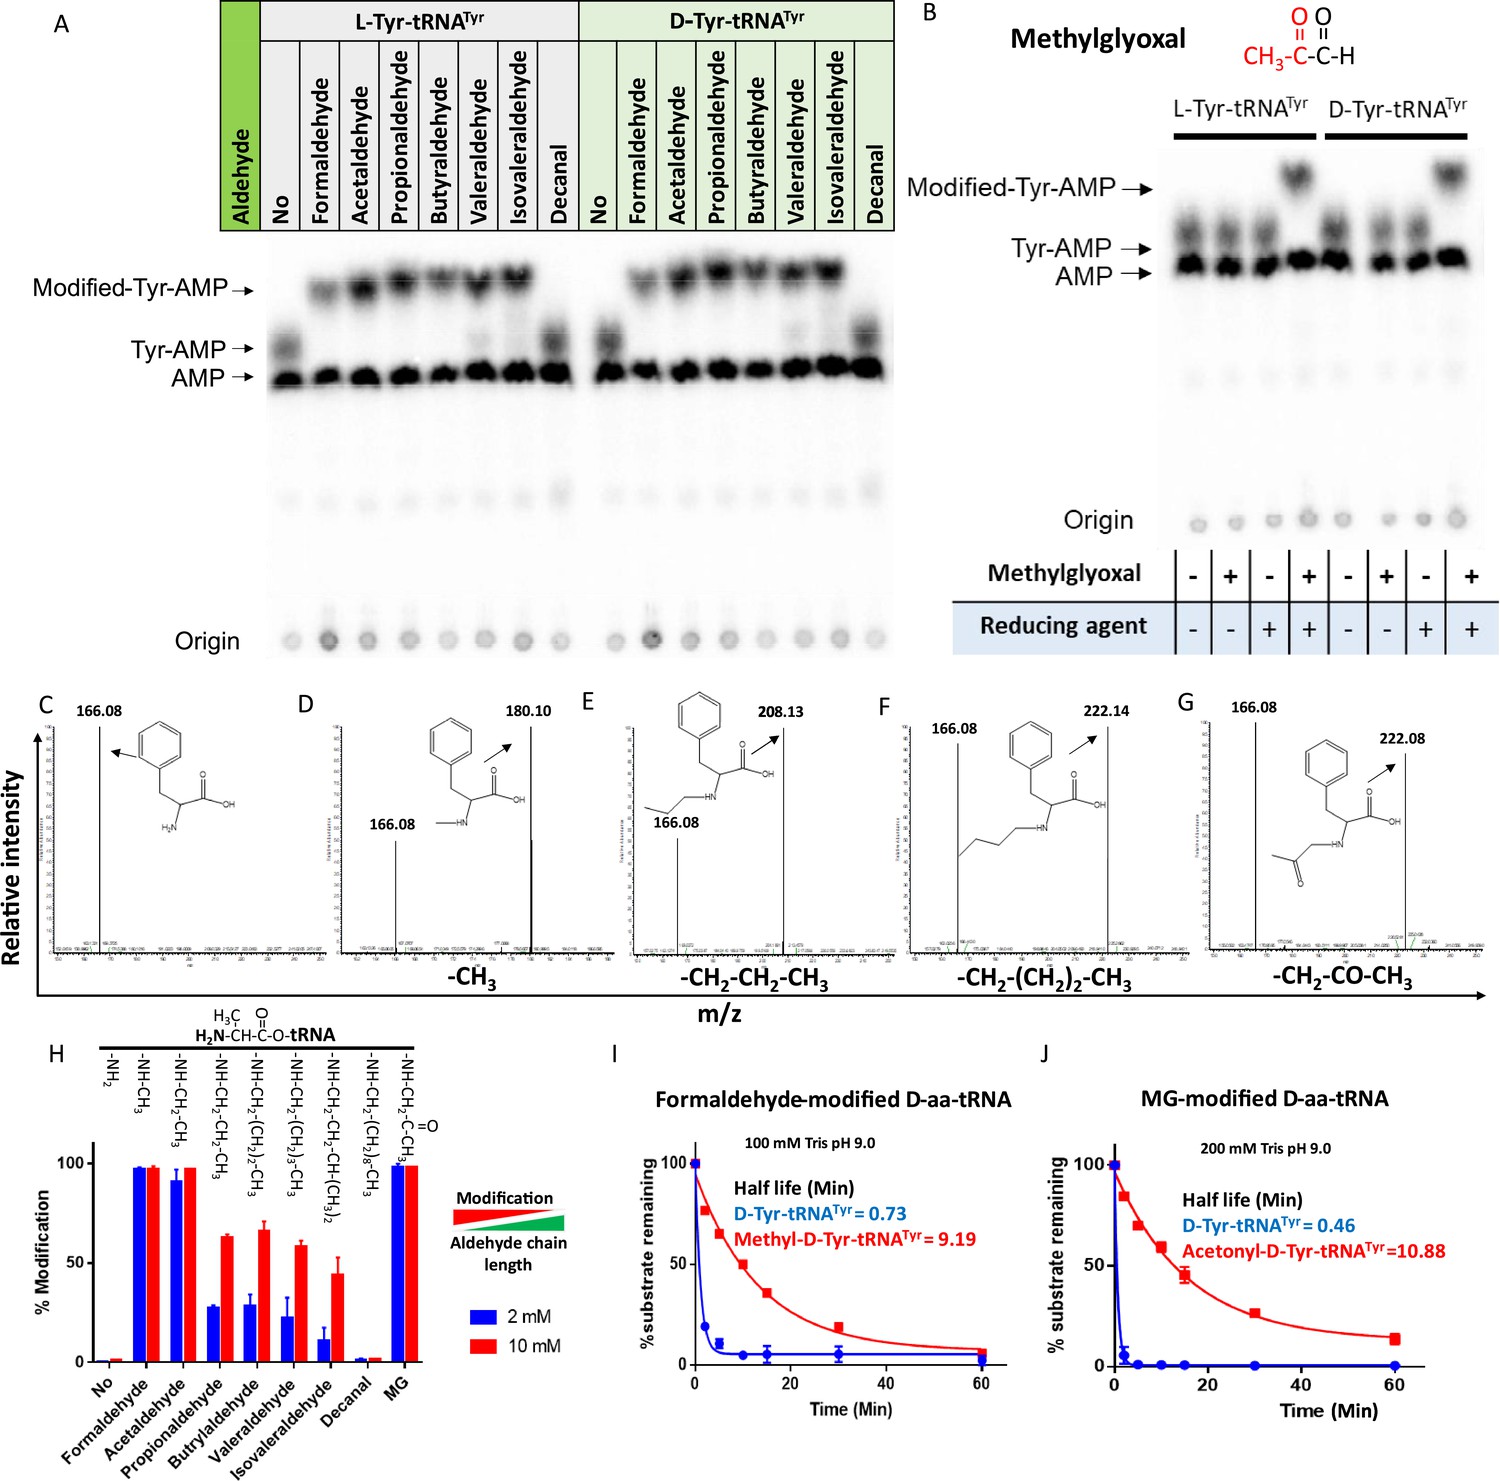
Aldehydes generate N-alkylated-aa-tRNA adducts.
Thin-layer chromatography (TLC) showing modification on L- and D-Tyr-tRNATyr by (A) formaldehyde, acetaldehyde, propionaldehyde, butyraldehyde, valeraldehyde, isovaleraldehyde, decanal and (B) MG (AMP: adenine monophosphate which corresponds to free tRNA, whereas Tyr-AMP and modified-Tyr-AMP correspond to unmodified and modified Tyr-tRNATyr). These modifications were generated by incubating 2 µM aa-tRNA with 100 mM of respective aldehydes along with 20 mM sodium cyanoborohydride (in 100 mM potassium acetate [pH 5.4]) as a reducing agent at 37°C for 30 min. Mass spectra showing (C) D-Phe-tRNAPhe, (D) formaldehyde-modified D-Phe-tRNAPhe, (E) propionaldehyde-modified D-Phe-tRNAPhe, (F) butyraldehyde-modified D-Phe-tRNAPhe, (G) MG-modified D-Phe-tRNAPhe. (H) Graph showing the effect of increasing chain length of aldehyde on modification propensity with aa-tRNA at two different concentrations of various aldehydes (n=3). Effect of (I) formaldehyde and (J) MG modification on stability of ester linkage in D-aminoacyl-tRNA (D-aa-tRNA) under alkaline conditions (n=3).
-
Figure 1—source data 1
Biochemical data for the modification susceptibility of L-Ala-tRNAAla by multiple aldehydes and stability of formaldehyde- and MG-modified and unmodified D-Tyr-tRNATyr substrates under alkaline conditions.
- https://cdn.elifesciences.org/articles/92827/elife-92827-fig1-data1-v1.xlsx
-
Figure 1—source data 2
Table showing the expected and observed mass change upon aldehyde modification on D-Phe-tRNAPhe by electrospray ionisation mass spectrometry (ESI-MS)/MS.
- https://cdn.elifesciences.org/articles/92827/elife-92827-fig1-data2-v1.xlsx
Figure 1—figure supplement 1
Aldehydes modify the amino group of amino acids in D-aminoacyl-tRNAs (D-aa-tRNAs).
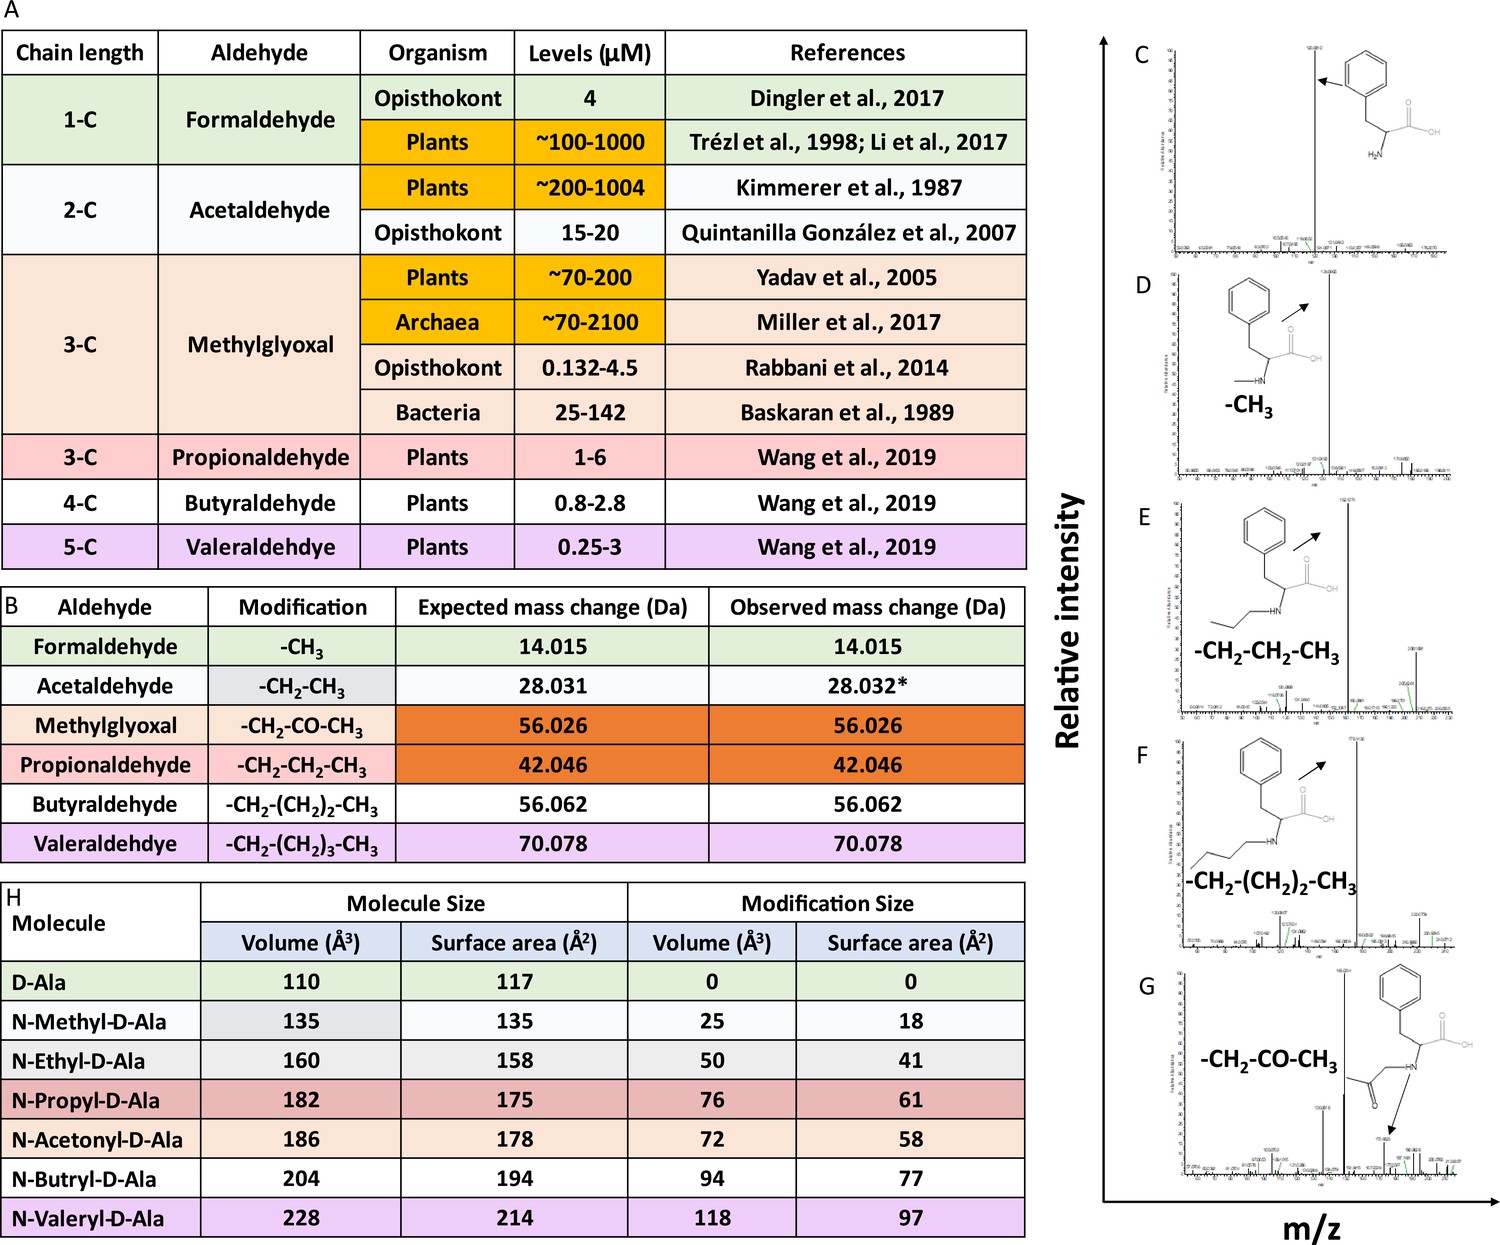
(A) Table showing the presence of various aldehydes in different domains of life (Trézl et al., 1998; Miller et al., 2017; Dingler et al., 2020; Li et al., 2017; Kimmerer and Macdonald, 1987; Quintanilla et al., 2007; Yadav et al., 2005; Rabbani and Thornalley, 2014; Wang et al., 2019). (B) Table showing modification type, expected and observed mass change by different aldehyde on D-aa-tRNA. *Mass change observed after acetaldehyde treatment in earlier study (Mazeed et al., 2021). Tandem fragmentation mass spectra (MS2) showing modification on the amino group of amino acid in (C) D-Phe-tRNAPhe, (D) formaldehyde-modified D-Phe-tRNAPhe, (E) propionaldehyde-modified D-Phe-tRNAPhe, (F) butyraldehyde-modified D-Phe-tRNAPhe, and (G) MG-modified D-Phe-tRNAPhe. (H) Table showing the calculated molecular size and modification size (both volume Å3 and surface area Å2) by various aldehydes on D-amino acid (D-alanine) using the Voss Volume Voxelator (3V) webserver at probe 1.5 Å radius.
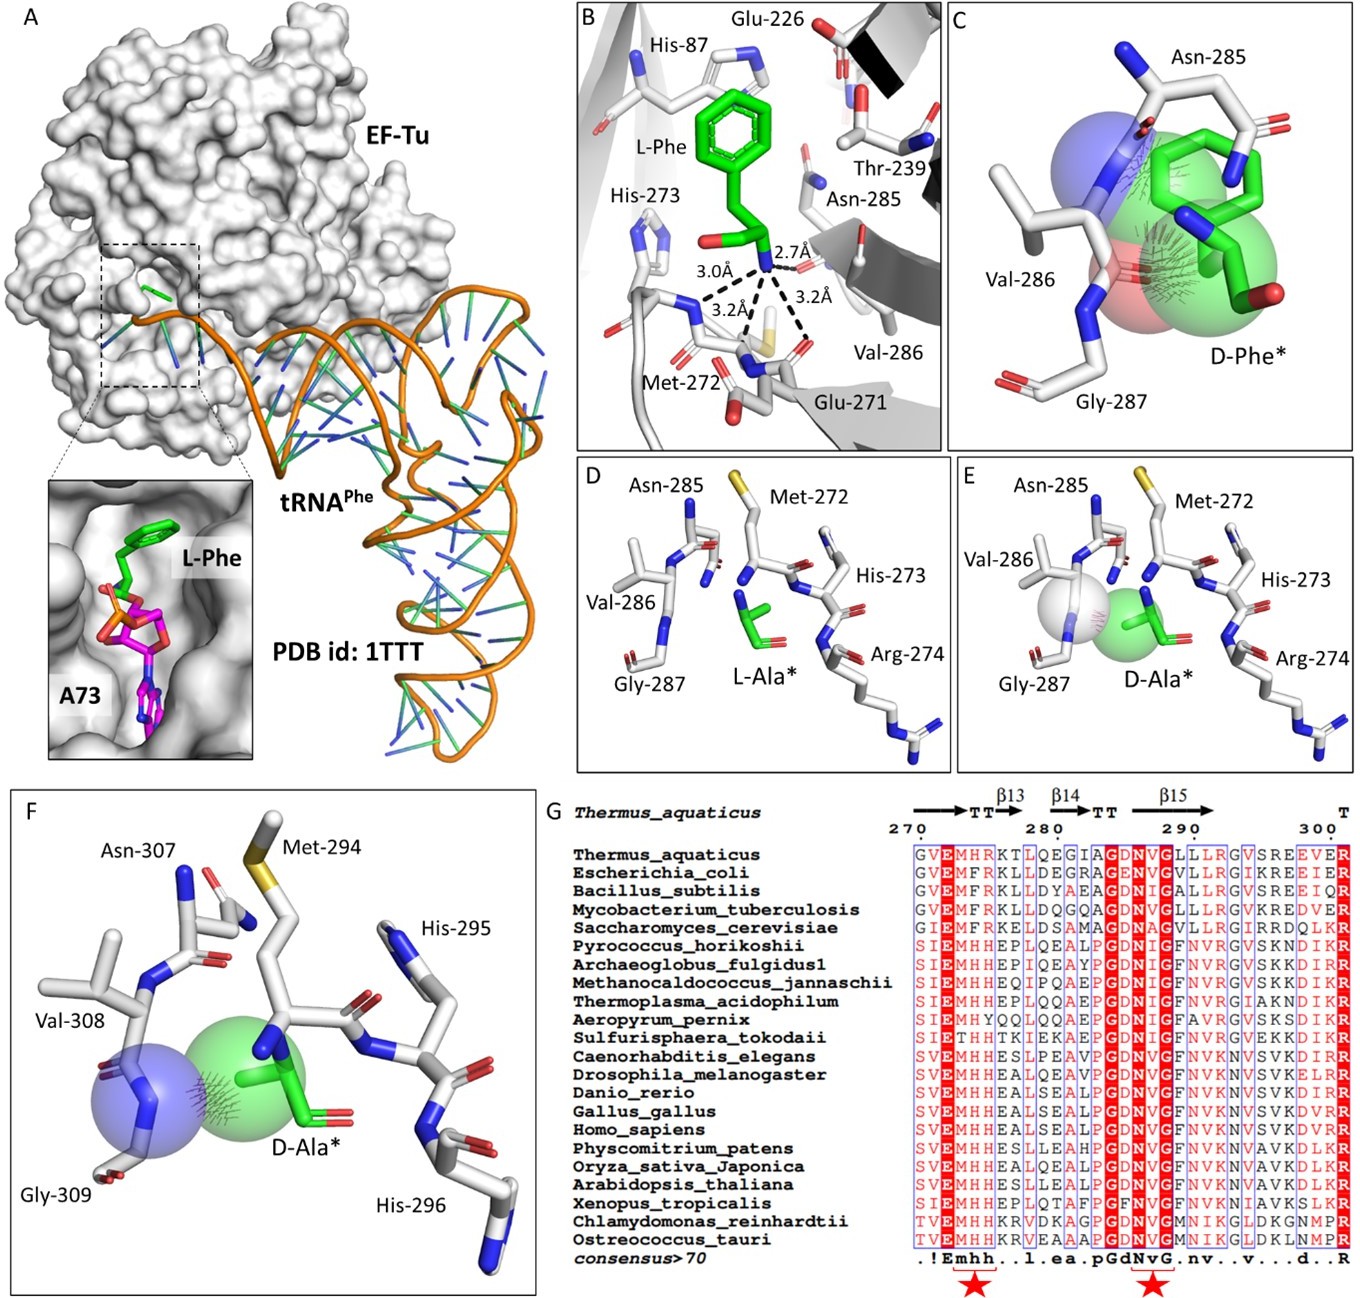
Figure 2 with 1 supplement
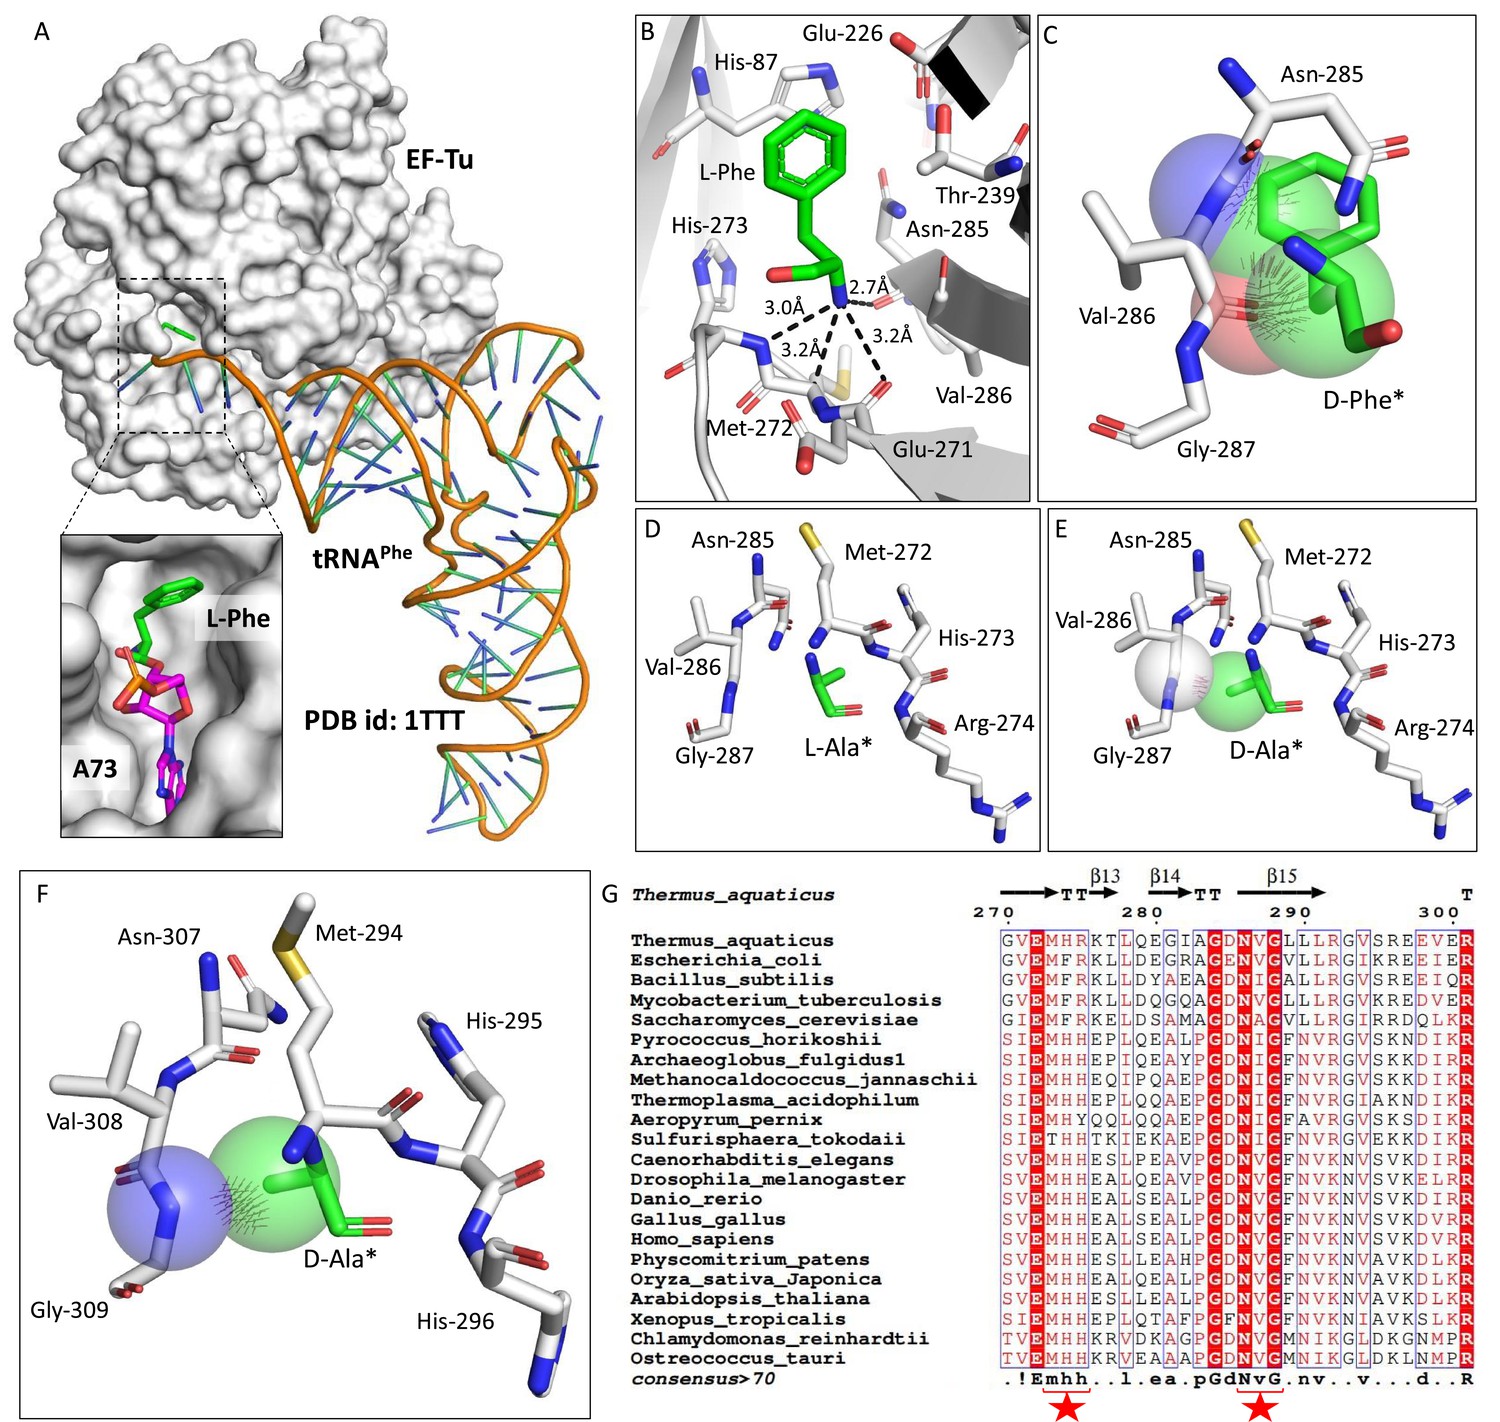
Elongation factor enantioselects aa-tRNAs through D-chiral rejection mechanism.
(A) Surface representation showing the cocrystal structure of elongation factor thermo unstable (EF-Tu) with L-Phe-tRNAPhe. Zoomed-in image showing the binding of L-phenylalanine with side chain projected outside of binding site of EF-Tu (PDB id: 1TTT). (B) Zoomed-in image of amino acid binding site of EF-Tu bound with L-phenylalanine showing the selection of amino group of amino acid through main chain atoms (PDB id: 1TTT). (C) Modelling of D-phenylalanine in the amino acid binding site of EF-Tu shows severe clashes with main chain atoms of EF-Tu. Modelling of smallest chiral amino acid, alanine, in the amino acid binding site of EF-Tu shows (D) no clashes with L-alanine and (E) clashes with D-alanine. (F) Modelling of D-alanine in the amino acid binding site of eEF-1A shows clashes with main chain atoms. (*Represents modelled molecule.) (G) Structure-based sequence alignment of elongation factor from bacteria, archaea, and eukaryotes (both plants and animals) showing conserved amino acid binding site residues. (Key residues are marked with red star.)
Figure 2—figure supplement 1
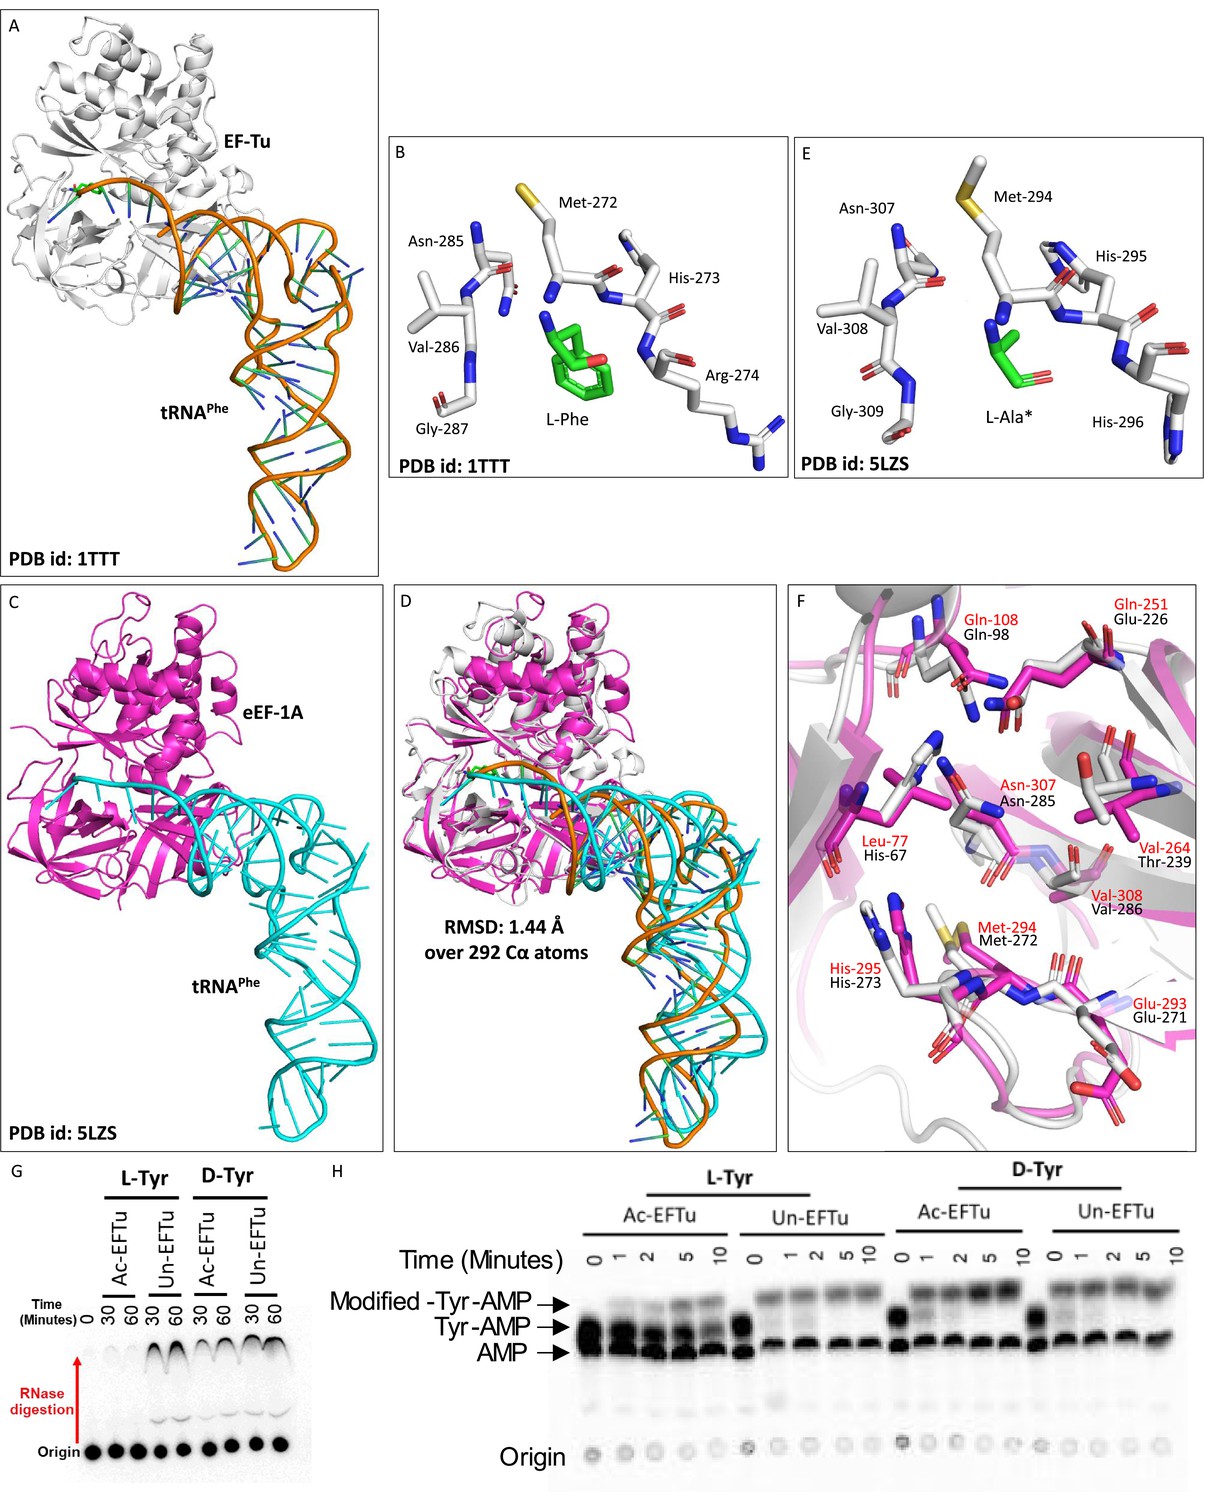
Elongation factor protects L-aa-tRNAs from aldehyde modification.
(A) Cartoon representation showing the cocrystal structure of elongation factor thermo unstable (EF-Tu) with L-Phe-tRNAPhe (PDB id: 1TTT). (B) Zoomed-in image of amino acid binding site of EF-Tu bound with L-phenylalanine (PDB id: 1TTT). (C) Cartoon representation showing the cryoEM structure of eEF-1A with tRNAPhe (PDB id: 5LZS). (D) Image showing the overlap of EF-Tu:L-Phe-tRNAPhe crystal structure and eEF-1A:tRNAPhe cryoEM structure (r.m.s.d. of 1.44 Å over 292 Cα atoms). (E) Zoomed-in image of amino acid binding site of eEF-1A with modelled L-alanine (PDB id: 5ZLS). (*Modelled.) (F) Overlap showing the amino acid binding site residues of EF-Tu and eEF-1A. (EF-Tu residues are marked in black and eEF-1A residues are marked in red.) (G) Thin-layer chromatography showing the activation profile of EF-Tu via RNase protection-based assay. (H) Thin-layer chromatography showing the formaldehyde modification on L-aminoacyl-tRNAs (L-aa-tRNAs) and D-aminoacyl-tRNAs (D-aa-tRNAs) in the presence of EF-Tu.
Figure 3 with 2 supplements
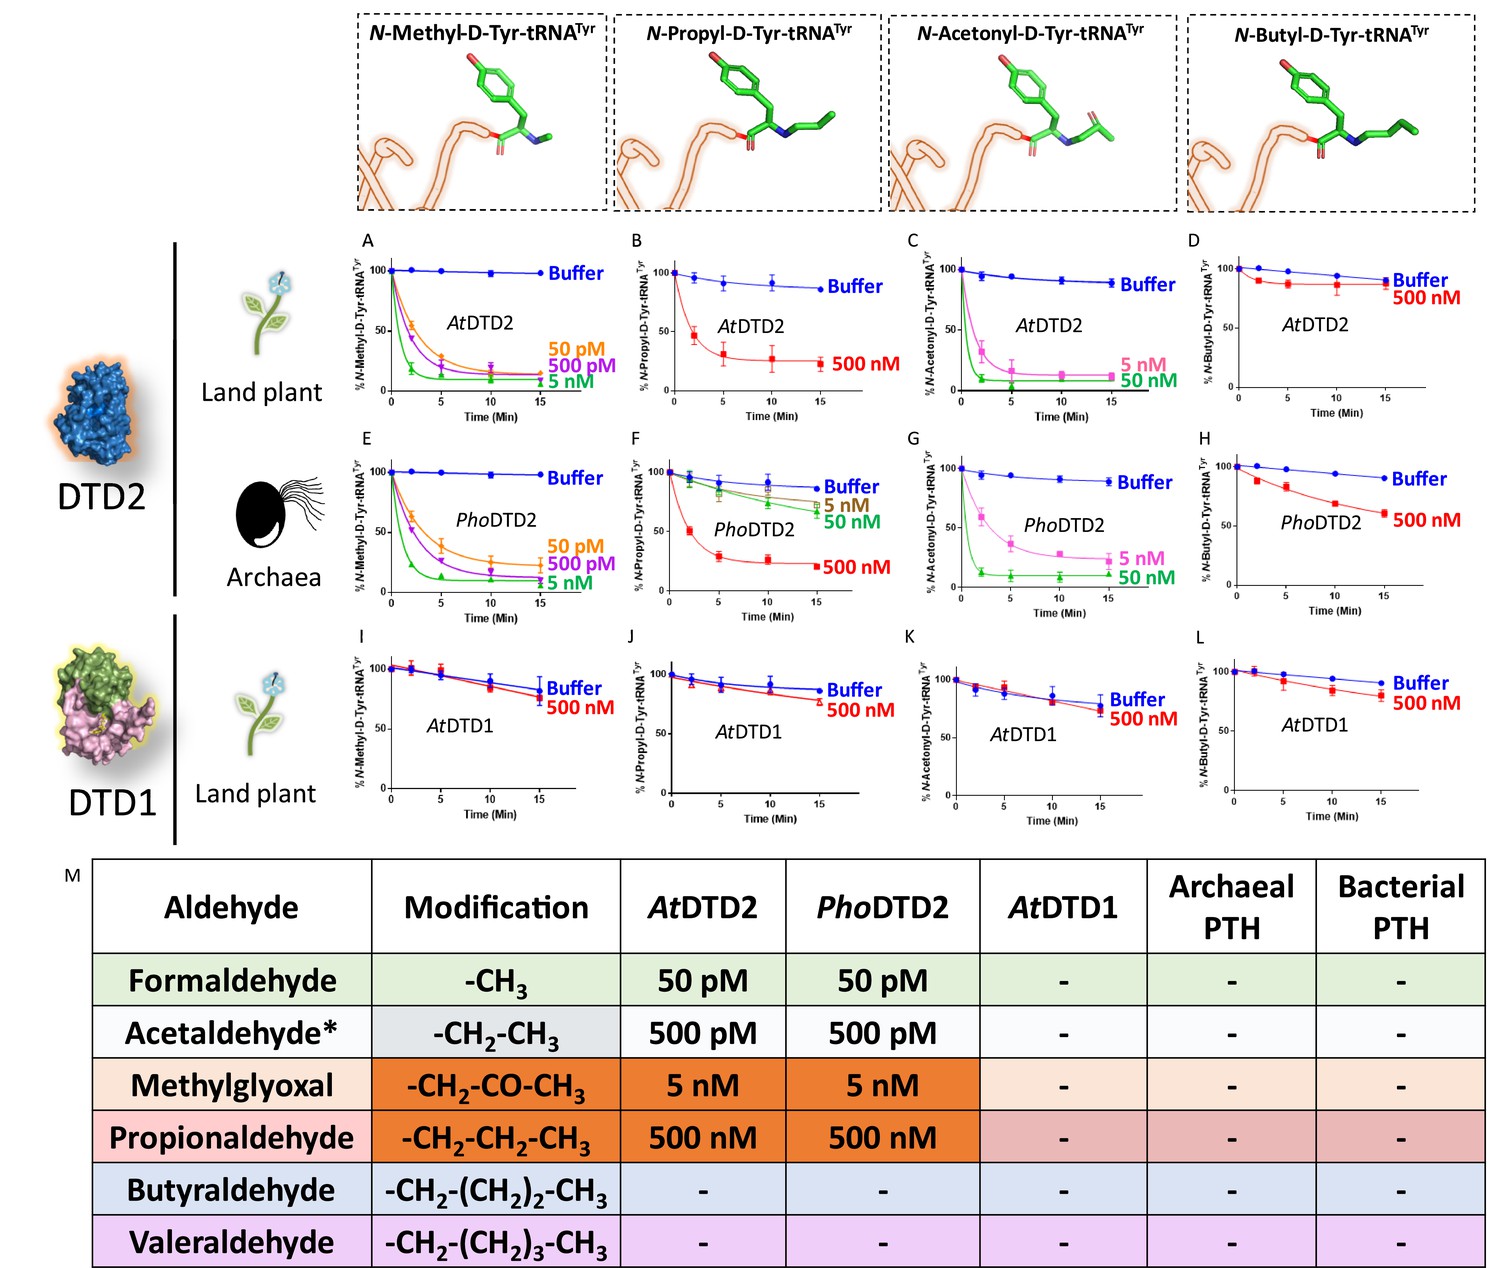
D-aminoacyl-tRNA deacylase2 (DTD2) acts as a general aldehyde detoxification system.
Deacylation assays on formaldehyde-, propionaldehyde-, methylglyoxal-, and butyraldehyde-modified D-Tyr-tRNATyr substrates by AtDTD2 (A–D), PhoDTD2 (E–H), AtDTD1 (I–L) (n=3). (M) Table showing the effective activity concentration of AtDTD2, PhoDTD2, AtDTD1, archaeal peptidyl-tRNA hydrolase (PTH), and bacterial PTH that completely deacylates aldehyde-modified D-Tyr-tRNATyr (‘-’ denotes no activity; *from Mazeed et al., 2021).
-
Figure 3—source data 1
Biochemical data for deacylations of formaldehyde-, propionaldehyde-, MG-, and butyraldehyde-modified D-Tyr-tRNATyr substrates by D-aminoacyl-tRNA deacylase1 (DTD1) and DTD2.
- https://cdn.elifesciences.org/articles/92827/elife-92827-fig3-data1-v1.xlsx
-
Figure 3—source data 2
Biochemical data for deacylations of valeraldehyde- and isovaleraldehyde-modified D-Tyr-tRNATyr substrates by D-aminoacyl-tRNA deacylase1 (DTD1) and DTD2.
- https://cdn.elifesciences.org/articles/92827/elife-92827-fig3-data2-v1.xlsx
-
Figure 3—source data 3
Biochemical data for deacylations of formaldehyde-, propionaldehyde-, MG-, butyraldehyde-, valeraldehyde-, and isovaleraldehyde-modified L-Tyr-tRNATyr substrates by D-aminoacyl-tRNA deacylase1 (DTD1), DTD2, peptidyl-tRNA hydrolase1 (PTH1) and PTH2.
- https://cdn.elifesciences.org/articles/92827/elife-92827-fig3-data3-v1.xlsx
Figure 3—figure supplement 1
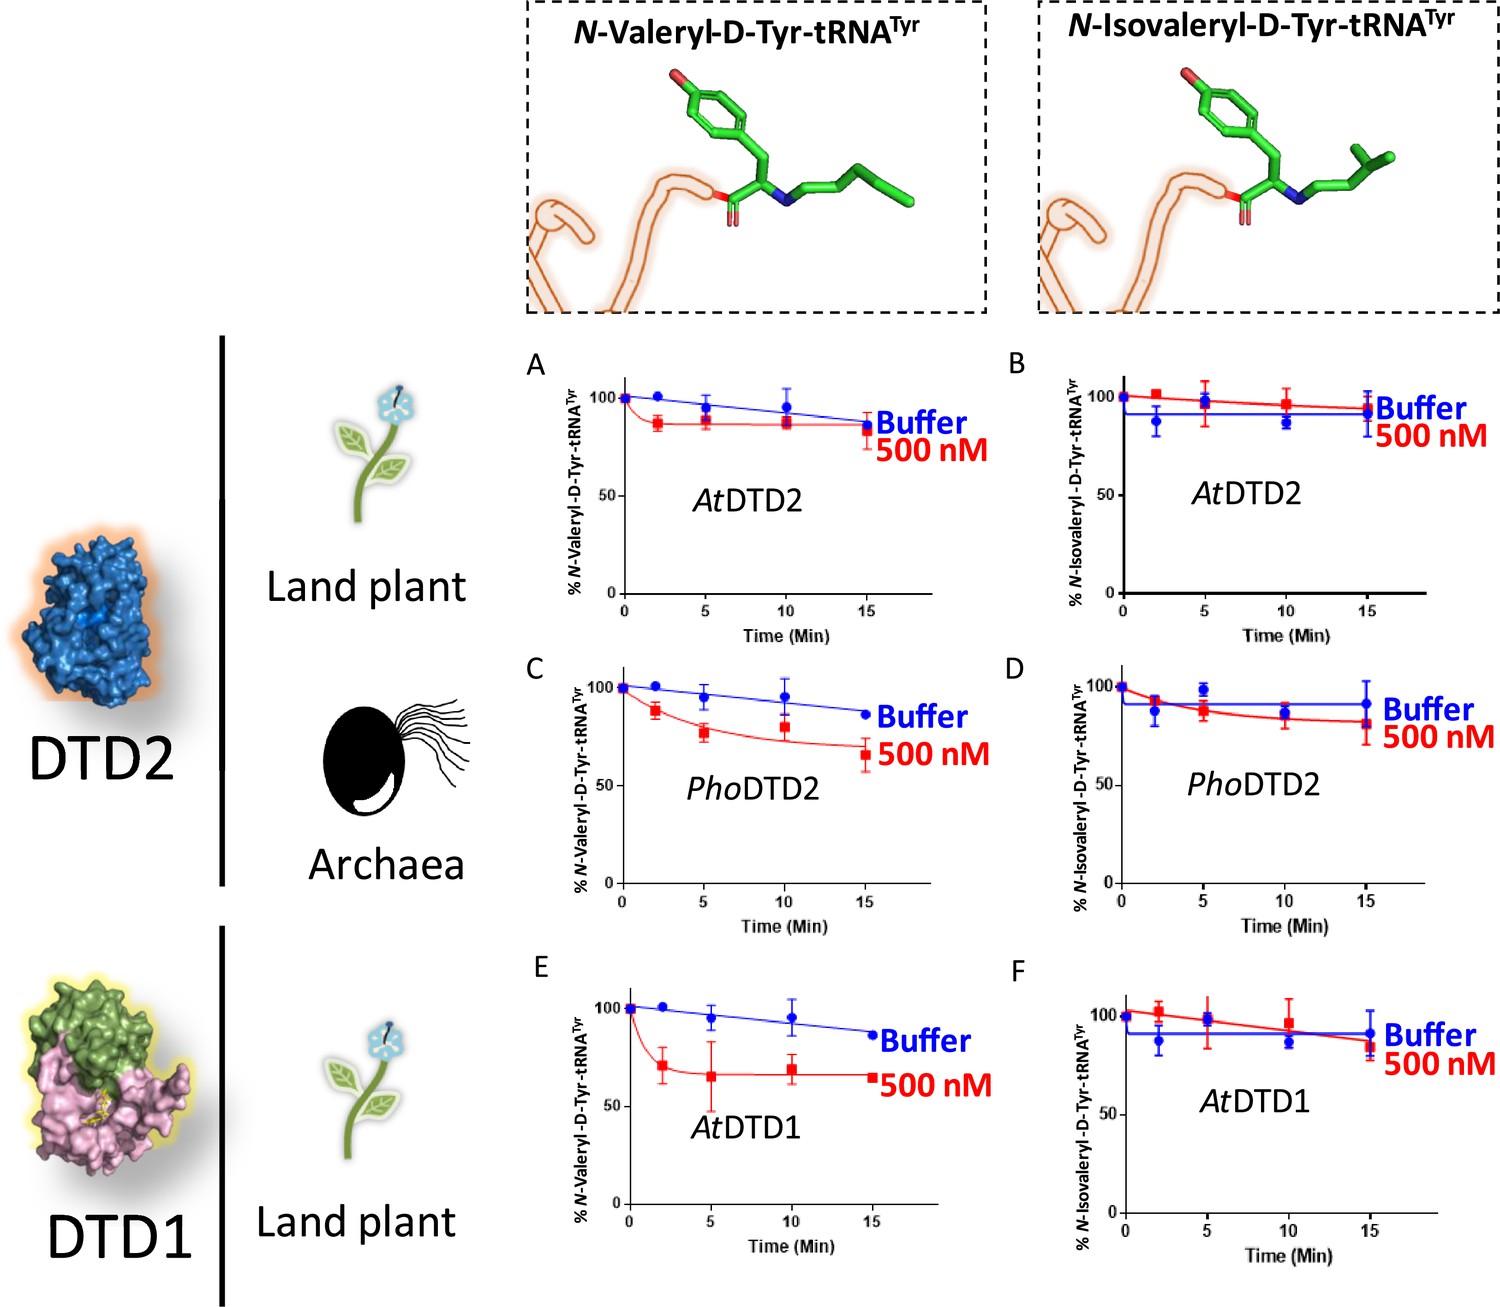
D-aminoacyl-tRNA deacylase2 (DTD2) is inactive on aldehyde-modified D-aminoacyl-tRNAs (D-aa-tRNAs) beyond three-carbon aldehyde chain length.
Deacylation assays of AtDTD2 on (A) valeraldehyde-, (B) isovaleraldehyde-modified D-Tyr-tRNATyr. Deacylation assays of PhoDTD2 on (C) valeraldehyde-, (D) isovaleraldehyde-modified D-Tyr-tRNATyr. Deacylation assays of AtDTD1 on (E) valeraldehyde-, (F) isovaleraldehyde-modified D-Tyr-tRNATyr (n=3).
Figure 3—figure supplement 2

D-aminoacyl-tRNA deacylase2 (DTD2) acts as a general aldehyde detoxification system.
Deacylation assays of AtDTD2 on (A) formaldehyde-, (B) propionaldehyde-, (C) MG-, (D) butyraldehyde-, (E) valeraldehyde-, and (F) isovaleraldehyde-modified L-Tyr-tRNATyr. Deacylation assays of PhoDTD2 on (G) formaldehyde-, (H) propionaldehyde-, (I) MG-, (J) butyraldehyde-, (K) valeraldehyde-, and (L) isovaleraldehyde-modified L-Tyr-tRNATyr. Deacylation assays of EcPTH on (M) formaldehyde- and (N) MG-modified L-Tyr-tRNATyr. Deacylation assays of StPTH on (O) formaldehyde- and (P) MG-modified L-Tyr-tRNATyr (n=3). (Q) Figure showing the difference in the position of carbonyl carbon in acetonyl and acetyl modification on aa-tRNAs.
Figure 4 with 2 supplements
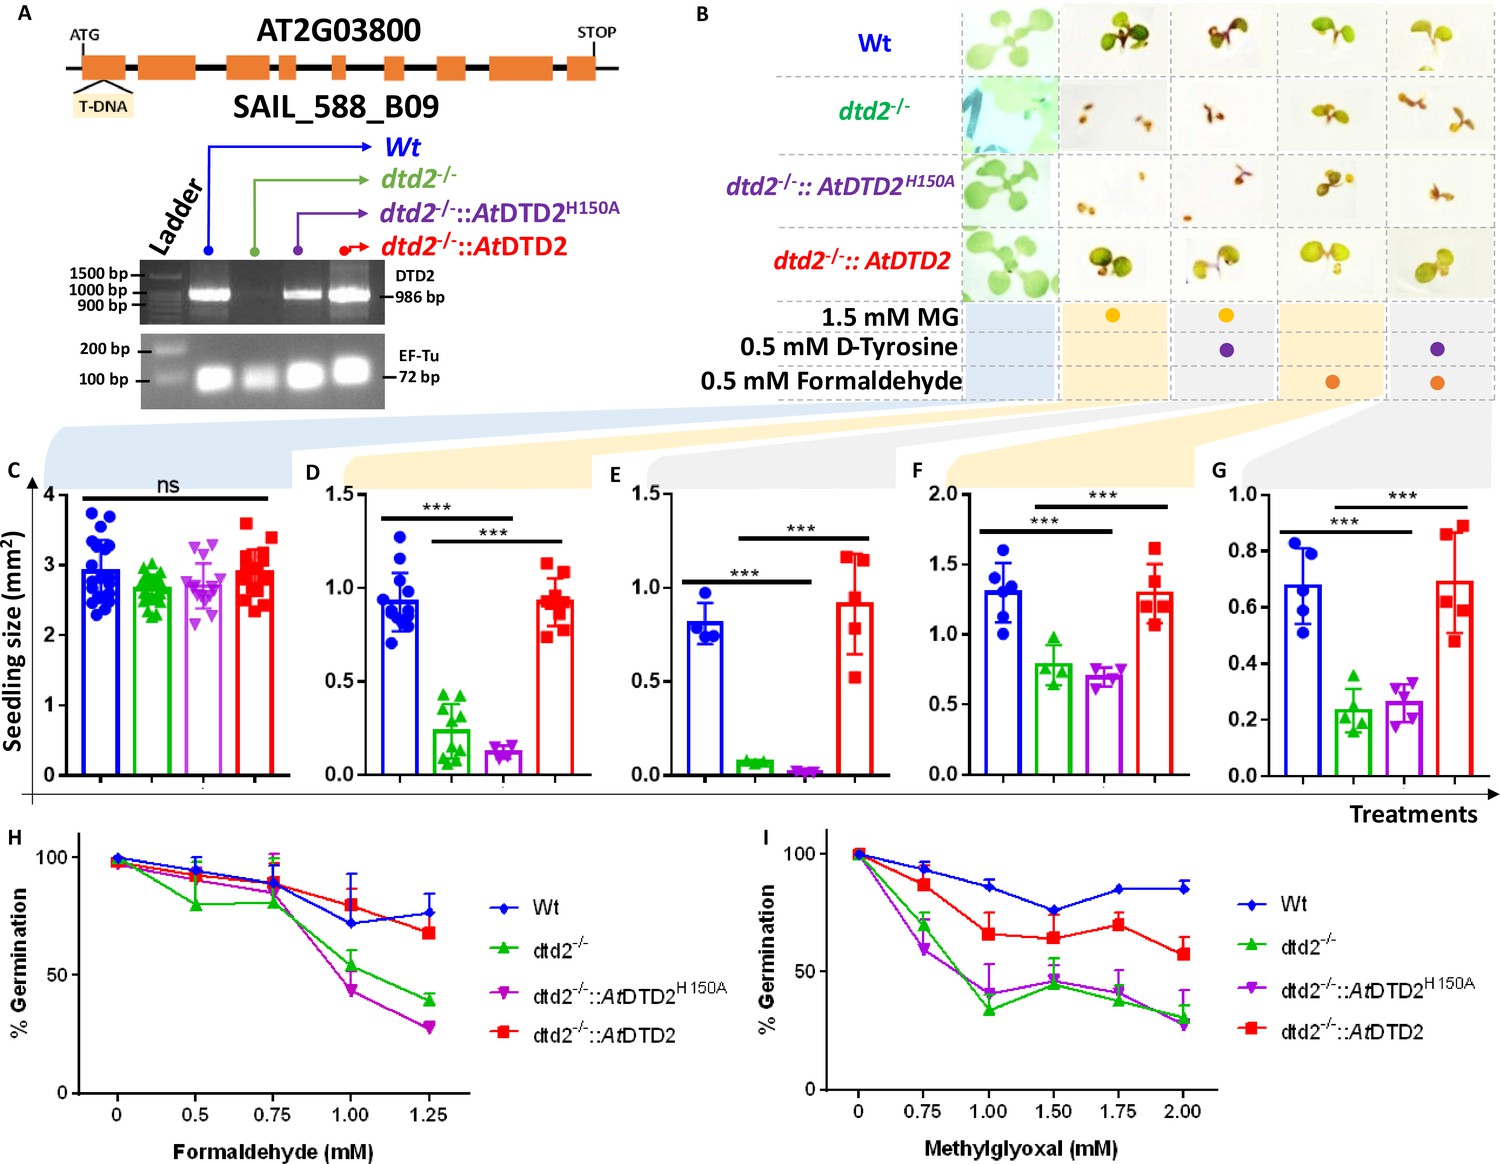
D-aminoacyl-tRNA deacylase2 (DTD2) mutant plants are susceptible to physiologically abundant toxic aldehydes.
(A) Schematics showing the site of T-DNA insertion in (SAIL_288_B09) the first exon of DTD2 gene and reverse transcriptase-polymerase chain reaction (RT-PCR) showing the expression of DTD2 gene in wild type (Wt), dtd2-/-, dtd2-/-::AtDTD2 (rescue), and dtd2-/-::AtDTD2 H150A (catalytic mutant) plant lines used in the study. (B) Toxicity assays showing the effect of formaldehyde and MG with and without D-amino acid (D-tyrosine [D-Tyr]) on dtd2-/- plants. Graph showing the effect of (C) Murashige and Skoog agar (MSA), (D) 1.5 mM MG, (E) 0.5 mM D-Tyr and 1.5 mM MG, (F) 0.5 mM formaldehyde, and (G) 0.5 mM D-Tyr and 0.5 mM formaldehyde on growth of Wt (Blue), dtd2-/- (Green), dtd2-/-::AtDTD2 H150A (catalytic mutant) (purple), and dtd2-/-::AtDTD2 (rescue) (red) plants. Cotyledon surface area (mm2) is plotted as parameter for seedling size (n=4–15). Ordinary one-way ANOVA test was used where p values higher than 0.05 are denoted as ns and p≤0.001 are denoted as ***. Graph showing the effect of (H) formaldehyde and (I) MG on germination of Wt, dtd2-/-, dtd2-/-::AtDTD2 (rescue), and dtd2-/-::AtDTD2 H150A (catalytic mutant) plants (n=3).
-
Figure 4—source data 1
Seedling surface area data and germination data for wild type (Wt), dtd2-/-, dtd2-/-::AtDTD2 (rescue), and dtd2-/-::AtDTD2 H150A (catalytic mutant) plants under formaldehyde and MG with and without D-amino acid treatments.
- https://cdn.elifesciences.org/articles/92827/elife-92827-fig4-data1-v1.xlsx
-
Figure 4—source data 2
Germination data for wild type (Wt), dtd2-/-, and dtd2-/-::AtDTD2 (rescue) plants under 1.5 mM MG with 0.5 mM D-tyrosine treatment.
- https://cdn.elifesciences.org/articles/92827/elife-92827-fig4-data2-v1.pdf
-
Figure 4—source data 3
Biochemical data for deacylations of acetaldehyde-modified D-Tyr-tRNATyr and L-Tyr-tRNATyr substrates by both wild type and catalytic mutant D-aminoacyl-tRNA deacylase2 (DTD2) proteins.
- https://cdn.elifesciences.org/articles/92827/elife-92827-fig4-data3-v1.xlsx
-
Figure 4—source data 4
Original files for reverse transcriptase-polymerase chain reaction (RT-PCR) analysis in Figure 4A.
- https://cdn.elifesciences.org/articles/92827/elife-92827-fig4-data4-v1.zip
Figure 4—figure supplement 1
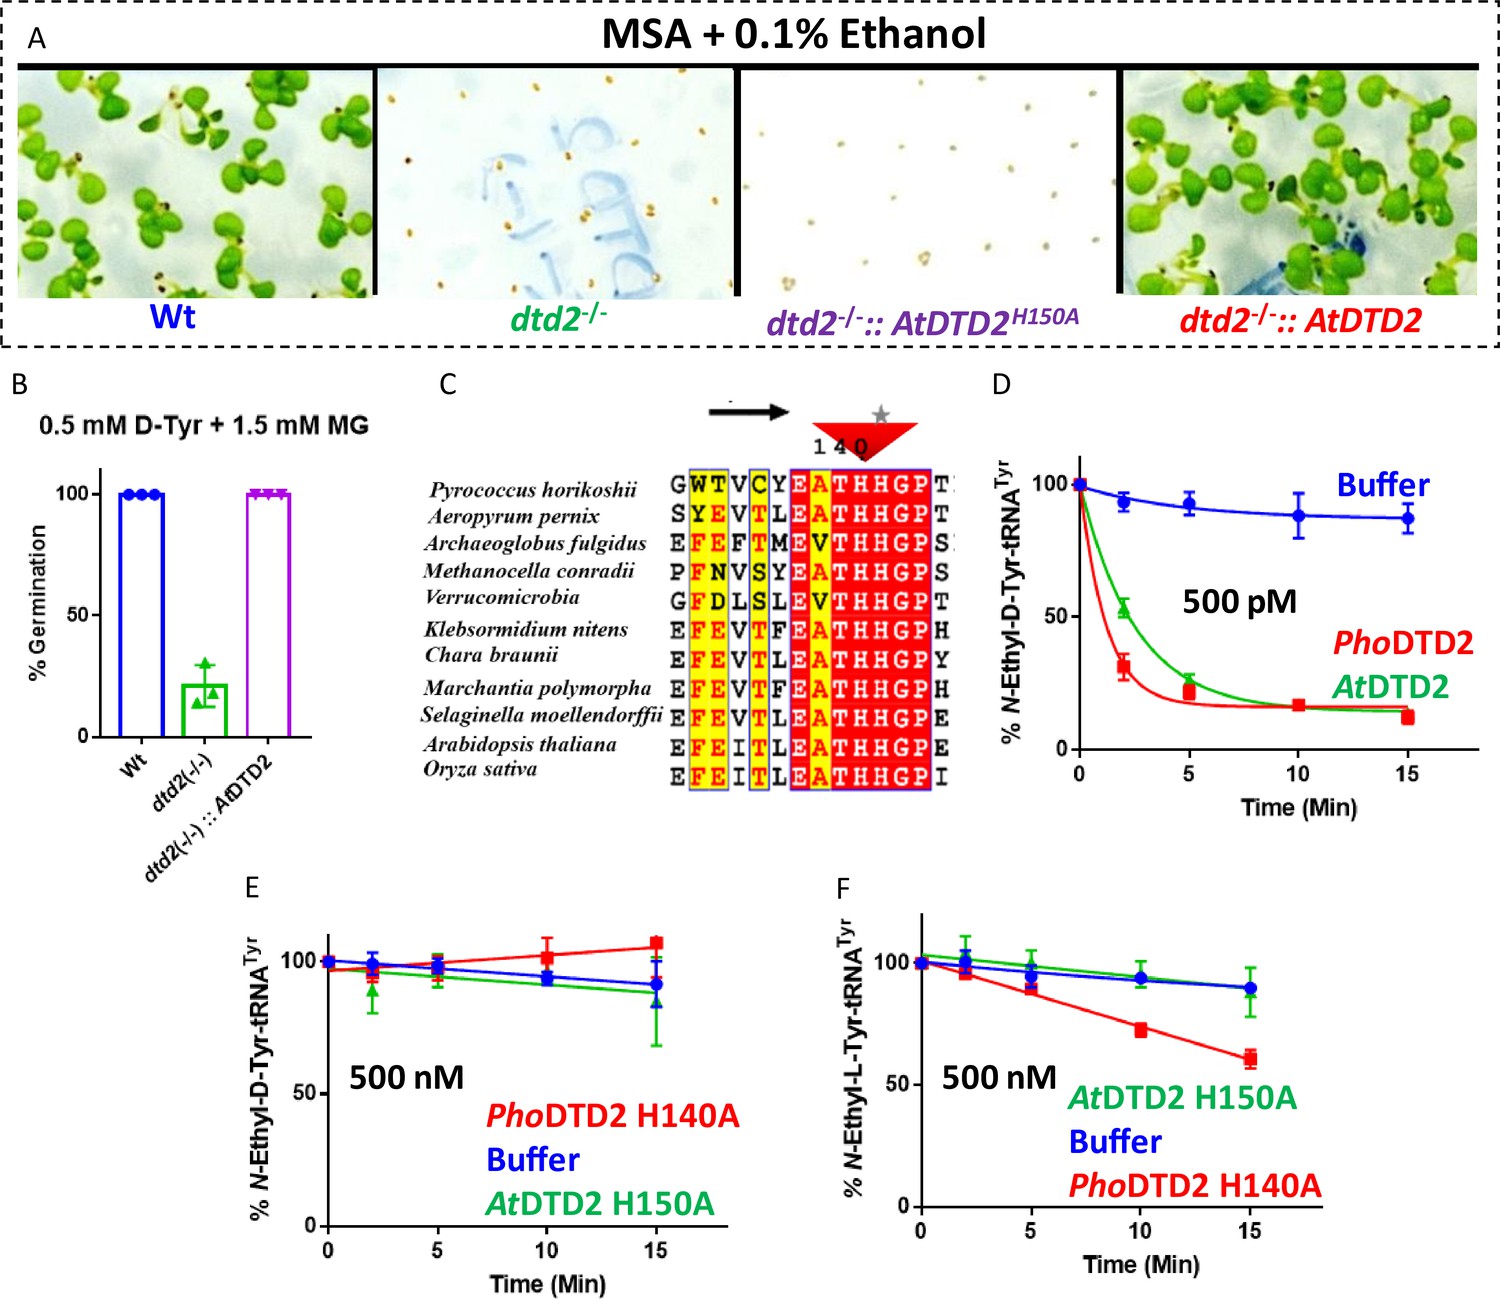
MG and formaldehyde inhibit the germination of D-aminoacyl-tRNA deacylase2 (DTD2) mutant plants.
(A) Toxicity assays showing the effect of 0.1% ethanol on wild type (Wt), dtd2-/-, dtd2-/-::AtDTD2 H150A (catalytic mutant), and dtd2-/-::AtDTD2 (rescue) plants. (B) Graph showing the cumulative effect of MG and D-tyrosine on germination of Col-0, dtd2 (-/-) and dtd2 (-/-)::AtDTD2 (rescue) plants (n=3). (C) Structure-based sequence alignment showing invariant catalytic histidine in evolutionarily distinct DTD2 sequences. Deacylation of (D) acetaldehyde-modified D-Tyr-tRNATyr with PhoDTD2 and AtDTD2. (E) PhoDTD2 H140A and AtDTD2 H150A (catalytic mutants) and (F) deacylation of acetaldehyde-modified L-Tyr-tRNATyr with PhoDTD2 H140A and AtDTD2 H150A (catalytic mutants) (n=3).
Figure 4—figure supplement 2
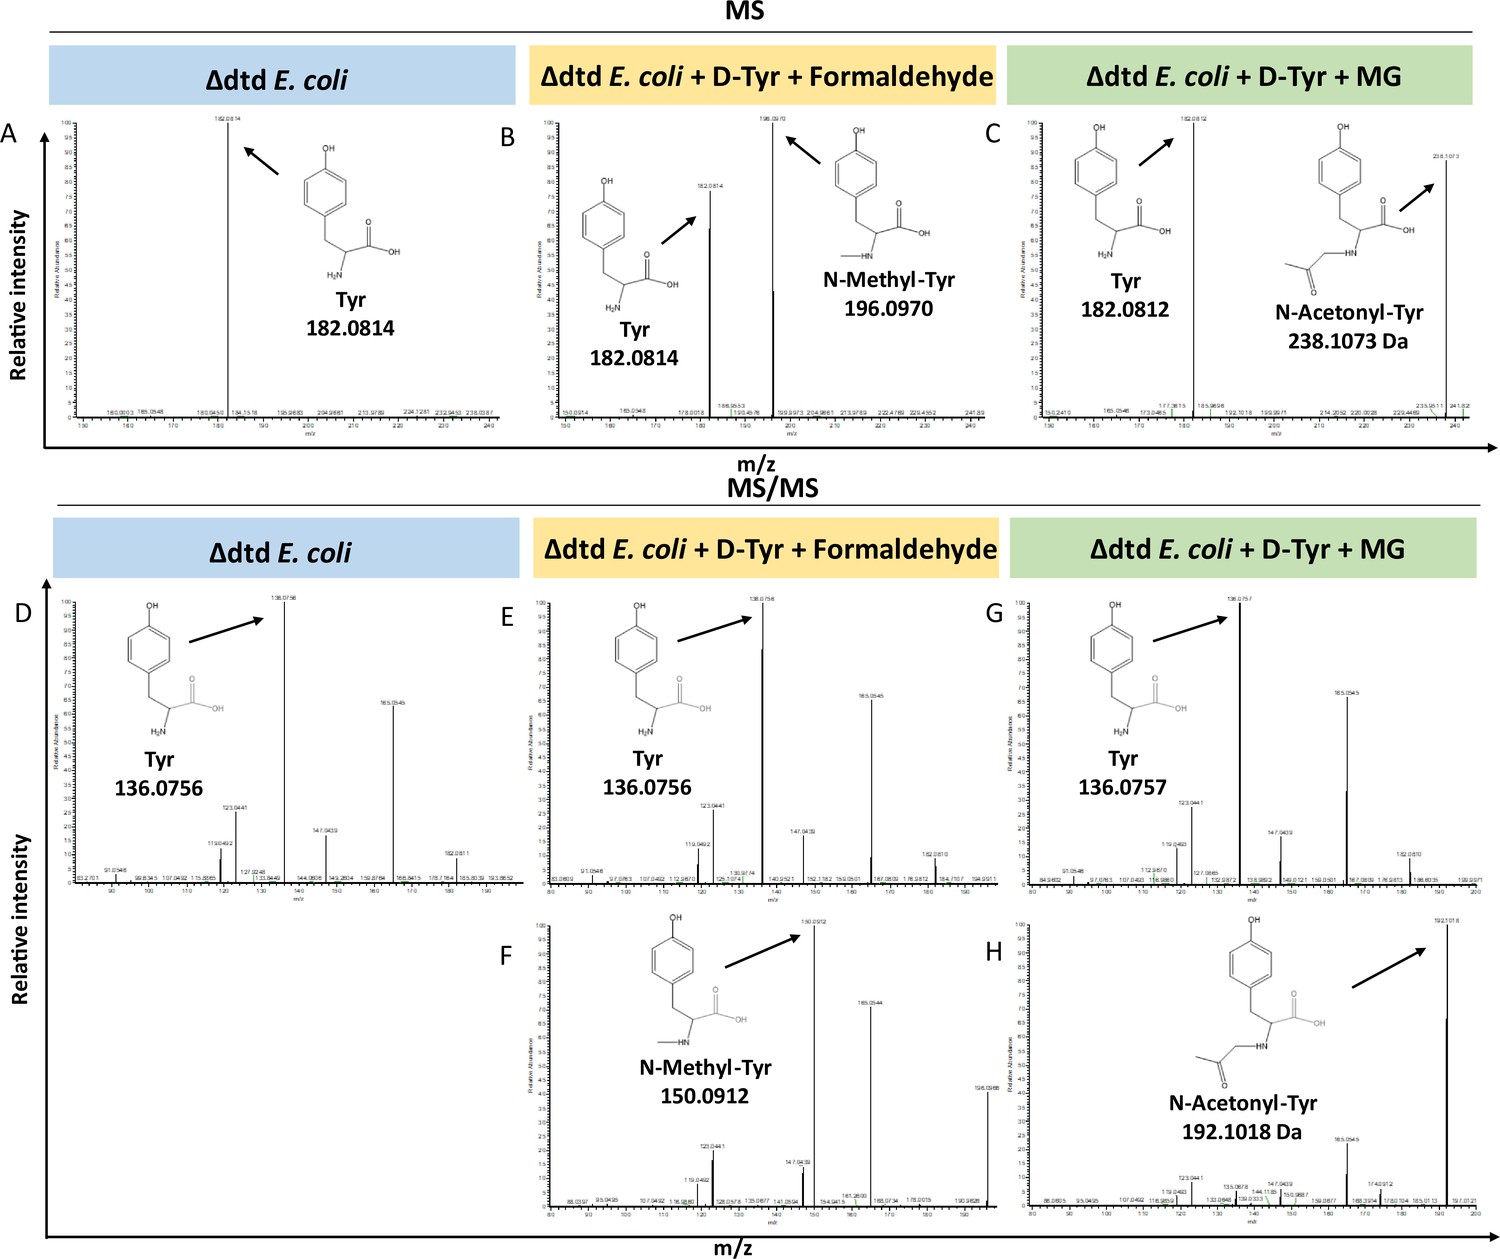
Loss of D-aminoacyl-tRNA deacylase (DTD) results in accumulation of modified D-aminoacyl adducts on tRNAs in E. coli.
Mass spectrometry analysis showing the accumulation of aldehyde-modified D-Tyr-tRNATyr in (A) Δdtd E. coli, (B) formaldehyde and D-tyrosine-treated Δdtd E. coli, and (C) MG and D-tyrosine-treated Δdtd E. coli. Electrospray ionisation mass spectrometry (ESI-MS)-based tandem fragmentation analysis for unmodified and aldehyde-modified D-Tyr-tRNATyr in (D) Δdtd E. coli, (E) and (F) formaldehyde and D-tyrosine-treated Δdtd E. coli, (G) and (H) MG and D-tyrosine-treated Δdtd E. coli.
Figure 5 with 1 supplement
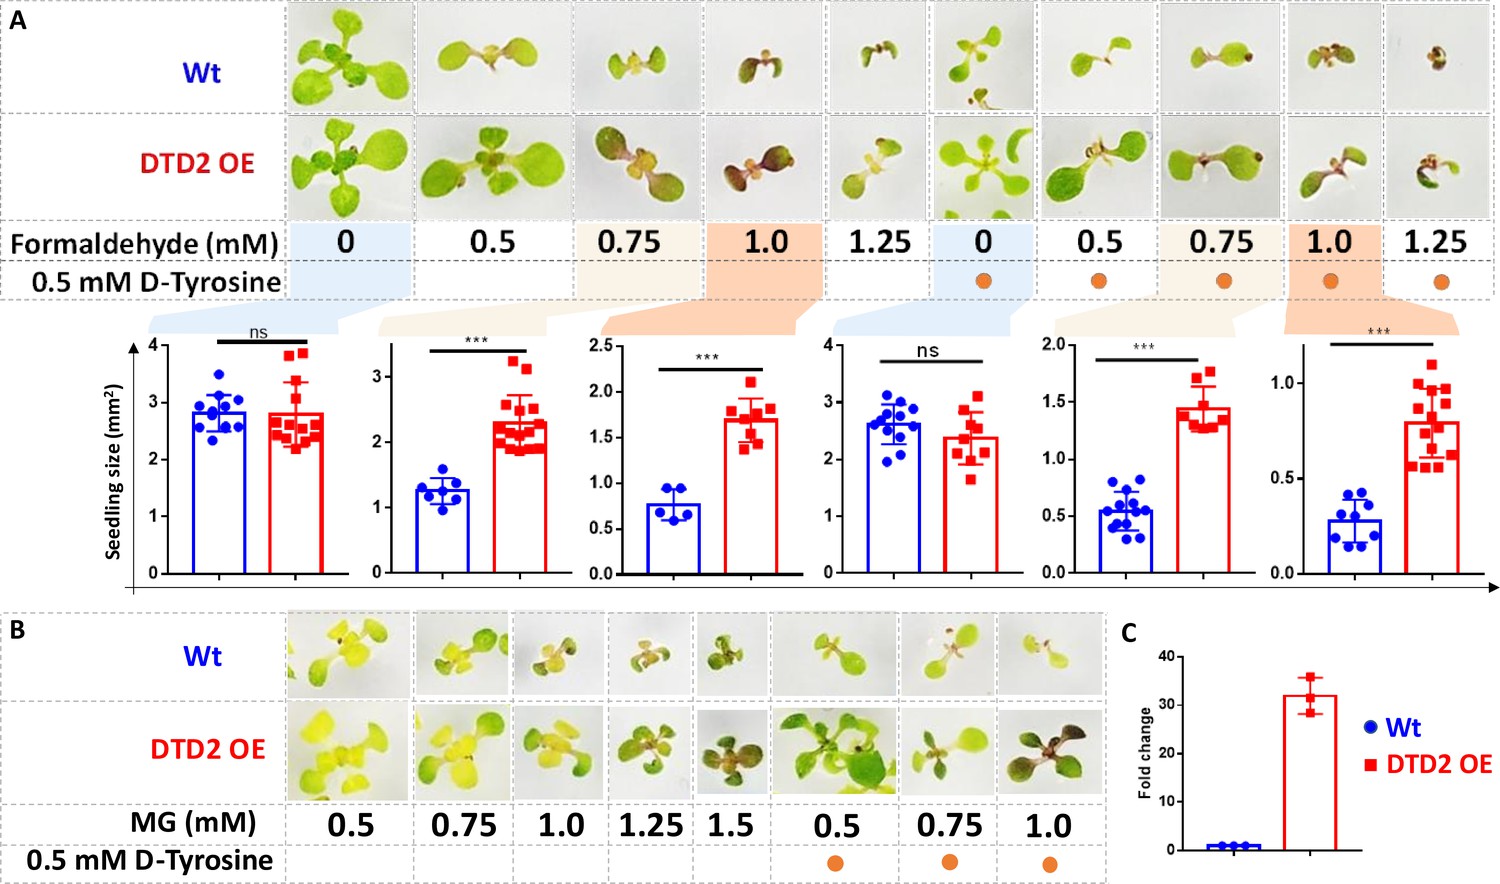
Overexpression of D-aminoacyl-tRNA deacylase2 (DTD2) confers increased multi-aldehyde tolerance to A. thaliana.
DTD2 overexpression (OE) plants grow better than wild type Col-0 under (A) 0.5 mM, 0.75 mM, 1.0 mM, and 1.25 mM of formaldehyde with and without 0.5 mM D-tyrosine. Cotyledon surface area (mm2) is plotted as parameter for seedling size (n=5–15). Ordinary one-way ANOVA test was used where p values higher than 0.05 are denoted as ns and p≤0.001 are denoted as ***. (B) Growth of DTD2 OE and wild type Col-0 under 0.5 mM, 0.75 mM, 1.0 mM, 1.25 mM, 1.5 mM of MG and 0.5 mM, 0.75 mM, 1.0 mM MG with 0.5 mM D-tyrosine. (C) The quantitative polymerase chain reaction (qPCR) analysis showing fold change of DTD2 gene expression in DTD2 OE plant line used (n=3).
-
Figure 5—source data 1
Seedling surface area data for wild type (Wt) and D-aminoacyl-tRNA deacylase2 overexpression (DTD2 OE) plants under multiple concentrations of formaldehyde with and without D-amino acid treatments.
- https://cdn.elifesciences.org/articles/92827/elife-92827-fig5-data1-v1.xlsx
-
Figure 5—source data 2
The quantitative polymerase chain reaction (qPCR) analysis data of D-aminoacyl-tRNA deacylase2 (DTD2) gene expression in wild type (Wt) and DTD2 overexpression (OE) plant line used.
- https://cdn.elifesciences.org/articles/92827/elife-92827-fig5-data2-v1.xlsx
-
Figure 5—source data 3
Seedling surface area data for wild type (Wt) and D-aminoacyl-tRNA deacylase2 overexpression (DTD2 OE) plants under multiple concentrations of formaldehyde with and without D-amino acid treatments.
- https://cdn.elifesciences.org/articles/92827/elife-92827-fig5-data3-v1.xlsx
Figure 5—figure supplement 1
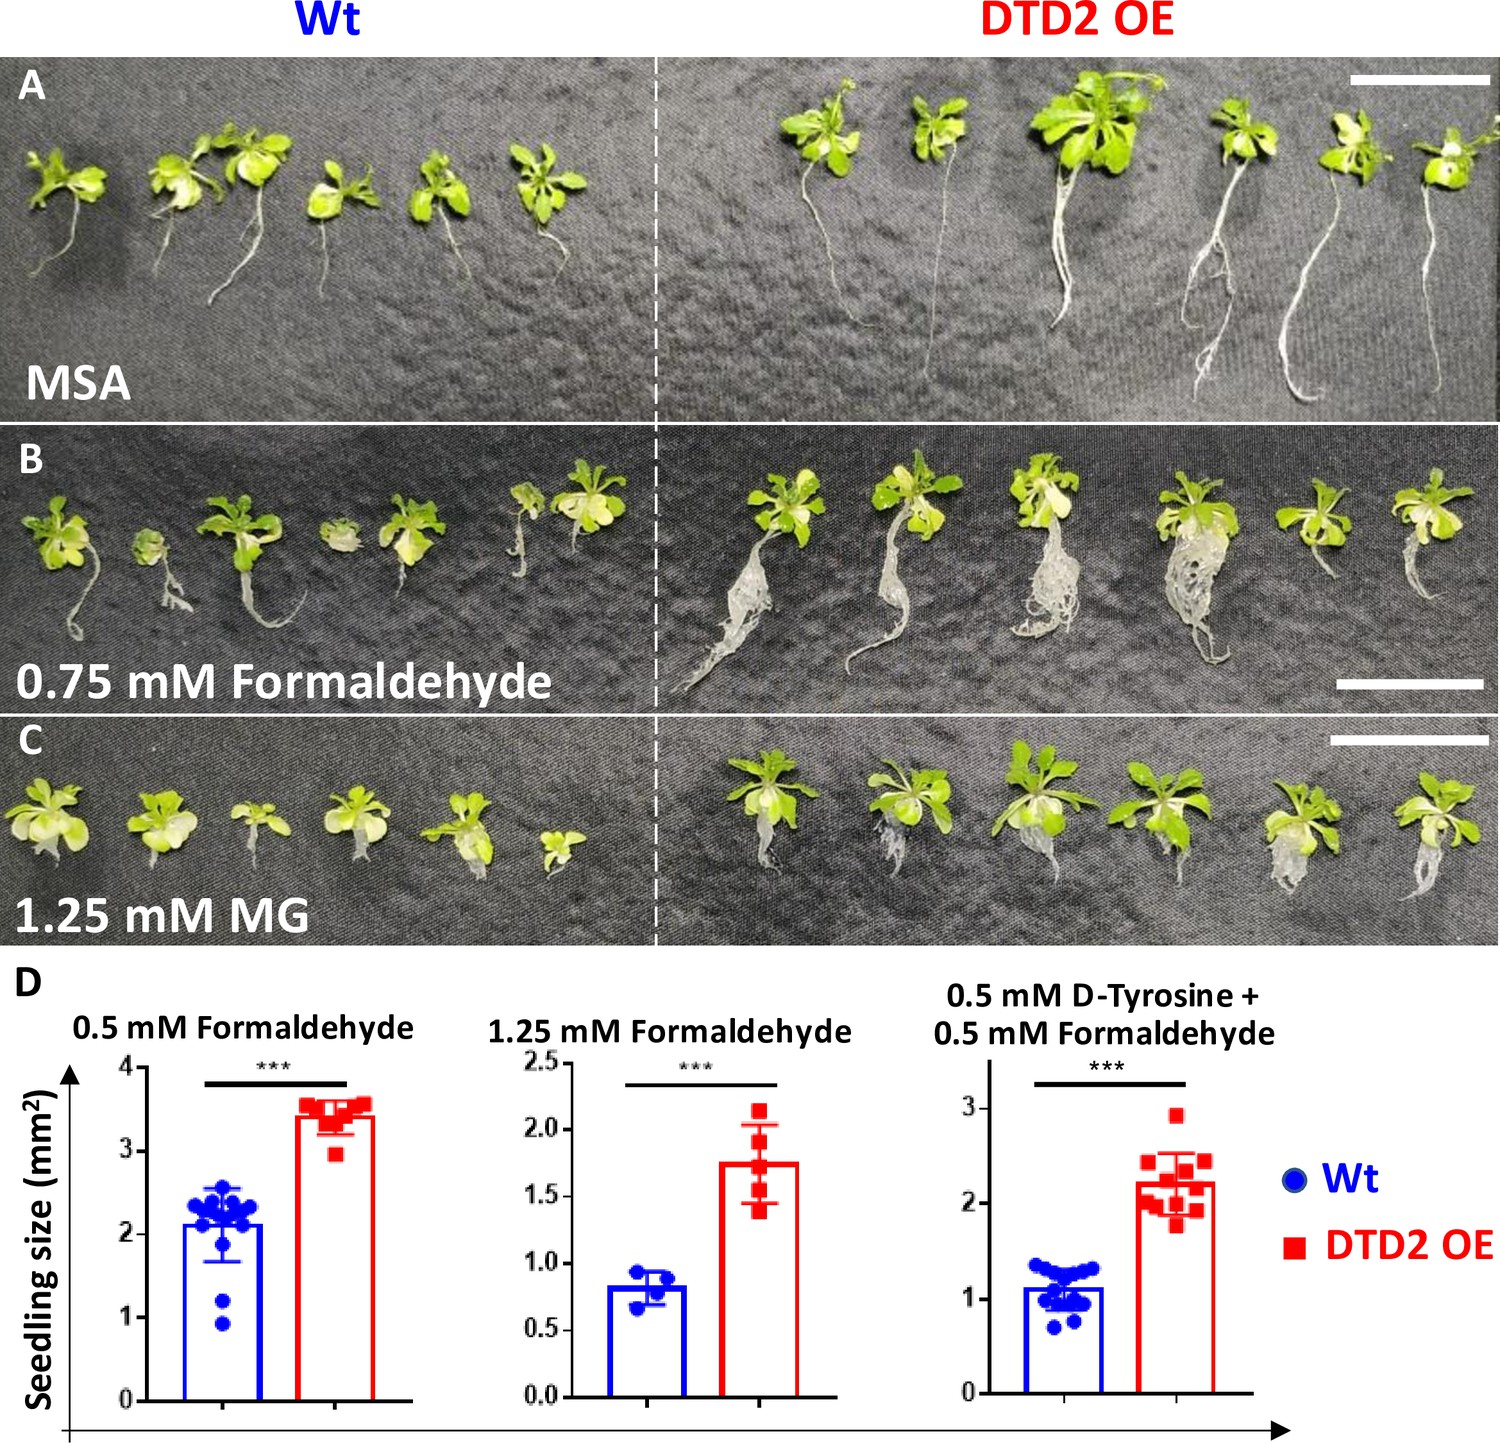
Overexpression of D-aminoacyl-tRNA deacylase2 (DTD2) confers multi-aldehyde tolerance with D-amino acid stress in A. thaliana.
DTD2 overexpression (OE) line grows better than wild type (Wt) Col-0 under (A) no stress, (B) 0.75 mM formaldehyde, and (C) 1.25 mM MG (n=18). Scale bars: 1 cm. (D) Graph showing the seedling size of Wt and DTD2 OE plants under 0.5 mM, 1.25 mM formaldehyde, and 0.5 mM D-tyrosine with 0.5 mM formaldehyde. Cotyledon surface area (mm2) is plotted as parameter for seedling size (n=4–15). Ordinary one-way ANOVA test was used where p values higher than 0.05 are denoted as ns and p≤0.001 are denoted as ***.
Figure 6 with 1 supplement
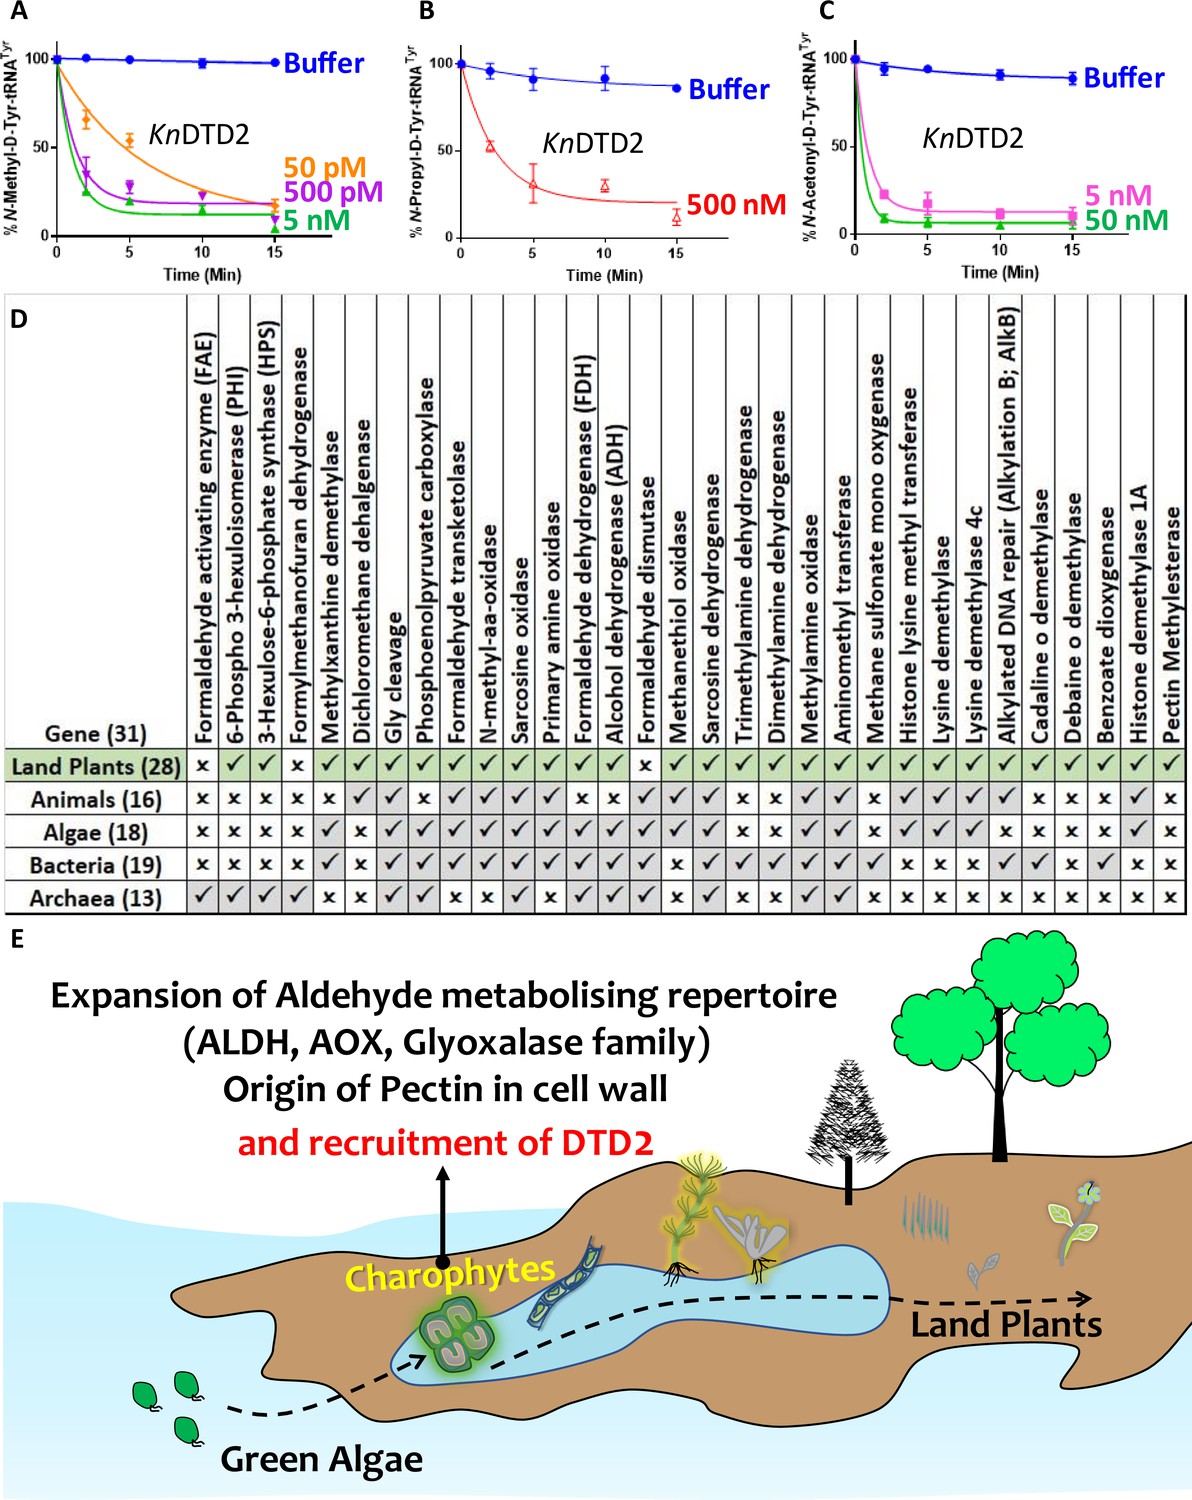
Terrestrialisation of plants is associated with expansion of aldehyde metabolising genes.
Deacylation assays of KnDTD2 on (A) formaldehyde-, (B) propionaldehyde-, and (C) MG-modified D-Tyr-tRNATyr (n=3). (D) Table showing the presence of 31 genes associated with formaldehyde metabolism in all KEGG organisms across life forms. (E) Model showing the expansion of aldehyde metabolising repertoire, cell wall components, and recruitment of archaeal DTD2 in charophytes during land plant evolution.
-
Figure 6—source data 1
Biochemical data for deacylations of formaldehyde-, propionaldehyde-, and MG-modified D-Tyr-tRNATyr substrates by KnDTD2.
- https://cdn.elifesciences.org/articles/92827/elife-92827-fig6-data1-v1.xlsx
-
Figure 6—source data 2
Biochemical data for deacylations of butyraldehyde-, valeraldehyde-, and isovaleraldehyde-modified D-Tyr-tRNATyr substrates by KnDTD2.
- https://cdn.elifesciences.org/articles/92827/elife-92827-fig6-data2-v1.xlsx
Figure 6—figure supplement 1

Land plant evolution is associated with the expansion of aldehyde metabolising repertoire.
Deacylation assays of KnDTD2 on (A) butyraldehyde-, (B) valeraldehyde-, and (C) isovaleraldehyde-modified D-Tyr-tRNATyr (n=3). (D) Graph showing the number of genes for aldehyde oxidase (AOX) in viridiplantae. (E) Schematics showing multiple enzymes involved in formaldehyde metabolism based on KEGG database across life forms. (F) Table showing the presence of enzymes involved in MG production in KEGG genomes of opisthokonts, land plants, algae, bacteria, and archaea. Number denotes the percentage of KEGG organism encoding respective enzymes. (G) Table showing the emergence of enzymes responsible for pectin biosynthesis and degradation in land plant ancestors. (*Present in few chlorophytes.)
Figure 7
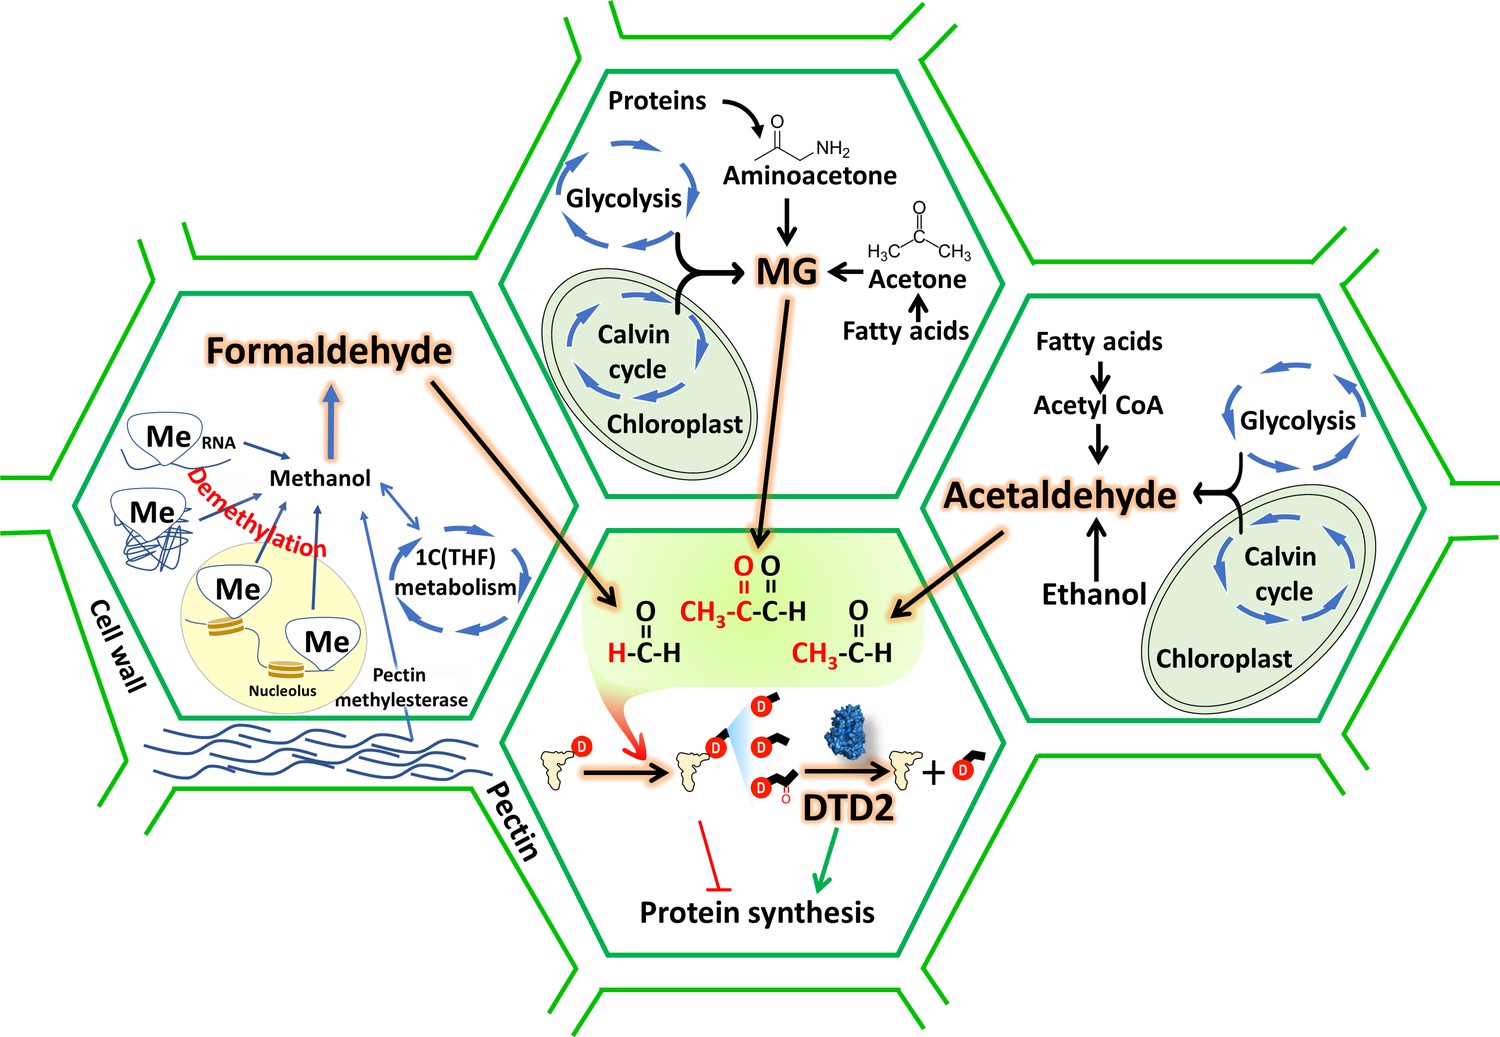
D-aminoacyl-tRNA deacylase2 (DTD2) acts as a general aldehyde detoxifier in land plants during translation quality control.
Model showing the production of multiple aldehydes like formaldehyde, acetaldehyde, and methylglyoxal (MG) through various metabolic processes in plants. These aldehydes generate stable alkyl modification on D-aminoacyl-tRNA adducts and DTD2 is unique proofreader for these alkyl adducts. Therefore, DTD2 protects plants from aldehyde toxicity associated with translation apparatus emerged from expanded metabolic pathways and D-amino acids.
Author response image 1

DTD2 recycles multiple D-aa-tRNAs with different side chain chemistry and size.
Growth of wildtype (WT), dtd null strain (∆dtd), and Pyrococcus horikoshii DTD2 (PhoDTD2) complemented ∆dtd strains of E. coli K12 cells with 500 µM IPTG along with (A) no D-amino acids, (B) 2.5 mM D-tyrosine, (C) 30 mM D-aspartate and (D) 5 mM D-tryptophan.
Author response image 2
Elongation factor enantio-selects L-aa-tRNAs through D-chiral rejection mechanism.
(A) Surface representation showing the cocrystal structure of EF-Tu with L-Phe-tRNAPhe. Zoomed-in image showing the binding of L-phenylalanine with side chain projected outside of binding site of EF-Tu (PDB id: 1TTT). (B) Zoomed-in image of amino acid binding site of EF-Tu bound with L-phenylalanine showing the selection of amino group of amino acid through main chain atoms (PDB id: 1TTT). (C) Modelling of D-phenylalanine in the amino acid binding site of EF-Tu shows severe clashes with main chain atoms of EF-Tu. Modelling of smallest chiral amino acid, alanine, in the amino acid binding site of EF-Tu shows (D) no clashes with L-alanine and (E) clashes with D-alanine. (F) Modelling of D-alanine in the amino acid binding site of eEF-1A shows clashes with main chain atoms. (*Represents modelled molecule). (G) Structure-based sequence alignment of elongation factor from bacteria, archaea and eukaryotes (both plants and animals) showing conserved amino acid binding site residues. (Key residues are marked with red star).
Author response image 3

Elongation factor protects L-aa-tRNAs from aldehyde modification.
(A) Cartoon representation showing the cocrystal structure of EF-Tu with L-Phe-tRNAPhe (PDB id: 1TTT). (B) Zoomed-in image of amino acid binding site of EF-Tu bound with L-phenylalanine (PDB id: 1TTT). (C) Cartoon representation showing the cryoEM structure of eEF-1A with tRNAPhe (PDB id: 5LZS). (D) Image showing the overlap of EF-Tu:L-Phe-tRNAPhe crystal structure and eEF-1A:tRNAPhe cryoEM structure (r.m.s.d. of 1.44 Å over 292 Cα atoms). (E) Zoomed-in image of amino acid binding site of eEF-1A with modelled L-alanine (PDB id: 5ZLS). (*Modelled) (F) Overlap showing the amino acid binding site residues of EF-Tu and eEF-1A. (EF-Tu residues are marked in black and eEF-1A residues are marked in red).
Author response image 4

Loss of DTD results in accumulation of modified D-aminoacyl adducts on tRNAs in E.
coli. Mass spectrometry analysis showing the accumulation of aldehyde modified D-Tyr-tRNATyr in (A) Δdtd E. coli, (B) formaldehyde and D-tyrosine treated Δdtd E. coli, and (C) MG and D-tyrosine treated Δdtd E. coli. ESI-MS based tandem fragmentation analysis for unmodified and aldehyde modified D-Tyr-tRNATyr in (D) Δdtd E. coli, (E) and (F) formaldehyde and D-tyrosine treated Δdtd E. coli, (G) and (H) MG and D-tyrosine treated Δdtd E. coli.
Author response image 5
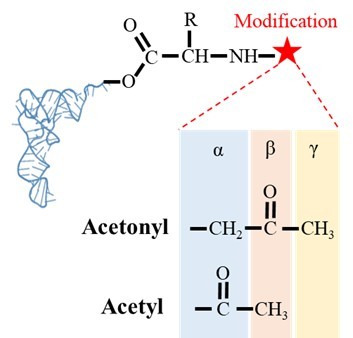
Figure showing the difference in the position of carbonyl carbon in acetonyl and acetyl modification on aa-tRNAs.
Tables
Author response table 1
| Component | Purpose |
|---|---|
| tRNA^(Tyr) | To check the aldehyde modification, EF-Tu based protection assays and check the enzymatic activity of various enzymes like DTD1, DTD2 and PTH |
| tRNAPhe | To characterise the chemical nature of the modification via mass spectrometry |
| tRNA Ala | To check the modification propensity of aldehydes with varying chain length |
| TyrRS | To generate L-Tyr-tRNA Tyr and D-Tyr-tRNA Tyr for biochemical assays |
| PheRS | To generate D-Phe-tRNAPhe for mass-spectrometry-based assays |
| AlaRS | To generate L-Ala-tRNA Ala for checking the modification strength of different aldehydes |
Additional files
-
Supplementary file 1
Presence of enzymes related to formaldehyde, MG, and pectin in all KEGG organisms.
- https://cdn.elifesciences.org/articles/92827/elife-92827-supp1-v1.xlsx
-
Supplementary file 2
List of DNA primers used in the study.
- https://cdn.elifesciences.org/articles/92827/elife-92827-supp2-v1.xlsx
-
MDAR checklist
- https://cdn.elifesciences.org/articles/92827/elife-92827-mdarchecklist1-v1.docx
Download links
A two-part list of links to download the article, or parts of the article, in various formats.
Downloads (link to download the article as PDF)
Open citations (links to open the citations from this article in various online reference manager services)
Cite this article (links to download the citations from this article in formats compatible with various reference manager tools)
A translation proofreader of archaeal origin imparts multi-aldehyde stress tolerance to land plants
eLife 12:RP92827.
https://doi.org/10.7554/eLife.92827.3


