Stochastic parabolic growth promotes coexistence and a relaxed error threshold in RNA-like replicator populations
- Institute of Evolution, HUN-REN Centre for Ecological Research, Hungary
- Doctoral School of Biology, Institute of Biology, ELTE Eötvös Loránd University, Hungary
- Center for the Conceptual Foundations of Science, Parmenides Foundation, Germany
- Department of Plant Systematics, Ecology and Theoretical Biology, Eötvös Loránd University, Hungary
Figures
Figure 1
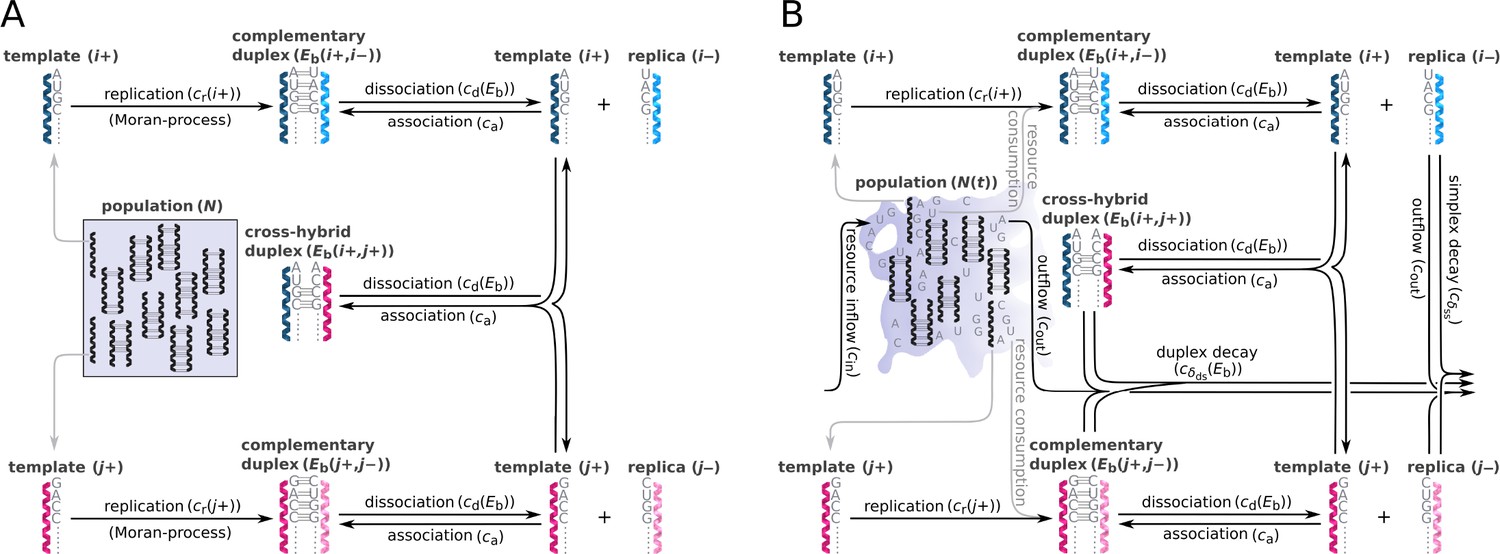
Schematic representation of two parabolically replicating systems.
(A, B) These systems represent spatially constrained or aggregated, but well-mixed (e.g. by wet-dry cycles on mineral surfaces) replicator populations. Black arrows indicate the possible chemical reactions, i and j denote master types. (A) Constant population model representing a Moran process. denotes the (fixed) total number of replicator molecules. This model allows us to investigate the inherent dynamical properties of parabolic growth, such as its diversity-maintaining ability in face of mutations, under fixed and controlled conditions. (B) Chemostat model representing an open system. denotes the time-dependent total number of replicators. This model allows us to investigate the effects of the changes in prebiotic environments on parabolic coexistence. Such alternations in environmental conditions could have involved, for example, variations in resource availability and the consequential shifts in the strength of resource competition. For the explanation of mechanisms and constants, see main text and Table 1.
Figure 2
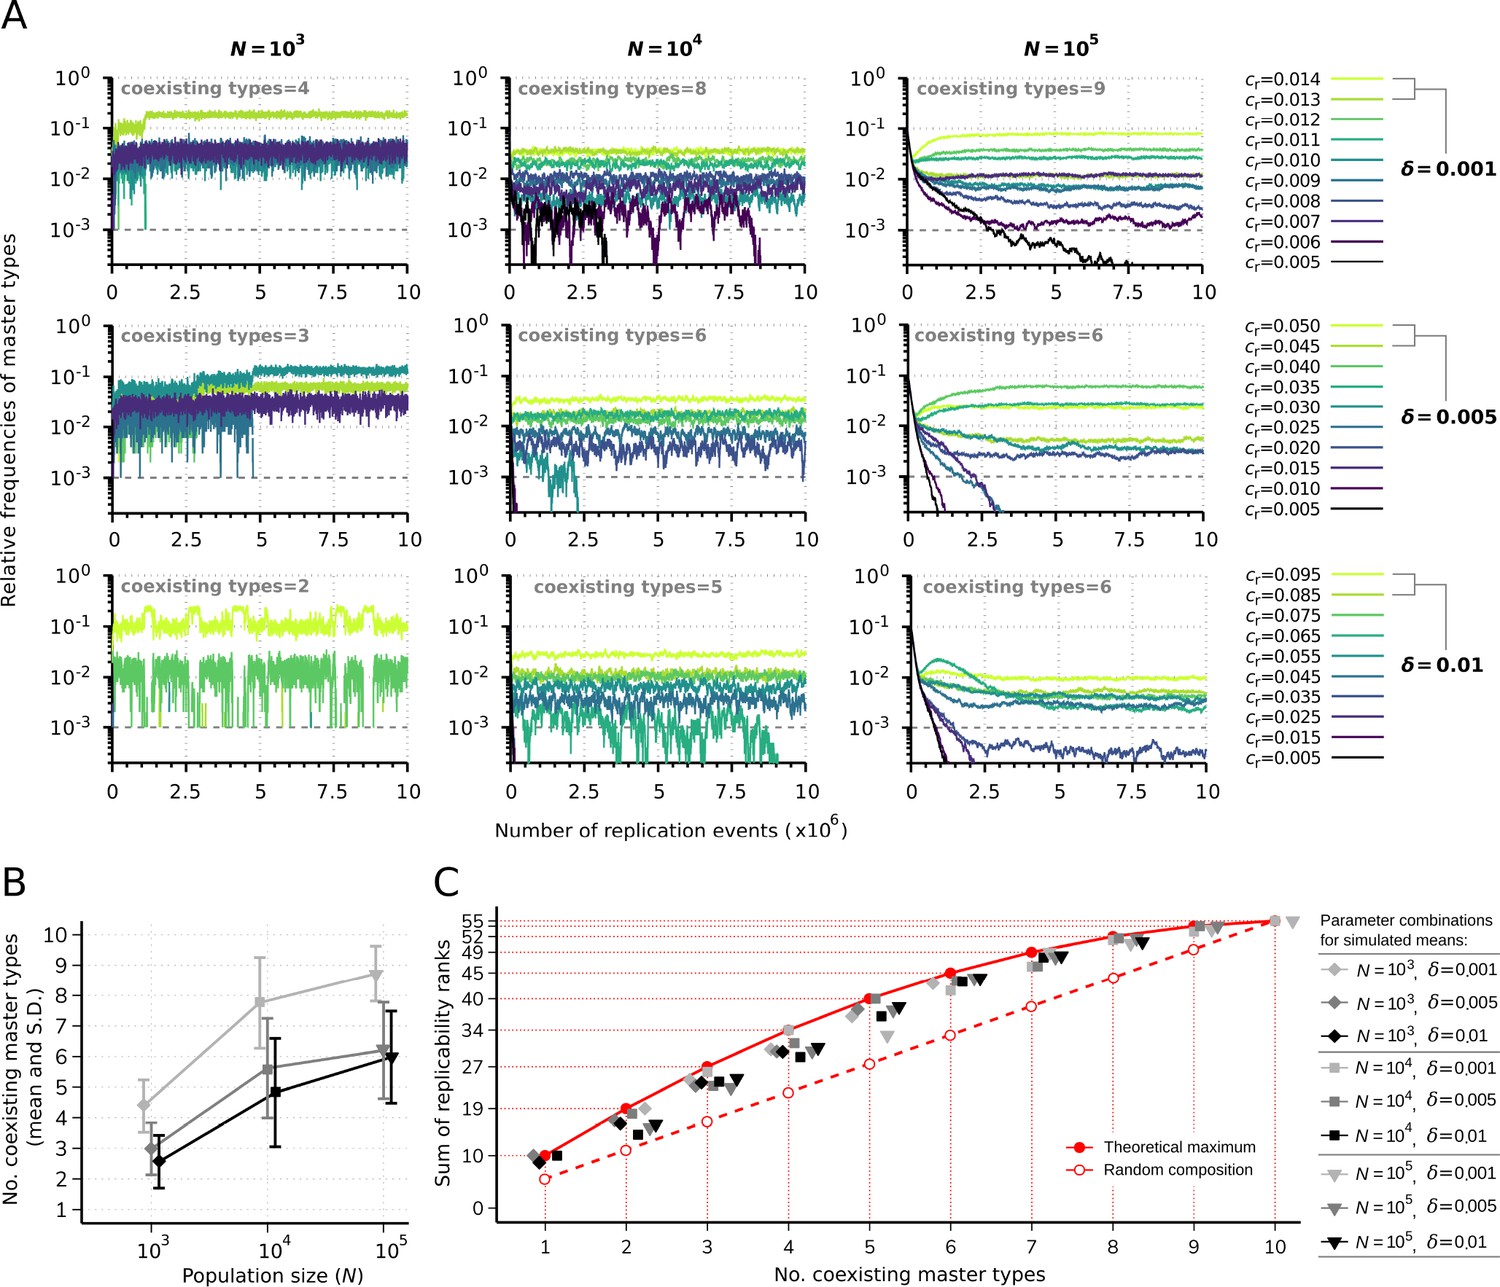
Replicator coexistence in the constant population model.
(A) Time series of the relative frequencies of master types. Panels corresponding to different rows demonstrate distinct replicability distances (), panels corresponding to different columns demonstrate distinct population sizes (). Line colors indicate different replicabilities of the master types (as explained in the legends). The cut-off relative frequency for survival is indicated by horizontal dashed lines. (B) Mean and standard deviation of the number of sustained master types as the function of and calculated from 50 independent runs (the corresponding legend is shown next to panel C). (C) Sum of replicability ranks of the survived master types at different number of coexisting types, corresponding to the simulation results shown in (B). The red curve denotes the maximum of the sum of replicability ranks (), the dashed red line shows the expected values of the sum of replicability ranks, when the surviving master types are random () with respect to their replicabilities. The default parameter set (see Table 1) was used, unless otherwise indicated.
Figure 3
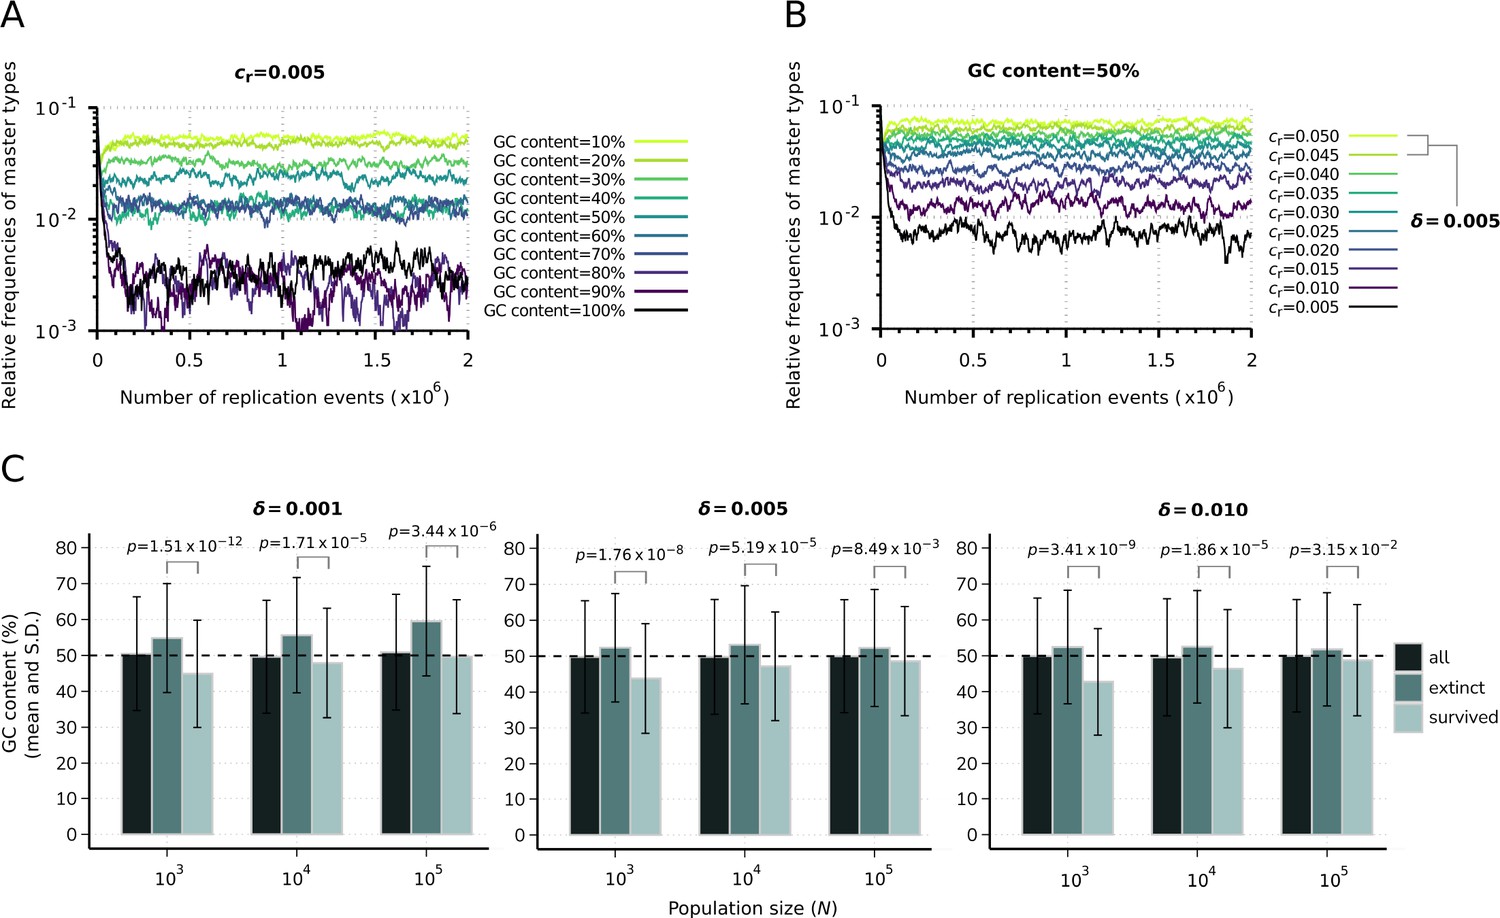
Effect of sequence composition on replicator abundances in the constant population model.
(A) Demonstration of the direct effect of sequence composition on replicator abundances. The master types (indicated by differently colored lines) are defined along a GC content gradient with identical replicabilities (). (B) Consequences of removal of the effect of sequence composition on replicator abundances. The master types (indicated by differently colored lines) are defined along a replicability gradient (replicability distance: ) with identical GC contents (50%). Due to the relatively fast convergence, simulations were terminated after replication events. Parameters that were used in both simulations: , pmut = 0.01 (see Table 1). (C) Means and standard deviation of the relative GC content in the survived and extinct master types, corresponding to the simulation results shown in Figure 2B and C. Columns with the darkest shade represent the average GC content of the randomly generated master sequences (10 sequences for all 50 replicate runs) constituting the initial populations. Horizontal dashed lines indicate the expected (random) 50% initial GC content. The exact p-values resulted from the two-sample Wilcoxon tests on the GC content of the survived-extinct subsets are indicated above the column pairs.
Figure 4
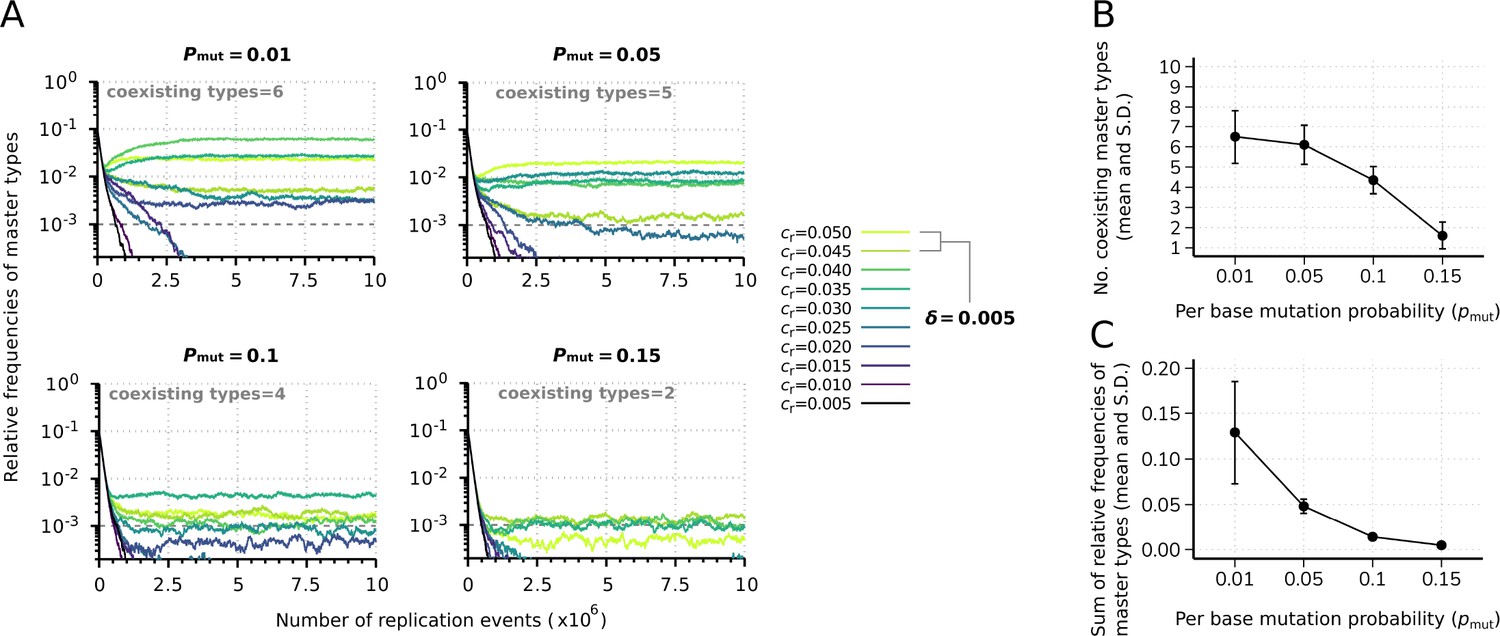
Effect of the mutation rate on the replicator coexistence in the constant population model.
(A) Time series of the relative frequencies of master types at different mutation rates (). Line colors denote master type replicabilities (values are indicated in the legend). The cut-off relative frequency for survival is indicated by horizontal dashed lines. (B) Mean and standard deviation of the coexisting master types as the function of calculated from 20 independent runs. (C) Mean and standard deviation of the sum of relative frequencies of master types in the total population as the function of , corresponding to the simulation results shown in (B). Except for , the default parameter set (see Table 1) was used.
Figure 5
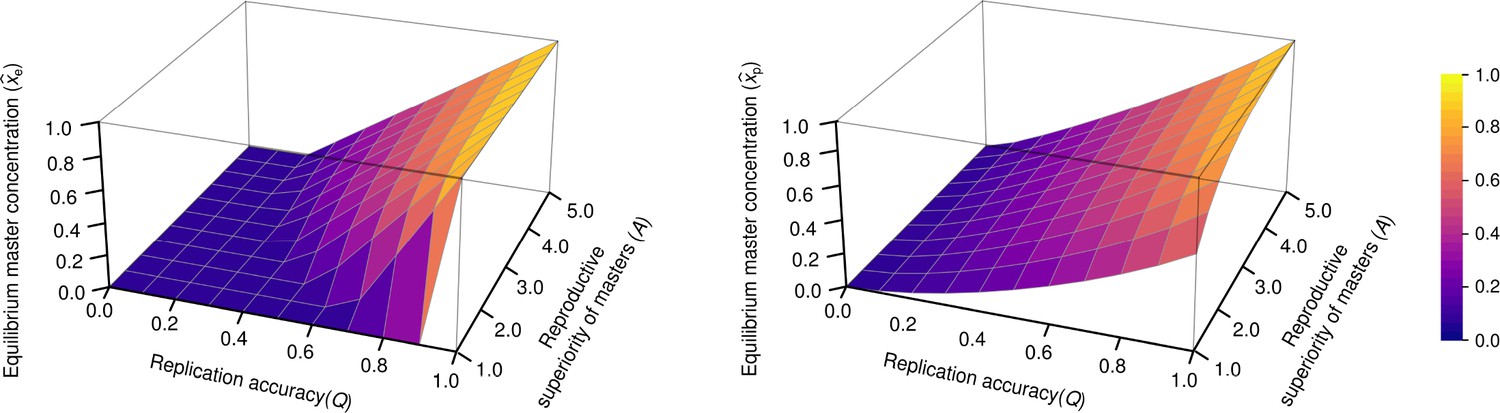
The concentration of master type ( and ) as the function of and in the exponential model (left panel) and in the parabolic replication model (right panel).
(where stands for the reproductive value of the mutants) was used.
Figure 6
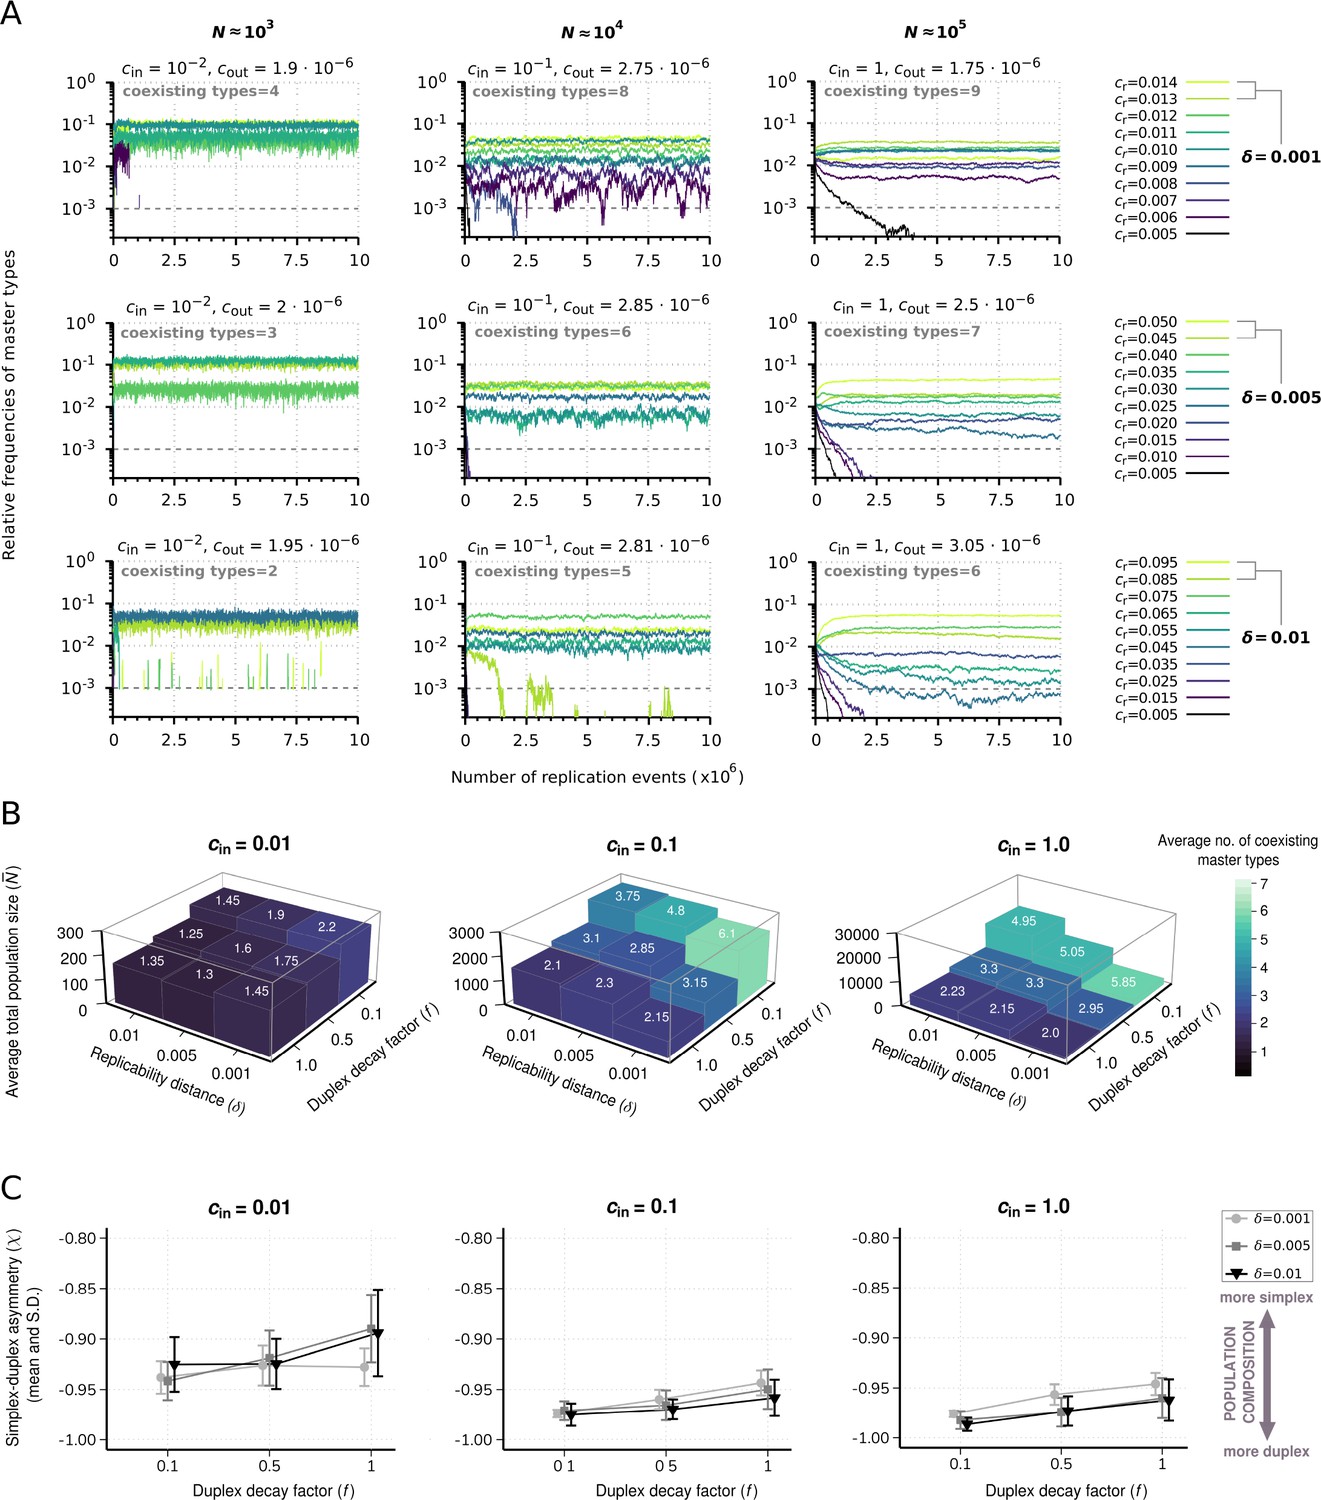
Effect of resource competition on replicator coexistence in the chemostat system model.
(A) Time series of the relative frequencies of master types. Panels corresponding to different columns demonstrate different population sizes (). Panels corresponding to different rows demonstrate different replicability distances (δ). Line colors indicate master types with distinct replicabilities (as explained in the legends). The cut-off relative frequency for survival is indicated by horizontal dashed lines. (B) Averages for the total population size () and the number of coexisting master types (color and numbers on columns) as functions of and duplex decay factor () at different resource inflow rates (). Averages were obtained from 20 individual runs for every parameter combination. (C) Mean and standard deviation of simplex-duplex asymmetry as the function of and at different values, corresponding to the simulation results shown in (B). The default parameter set (see Table 1) was used, unless otherwise indicated.
Appendix 1—figure 1
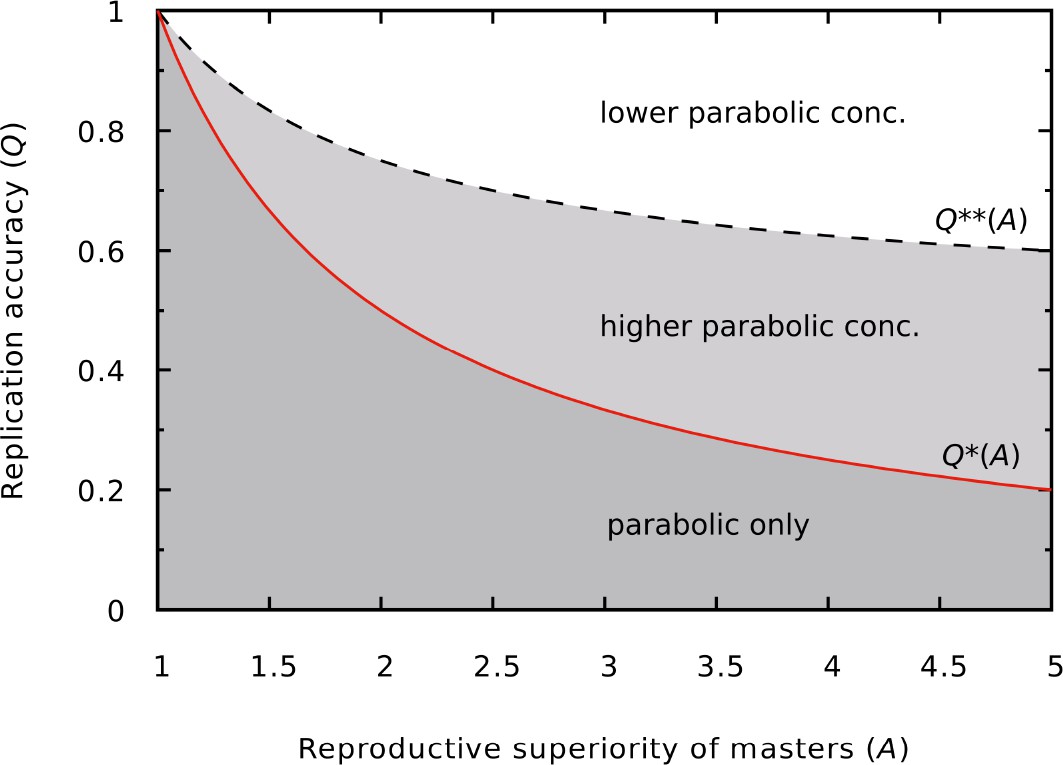
Different outcomes of the dynamics as a function of and .
In the darker gray region (low copying fidelity, high reproductive superiority) the master survives only in the parabolic regime. In the lighter gray region (medium copying fidelity range) the master has a higher equilibrium concentration in the parabolic regime than in the exponential regime. The continuous red line is the error threshold for the exponential system (), the dashed black line divides the higher and lower parabolic concentration regions of the parameter space (). was used.
Appendix 1—figure 2
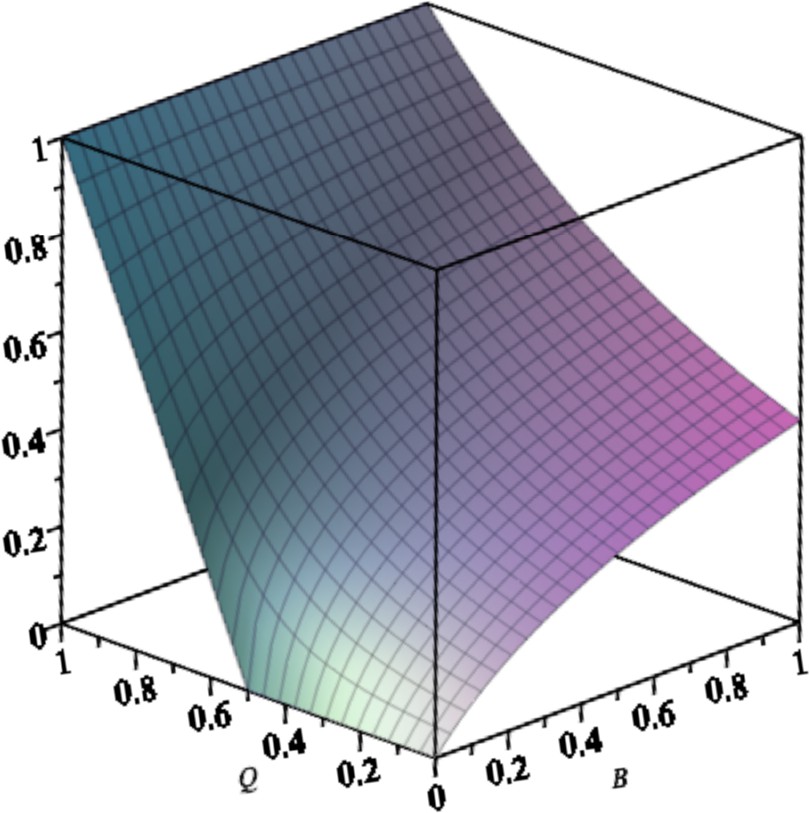
Equilibrium concentration of the master in the exponential system with back mutation () as a function of and .
Parameters are: .
Appendix 1—figure 3
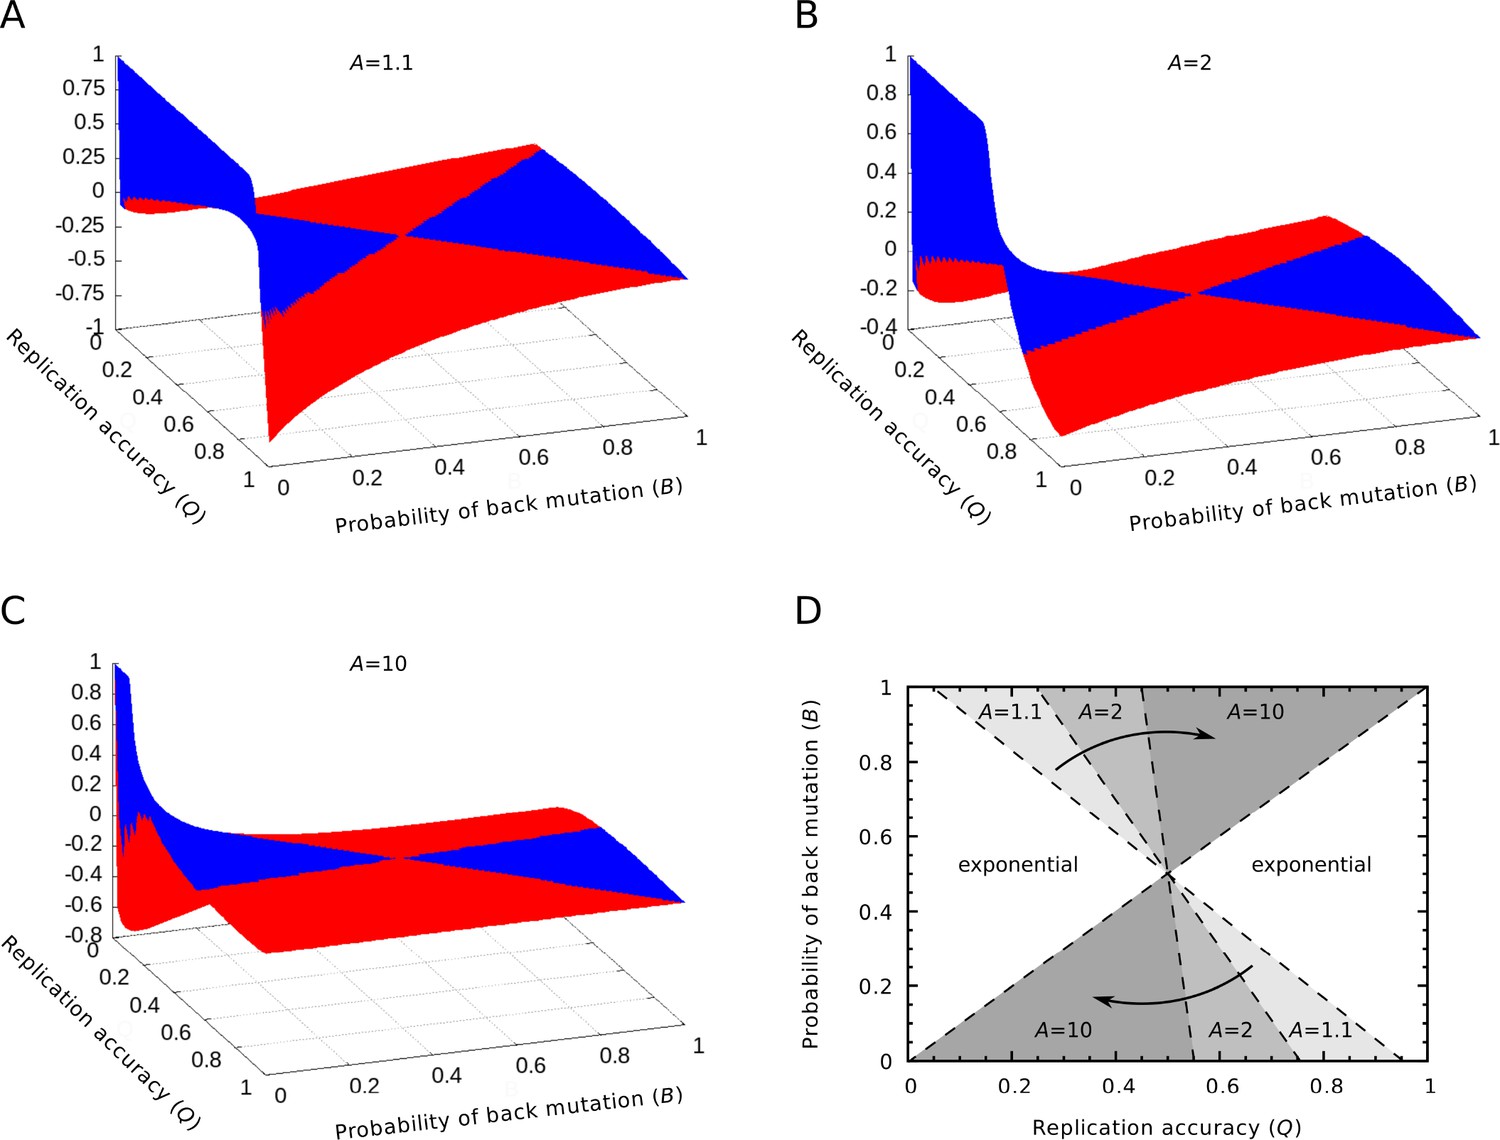
Relative differences between the equilibrium concentrations of the master sequences in the exponential and parabolic regimes.
(A‒C) The relative differences between the two regimes are shown as the function of the replication accuracy () and the probability of back mutation () at , respectively. Blue color indicates higher, red indicates lower parabolic concentrations. (D) The area of the parameter space where the parabolic regime has higher equilibrium concentration. The area shrinks as increases. If , the parabolic case has a higher concentration in the half of the parameter space, while if , this area is reduced to the quarter of the space ( was used).
Author response image 1
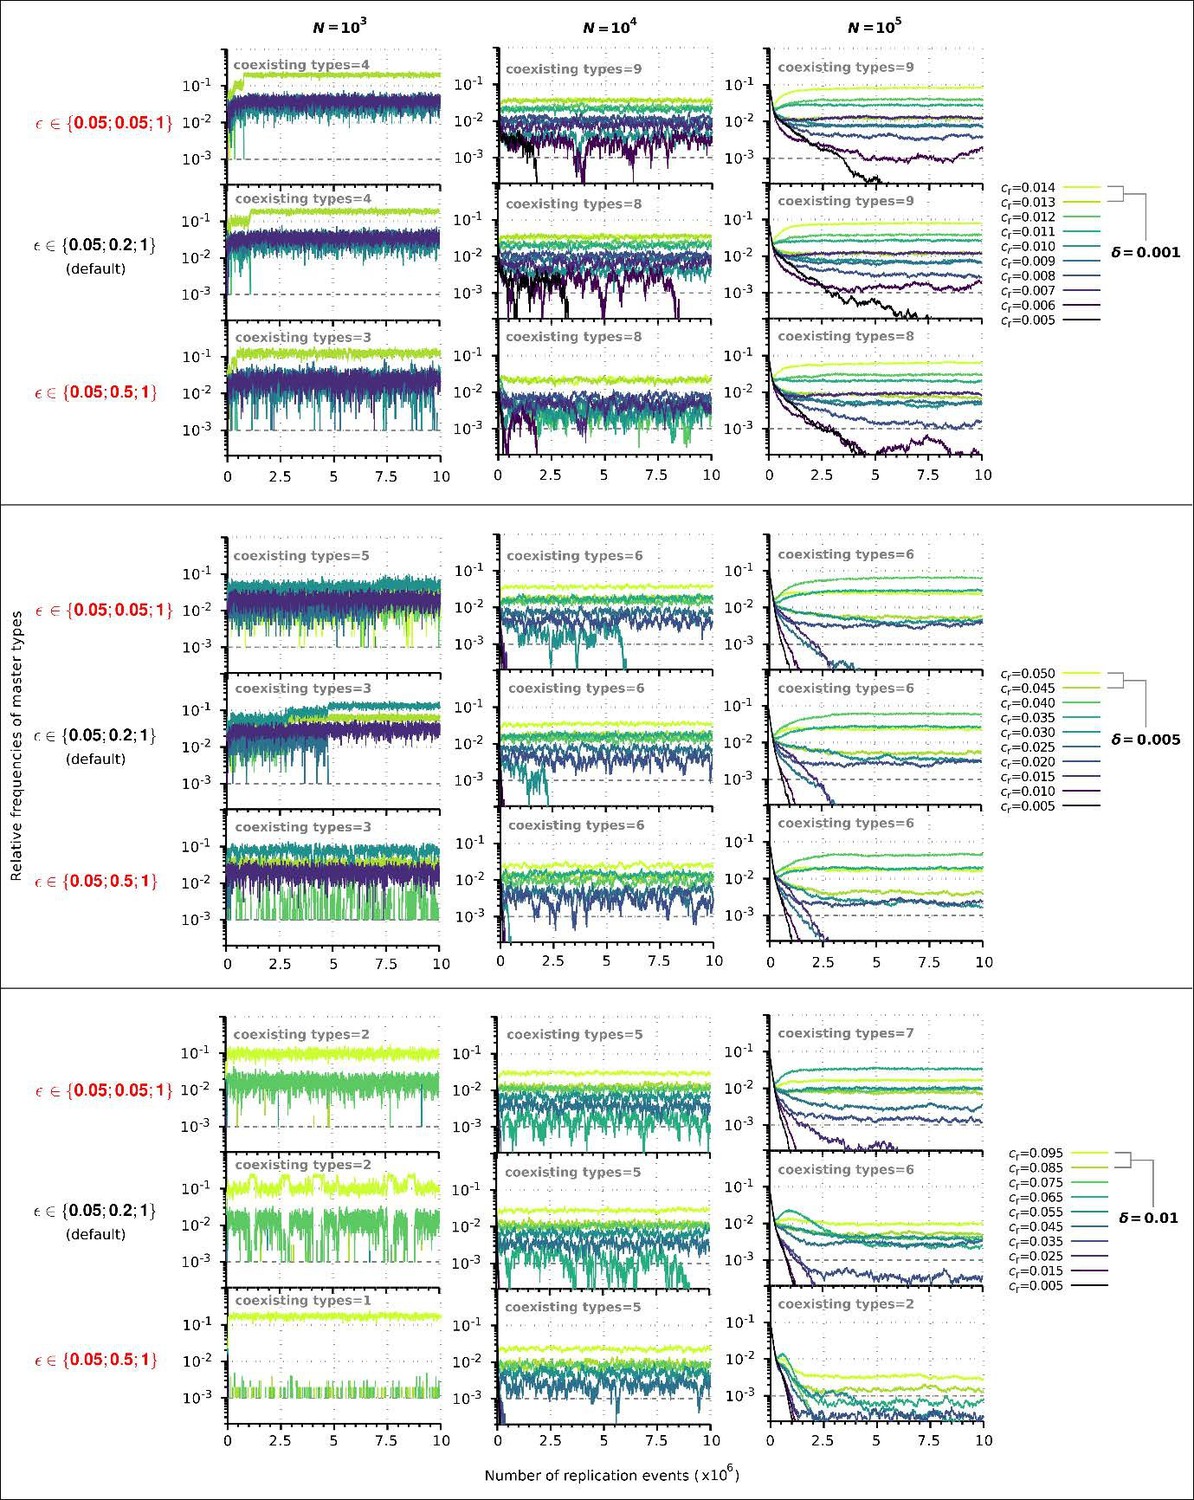
Replicator coexistence in the constant population model with different loss of replicability (𝜀 vector) values.
Within a given combination of 𝛿 and 𝑁 parameter values, the upper panel corresponds to the steeper loss of replicability (𝜀!), the middle panel to the default 𝜀 vector (Figure 2A), and the bottom panel to the more gradual loss of replicability vector (𝜀!!). Within each 𝛿; 𝑁 parameter combination, the same master sequence set was used with the three different 𝜀 vectors for comparability.
Author response image 2
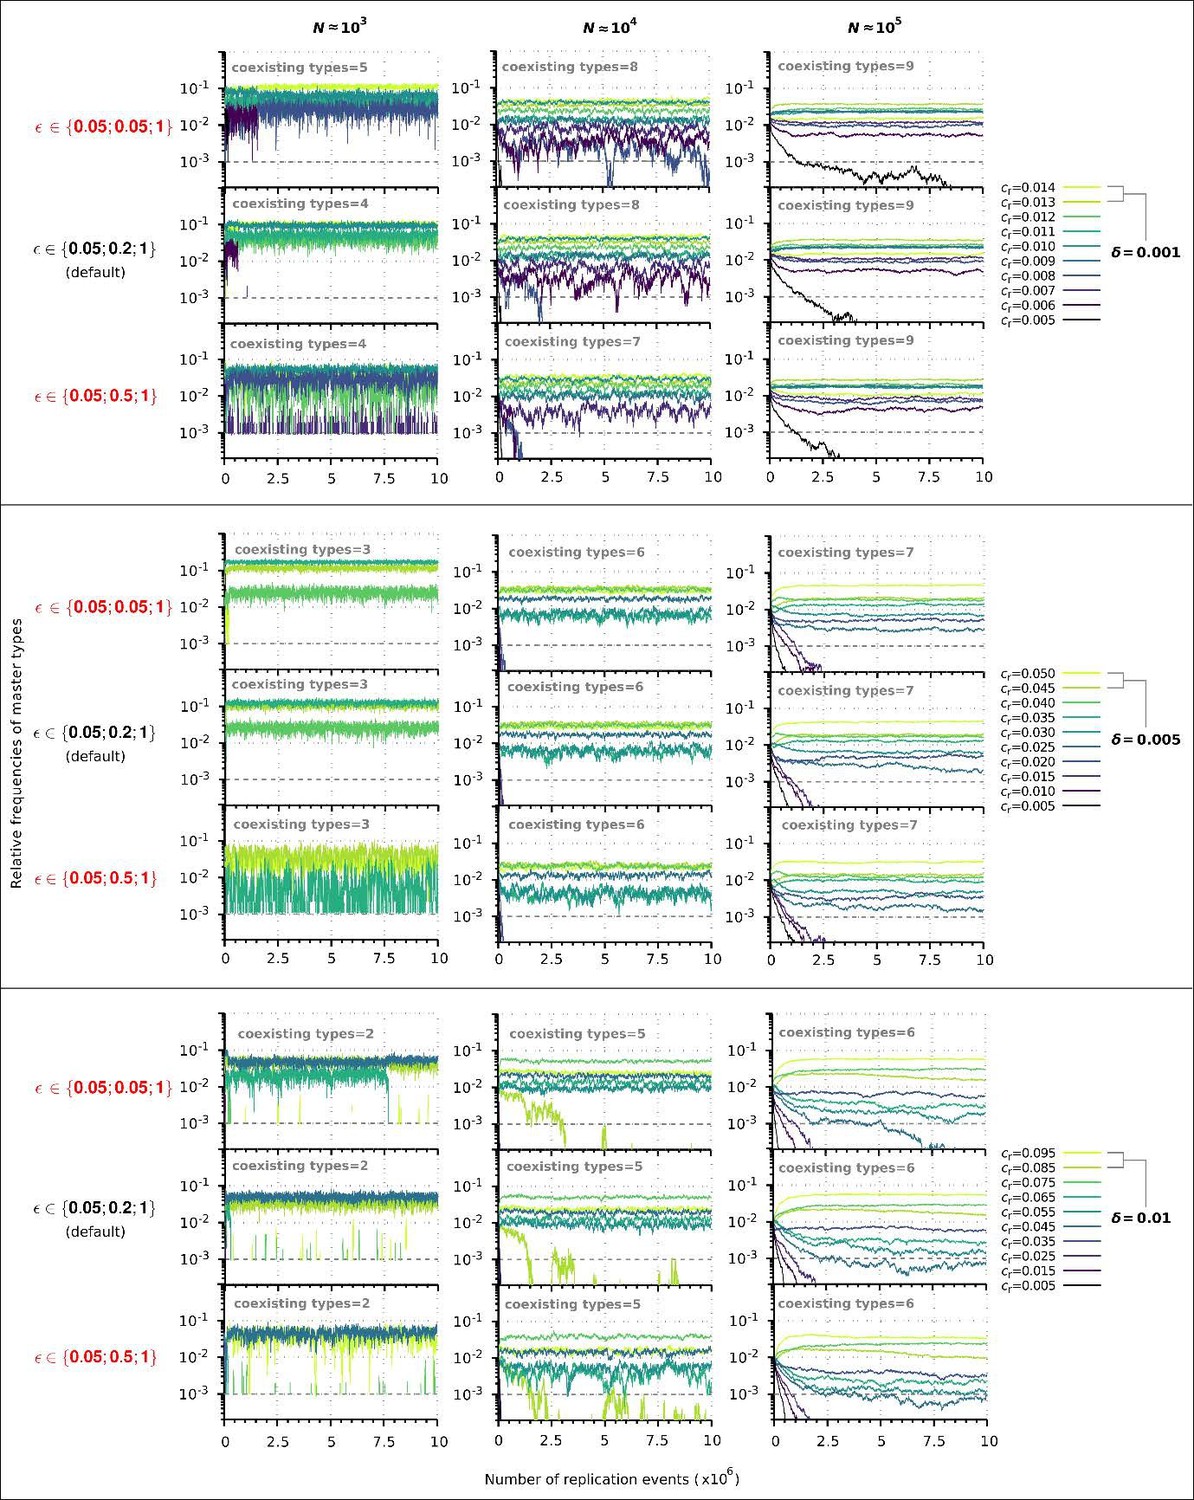
Replicator coexistence in the chemostat model with different loss of replicability (𝜀 vector) values.
Within a given combination of 𝛿 and 𝑁 parameter values, the upper panel corresponds to the steeper loss of replicability (𝜀!), the middle panel to the default 𝜀 vector (Figure 6A), and the bottom panel to the more gradual loss of replicability vector (𝜀!!). Within each 𝛿; 𝑁 parameter combination, the same master sequence set was used with the three different 𝜀 vectors for comparability.
Tables
Table 1
Model parameters.
| Parameter | Definition | Values or range (default) |
|---|---|---|
| * | Total replicator population size | {103; 104; 105} |
| * | Replicability distance | {0.001; 0.005; 0.01} |
| * | Per base mutation rate | {0.01; 0.05; 0.1; 0.15} |
| *† | Duplex decay factor | {0.01; 0.1; 0.5; 1} |
| *† | Kinetic constant for resource influx | {0.01; 0.1; 1} |
| † | Kinetic constant for simplex decay reactions | 10−4 |
| † | Kinetic constant for duplex decay reactions | [1.15·10−8, 6.4·10−5] |
| † | Kinetic constant for outflux of molecular species | [1.75·10−6, 10−5] |
| Kinetic constant for replication reactions | [0.005, 0.095] | |
| Kinetic constant for association reactions | 1 | |
| Kinetic constant for dissociation reactions | [0.01, 0.6309] | |
| Number of master replicator types | 10 | |
| Sequence length | 10 | |
| Error factor for the Hamming distance mutant classes | {0.05; 0.2; 1} | |
| Minimum master replicability | 0.005 | |
| Scale factor for duplex dissociation probability distribution | 0.15 |
-
*
Model parameters involved in screening.
-
†
Parameter used only in the chemostat system model.
Author response table 1
Number of coexisting master types in the chemostat model with different binding energy dependent duplex decay rates.
Within each 𝛿; 𝑁 parameter combination, the same master sequence set was used with the three different factor values: 0.6, 0.8 (the original) and 0.9 for comparability.
| N ≈ 103 | N ≈ 104 | N ≈ 105 | ||
|---|---|---|---|---|
| 4 | 8 | 9 | ||
| (default) | 4 | 8 | 9 | |
| 4 | 7 | 9 | ||
| 3 | 6 | 7 | ||
| (default) | 3 | 6 | 7 | |
| 3 | 6 | 7 | ||
| 2 | 5 | 6 | ||
| (default) | 2 | 5 | 6 | |
| 3 | 5 | 6 |
Additional files
Download links
A two-part list of links to download the article, or parts of the article, in various formats.
Downloads (link to download the article as PDF)
Open citations (links to open the citations from this article in various online reference manager services)
Cite this article (links to download the citations from this article in formats compatible with various reference manager tools)
Stochastic parabolic growth promotes coexistence and a relaxed error threshold in RNA-like replicator populations
eLife 13:RP93208.
https://doi.org/10.7554/eLife.93208.3


