Lesions in a songbird vocal circuit increase variability in song syntax
- Neurobiology of Vocal Communication, Institute for Neurobiology, University of Tübingen, Germany
- Howard Hughes Medical Institute and Center for Integrative Neuroscience, University of California San Francisco, United States
- Departments of Horticulture and Integrative Biology, Oregon State University, United States
Figures
Figure 1 with 2 supplements

Structure of Bengalese finch song.
(A) Example spectrogram (bird 7) depicting an entire song bout with introductory state ‘I’, repeat phrase ‘B’, and individual syllables. (B) Example transition diagram depicting a branchpoint with variable sequencing. Numbers above the arrows denote transition probabilities in percent. (C) Example spectrogram of a chunk. Chunks are defined as highly stereotyped sequences of syllables that only have a single input and output branch and are condensed into one state in the transition diagram (see ‘Methods’). (D) Example spectrogram of a repeat phrase, summarized by capital letter ‘B’ in the transition diagram. The repeating syllable (here, syllable ‘b’) repeats a variable number of times across different instances of the repeat phrase. (E) Schematic showing recurrent pathways projecting onto motor pathway nuclei through lMAN and mMAN. Red: pallial nuclei; blue: thalamic nuclei; green: basal ganglia. Dotted line indicates suspected connection by Kubikova et al., 2007. mMAN: medial magnocellular nucleus of the anterior nidopallium; DMP: dorsomedial nucleus of the posterior thalamus; BG: basal ganglia; DLM: medial portion of the dorsolateral thalamus; lMAN: lateral magnocellular nucleus of the anterior nidopallium; RA: robust nucleus of the arcopallium. (F) Example of a transition diagram. Nodes denote chunk or syllable labels, numbers denote transition probabilities (in percent, % symbol omitted for clarity), d1/d2, g1/g2 denote different states of syllables d and g respectively based on different sequential contexts, capital letters denote repeat phrases. Edges at each node may not sum to 100% because branches smaller than 5% are omitted for clarity.
Figure 1—figure supplement 1
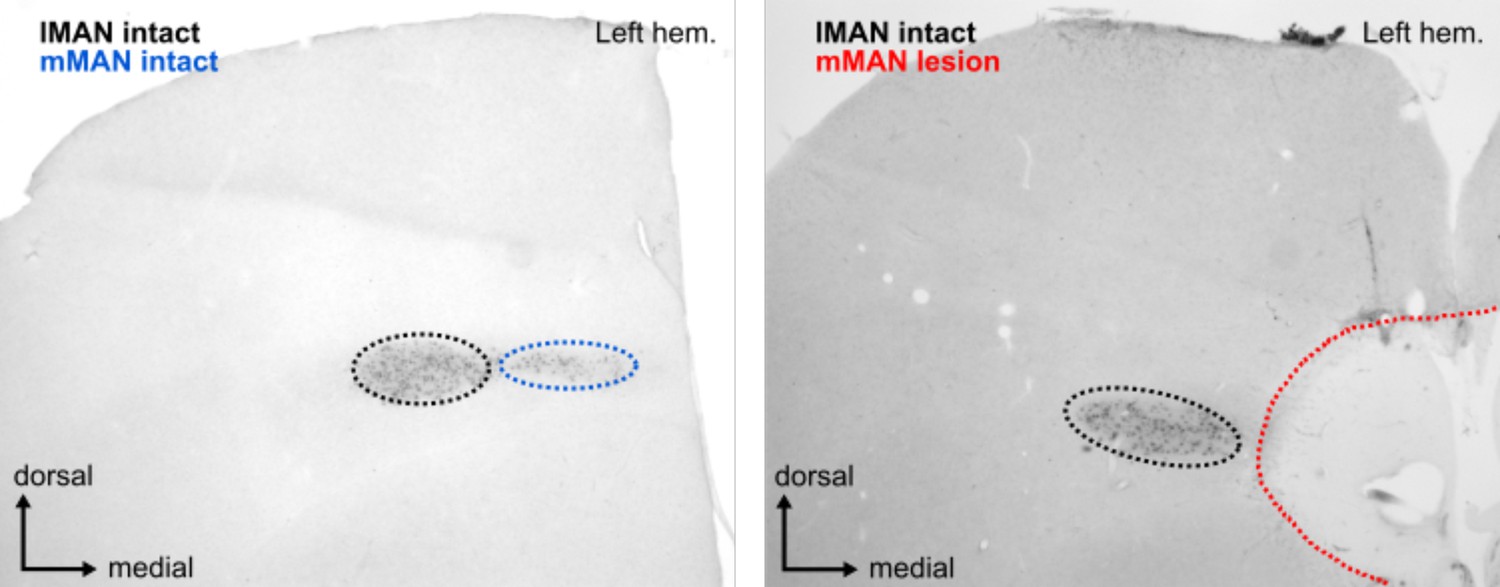
Image of calcitonin gene-related peptide (CGRP)-stained frontal section (left) control and (right) bird 5.
CGRP labels cells in both lateral magnocellular nucleus of the anterior nidopallium (lMAN) (seen in black to the left of the lesion) and medial magnocellular nucleus of the anterior nidopallium (mMAN) (blue, intact; red, completely destroyed).
Figure 1—figure supplement 2
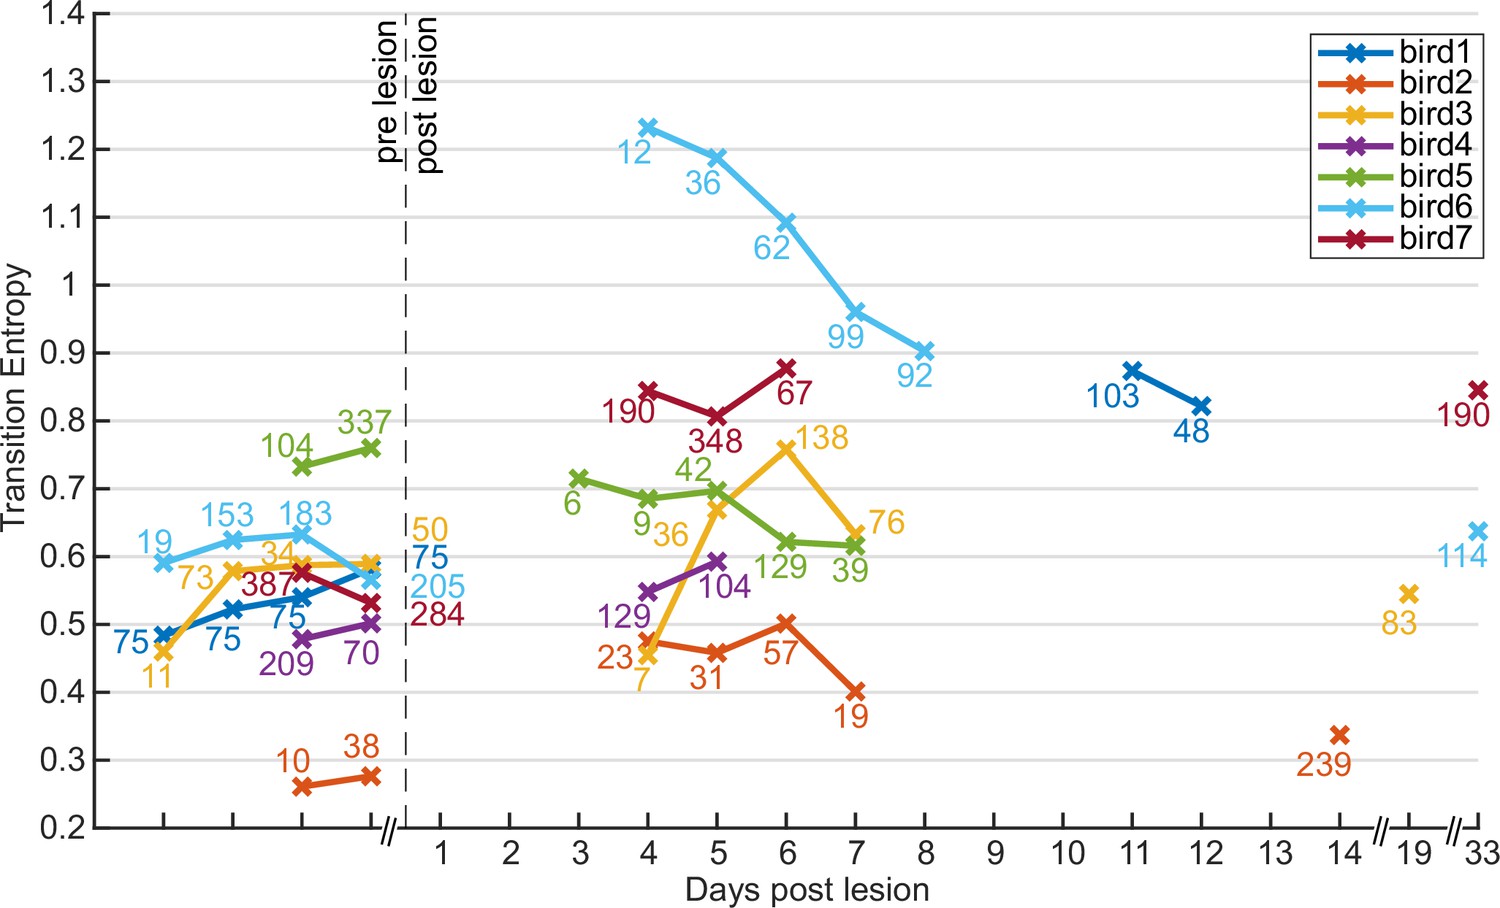
Transition entropy after medial magnocellular nucleus of the anterior nidopallium (mMAN) lesions remains elevated over several days.
Transition entropy did not change in a consistent way after recovery from the lesion for the followed time period. Numbers near the datapoints indicate number of song bouts recorded and analyzed for that day. While the persistence of the effects we observed is longer than transient effects such as those following Nif lesion in zebra finches (~2 d by Otchy et al., 2015), we cannot rule out either recovery or further deterioration following lesions on much longer time scales, such as those reported by Kubikova et al., 2007 (X lesions, 6 mo) (Kubikova et al., 2007). Additional non-connected datapoints at 14, 19, 33, and 33 d post lesion were gathered after additional behavior manipulation and were added here to analyze specifically the persistence of effects after the lesion. For three of these birds, transition entropy remained elevated above the baseline values for 14, 33, and 33 d, respectively.
Figure 2 with 5 supplements
Transition entropy increased after bilateral medial magnocellular nucleus of the anterior nidopallium (mMAN) lesions.
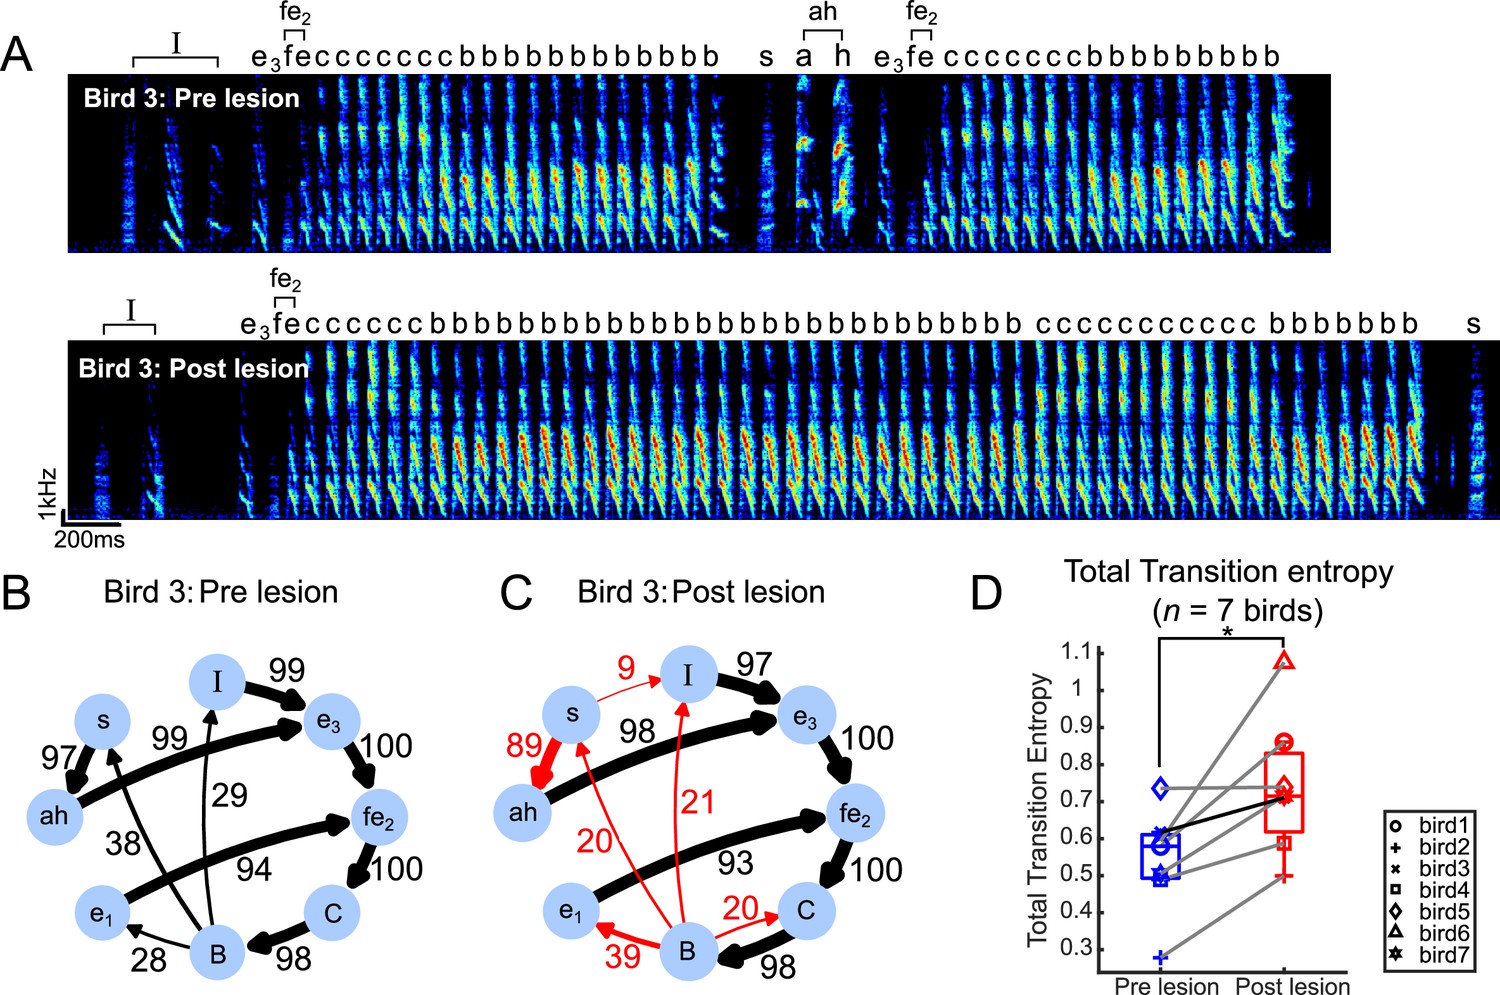
(A) Example spectrogram (bird 3) pre lesion (above) and post lesion (below). ‘I’ denotes introductory state, and ‘fe2’ and ‘ah’ denote chunks, shown as single nodes in the transition diagram. (B) Pre-lesion transition diagram, as in Figure 1F. Note that ‘fe2CB’ is also a chunk before the lesions but is shown as three separate nodes in order to align with the post-lesion diagram in (C). (C) Post-lesion transition diagram. Arrows in red mark example nodes with relatively high increase in transition entropy, including the introduction of new branches after mMAN lesions. (D) Total transition entropy for seven birds before and after mMAN lesions (*p<0.05, n = 7, Wilcoxon signed-rank test). Example bird from (A–C) is shown as darker line. Boxes indicate interquartile range and whiskers mark data points within one additional interquartile range.
-
Figure 2—source code 1
Code for generating Figure 2D based on data from Source data 1–28.
- https://cdn.elifesciences.org/articles/93272/elife-93272-fig2-code1-v1.zip
Figure 2—figure supplement 1
Average spectrograms of 200 instances of all syllable types for all birds before and after medial magnocellular nucleus of the anterior nidopallium (mMAN) lesions.
Letters over the spectrograms indicate syllable labels and symbols over the spectrograms correspond to the symbols used in Figure 2—figure supplement 4.
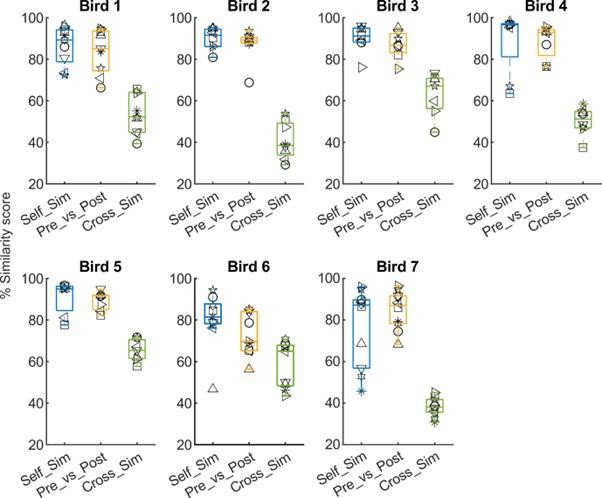
Figure 2—figure supplement 2

Syllable similarity calculated using Sound Analysis Pro (SAP).
‘Self Similarity’ = similarity comparison of syllables before medial magnocellular nucleus of the anterior nidopallium (mMAN) lesions to syllables of the same type, taken from two separate control recordings before the lesions, ‘Pre vs Post’ = similarity comparison of the same syllable types before and after mMAN lesions, ‘Cross Similarity’ = similarity comparison of each syllable type to other syllable types. For birds 1–2 and 4–7, ‘Self Similarity’ was not significantly different from ‘Pre vs Post’ Similarity (p>0.05, Wilcoxon signed-rank test), while for bird 3, there was a significant difference (p=0.03, Wilcoxon signed-rank test; n for bird 1: 9; bird 2: 8; bird 3: 11; bird 4: 9; bird 5: 8; bird 6: 10; bird 7: 10). For all birds, ‘Pre vs Post’ was significantly different from ‘Cross Similarity’ (p<0.05, Wilcoxon signed-rank test). On average, ‘Pre vs Post’ was 4.8% less than ‘Self Similarity’ (range 0.2–14%) while ‘Cross Similarity’ was 40% less than ‘Self Similarity’ (range 20.2–56.3%). These measures confirm the qualitative impression from Figure 2—figure supplement 1 that for most birds and syllables there were no greater changes to syllable structure following lesions than was present across control recordings, and that pre-post similarity remained higher than cross-similarity, that is, syllables remained clearly identifiable. Boxes mark interquartile range and whiskers mark data within one additional interquartile range.
Figure 2—figure supplement 3
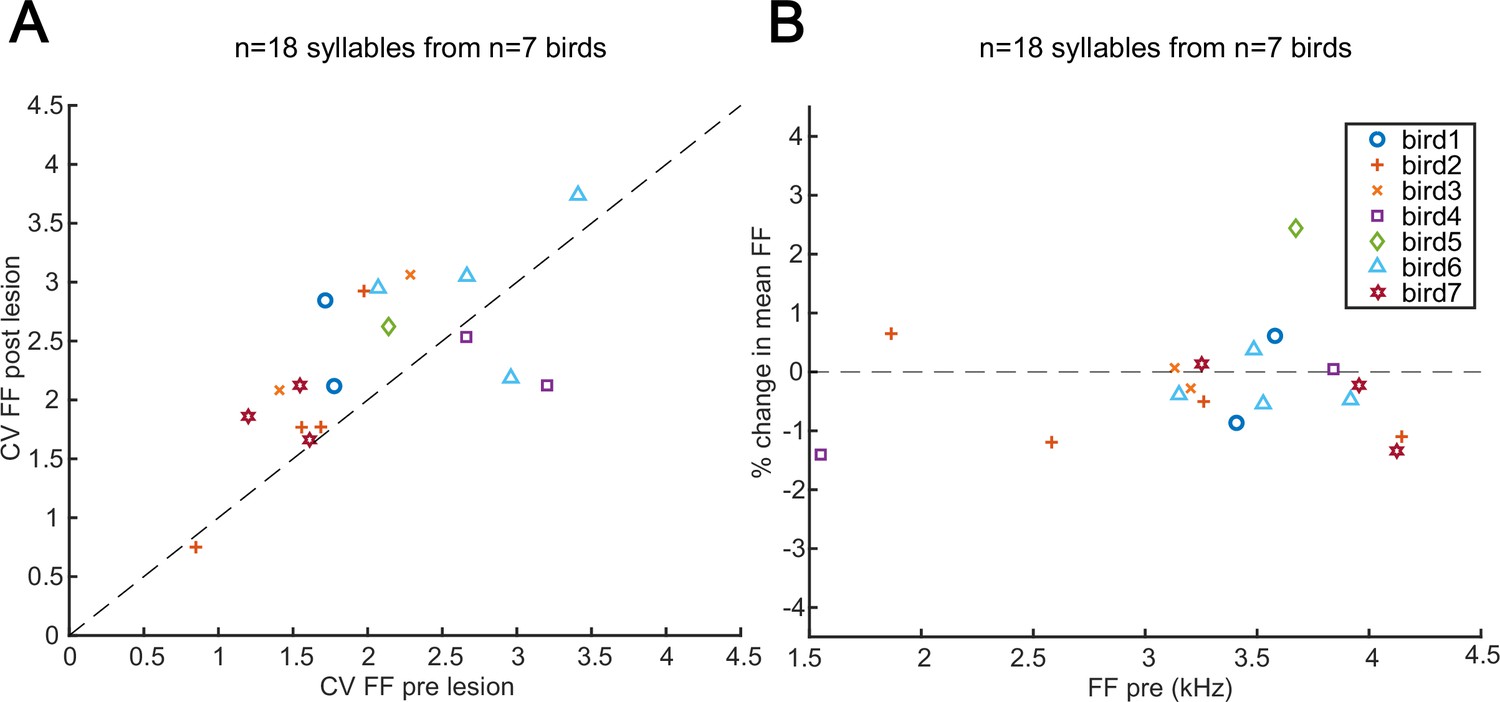
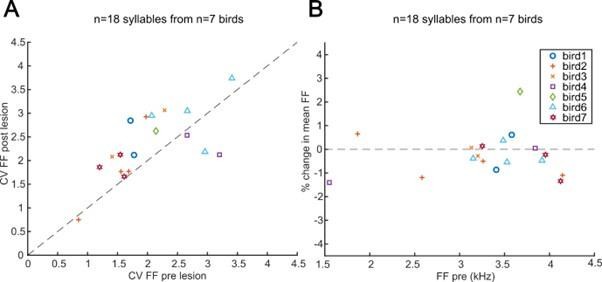
Changes in pitch variation following mMAN lesions to control for lMAN damage.
(A) Coefficient of variation (CV) of fundamental frequency (FF) of select syllables before and after medial magnocellular nucleus of the anterior nidopallium (mMAN) lesions. In the Bengalese finch and zebra finch, lesions of lateral magnocellular nucleus of the anterior nidopallium (lMAN), which sits immediately lateral to mMAN, cause a consistent reduction in the CV of fundamental frequency across repeated renditions of a given syllable (Sakata et al., 2008; Andalman and Fee, 2009; Warren et al., 2011). We therefore supposed that unintended damage to lMAN or its projections to RA might have resulted in a reduction in the CV of syllables following mMAN lesions. Instead, we saw a modest increase in the CV of fundamental frequency (p<0.05, Wilcoxon signed-rank test; mean across birds of +20%; range –19 to +43%). These data suggest that it is unlikely that changes to syllable structure might have arisen due to accidental damage to lMAN. (B) Percent change in mean fundamental frequency after mMAN lesions vs mean fundamental frequency before mMAN lesions.
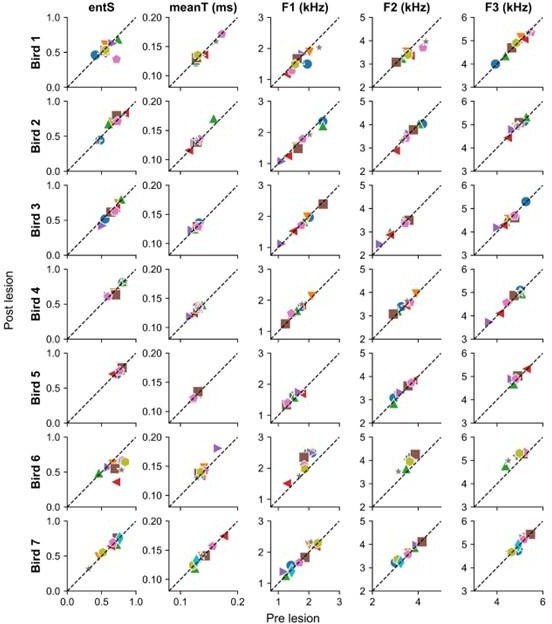
Figure 2—figure supplement 4
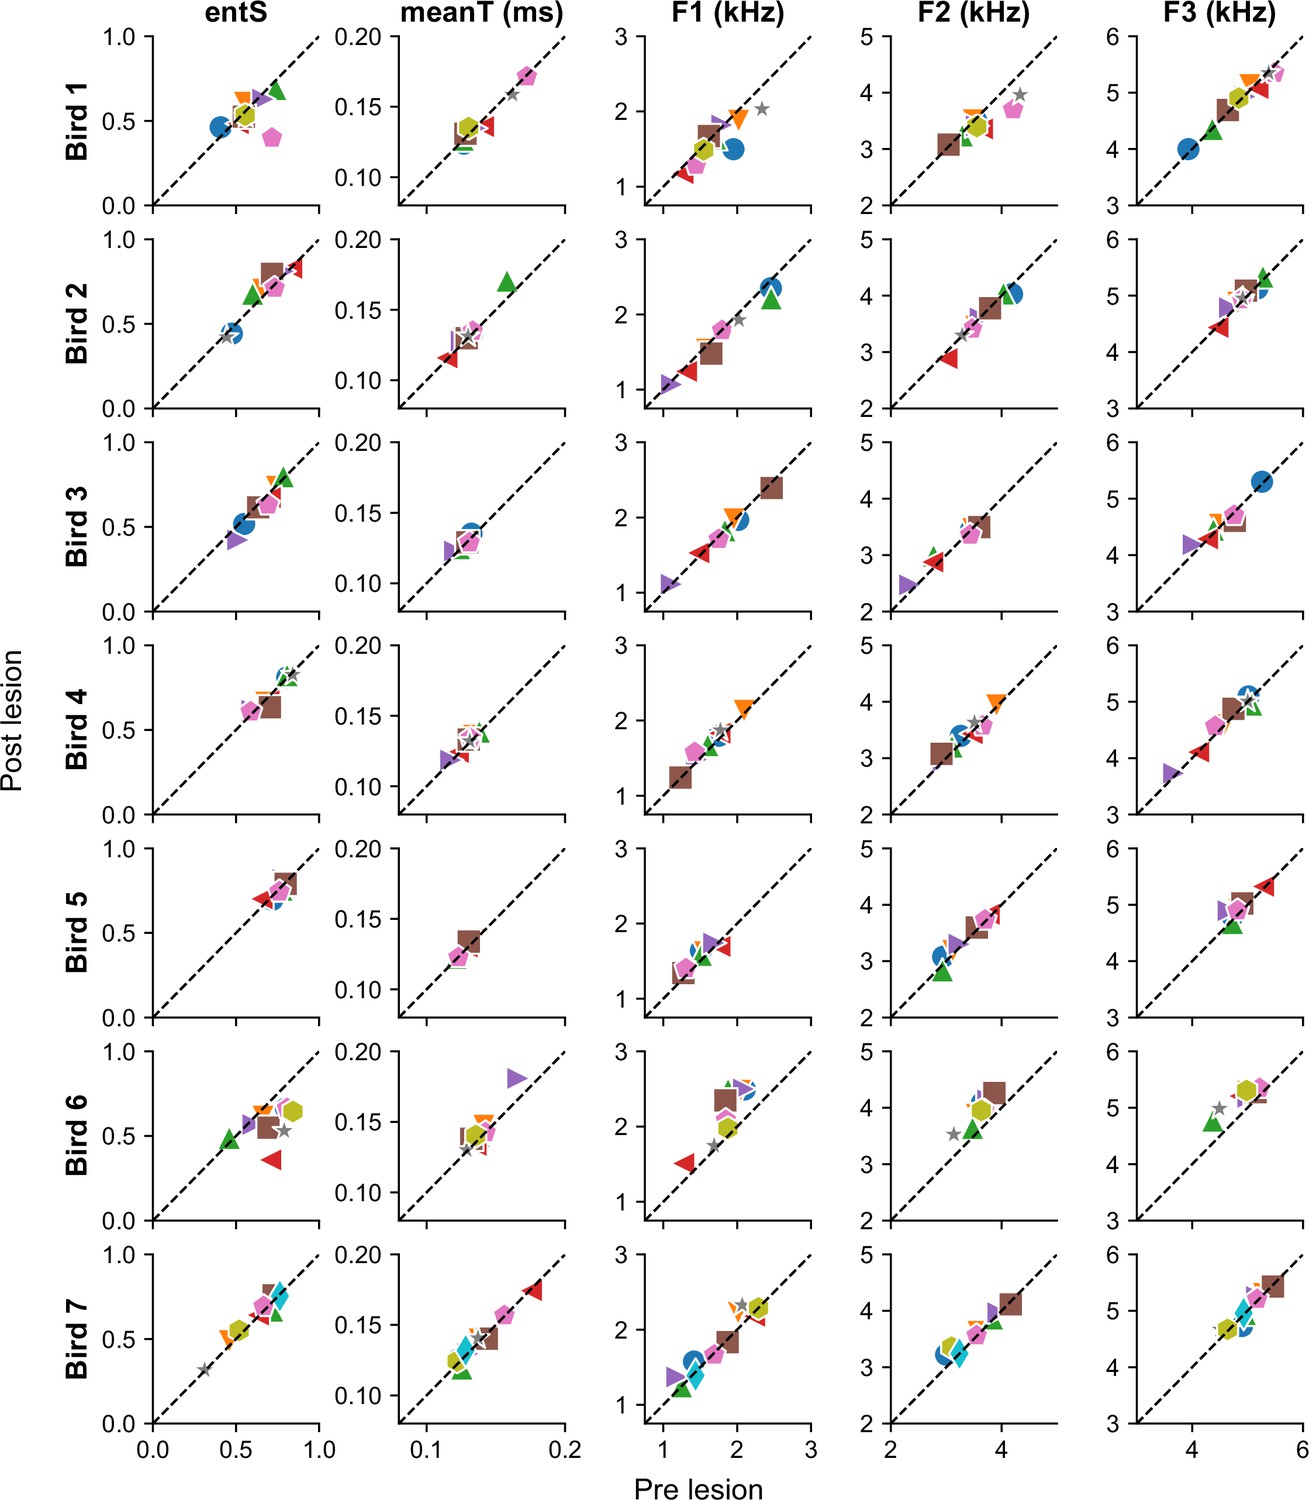
Selected acoustic features for all syllables in all birds before and after medial magnocellular nucleus of the anterior nidopallium (mMAN) lesions.
Different colors represent different syllable types per bird. ‘entS’ = entropy of spectral envelope, ‘meanT’ = temporal centroid for temporal envelope, ‘F1’ = first formant, ‘F2’ = second formant, ‘F3’ = third formant. Acoustic features generally showed little change between pre- and post-lesion songs. They highlight as relative outliers the same individual examples that stand out in the average spectrograms in Figure 2—figure supplement 1.
-
Figure 2—figure supplement 4—source data 1
Spectral features data for generating Figure 2—figure supplement 4 for bird 1.
- https://cdn.elifesciences.org/articles/93272/elife-93272-fig2-figsupp4-data1-v1.csv
-
Figure 2—figure supplement 4—source data 2
Spectral features data for generating Figure 2—figure supplement 4 for bird 2.
- https://cdn.elifesciences.org/articles/93272/elife-93272-fig2-figsupp4-data2-v1.csv
-
Figure 2—figure supplement 4—source data 3
Spectral features data for generating Figure 2—figure supplement 4 for bird 3.
- https://cdn.elifesciences.org/articles/93272/elife-93272-fig2-figsupp4-data3-v1.csv
-
Figure 2—figure supplement 4—source data 4
Spectral features data for generating Figure 2—figure supplement 4 for bird 4.
- https://cdn.elifesciences.org/articles/93272/elife-93272-fig2-figsupp4-data4-v1.csv
-
Figure 2—figure supplement 4—source data 5
Spectral features data for generating Figure 2—figure supplement 4 for bird 5.
- https://cdn.elifesciences.org/articles/93272/elife-93272-fig2-figsupp4-data5-v1.csv
-
Figure 2—figure supplement 4—source data 6
Spectral features data for generating Figure 2—figure supplement 4 for bird 6.
- https://cdn.elifesciences.org/articles/93272/elife-93272-fig2-figsupp4-data6-v1.csv
-
Figure 2—figure supplement 4—source data 7
Spectral features data for generating Figure 2—figure supplement 4 for bird 7.
- https://cdn.elifesciences.org/articles/93272/elife-93272-fig2-figsupp4-data7-v1.csv
-
Figure 2—figure supplement 4—source code 1
Code for generating Figure 2—figure supplement 4 based on data from Figure 2—figure supplement 4—source data 1.
- https://cdn.elifesciences.org/articles/93272/elife-93272-fig2-figsupp4-code1-v1.zip
Figure 2—figure supplement 5

Change in transition entropy for branchpoints.
(A) Transition entropy for all individual branchpoints after medial magnocellular nucleus of the anterior nidopallium (mMAN) lesions. (B) Branchpoints with low history dependence before mMAN lesions showed a nonsignificant trend towards higher changes in transition entropy.
-
Figure 2—figure supplement 5—source code 1
Code for generating Figure 2—figure supplement 5B based on data from Source data 1 - Source data 28.
- https://cdn.elifesciences.org/articles/93272/elife-93272-fig2-figsupp5-code1-v1.zip
-
Figure 2—figure supplement 5—source code 2
Code for generating Figure 2—figure supplement 5A based on data from Source data 1 - Source data 28.
- https://cdn.elifesciences.org/articles/93272/elife-93272-fig2-figsupp5-code2-v1.zip
Figure 3 with 1 supplement
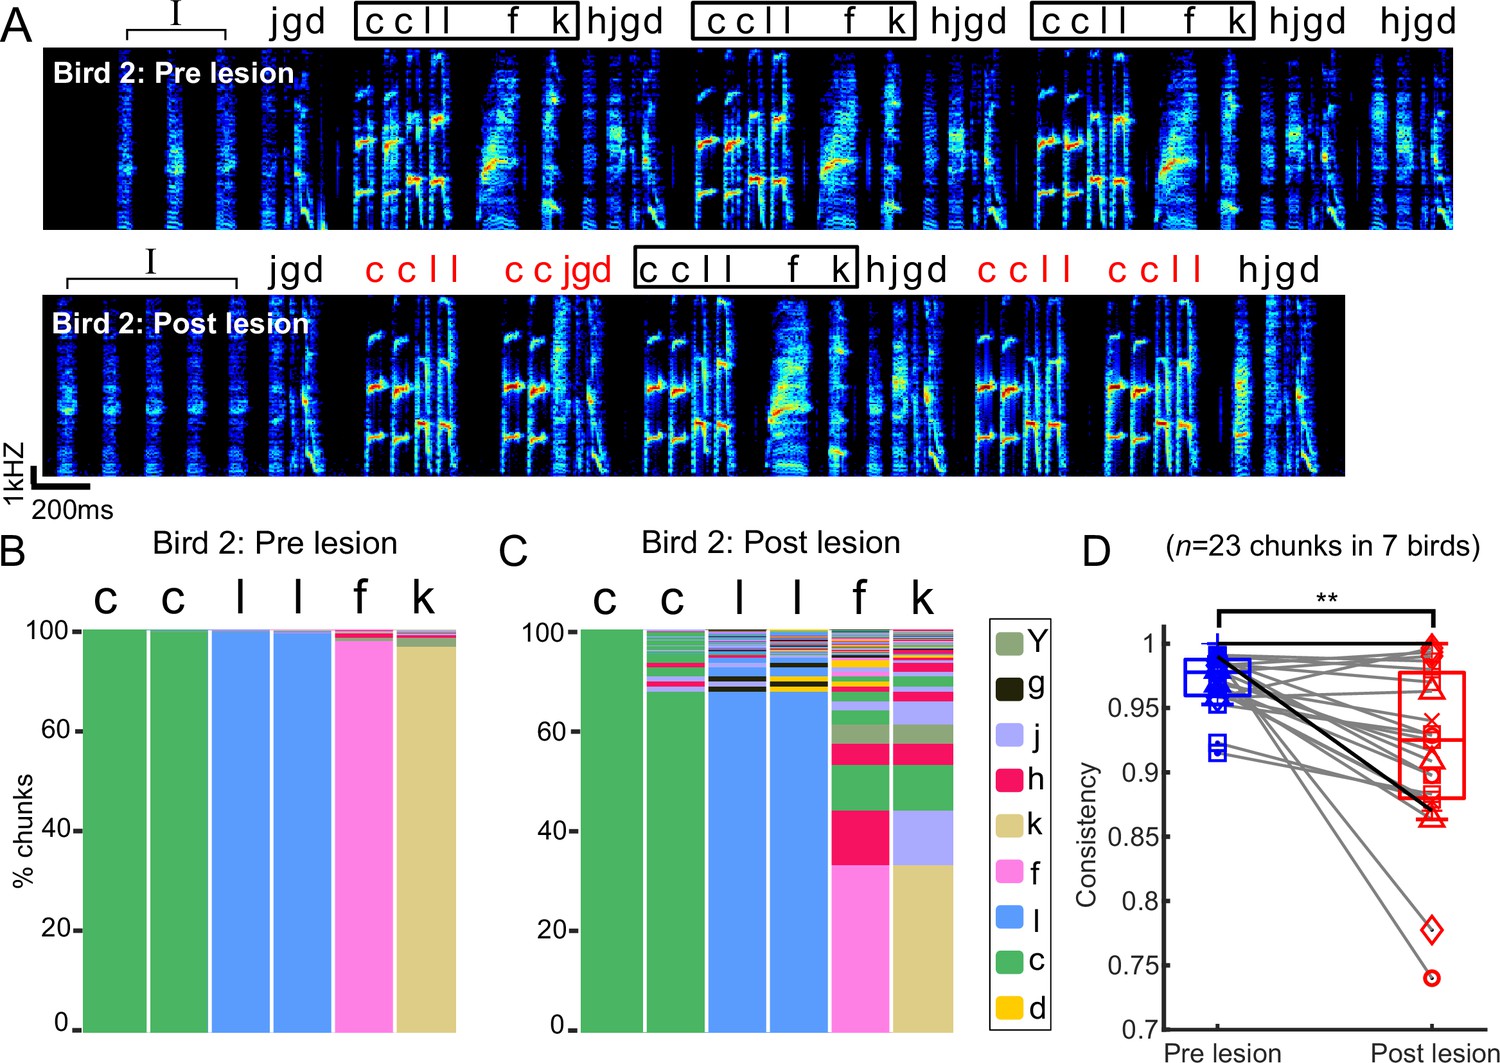
Chunks became more variable after bilateral medial magnocellular nucleus of the anterior nidopallium (mMAN) lesions.
(A) Example spectrogram (bird 2) before and after bilateral mMAN lesions. Atypical chunk sequences are highlighted in red. (B, C) Transitions following the first ‘c’ of the ‘ccllfk’ chunk from (A) before and after mMAN lesions. Different column colors represent different syllables. (D) Chunk consistency before and after bilateral mMAN lesions (**p<0.01, n = 23, Wilcoxon signed-rank test). Example bird is shown as darker line. Boxes show interquartile range and whiskers mark data points within one additional interquartile range.
-
Figure 3—source code 1
Code for generating Figure 3D based on data from Source data 1 - Source data 28.
- https://cdn.elifesciences.org/articles/93272/elife-93272-fig3-code1-v1.zip
-
Figure 3—source code 2
Code for generating Figure 3B and C based on data from Source data 1 - Source data 28.
- https://cdn.elifesciences.org/articles/93272/elife-93272-fig3-code2-v1.zip
Figure 3—figure supplement 1
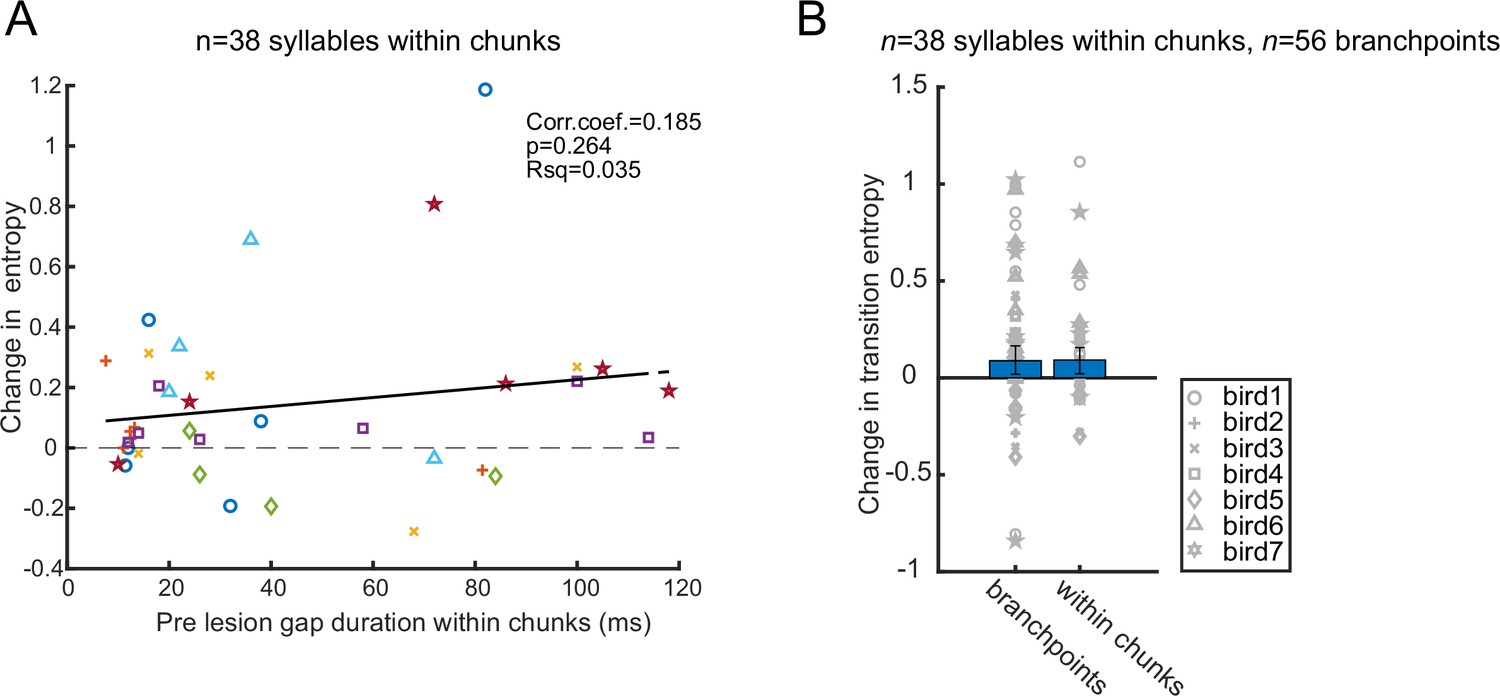
Change in transition entropy for transitions within chunks vs. branch points.
(A) Duration of gaps within chunks before medial magnocellular nucleus of the anterior nidopallium (mMAN) lesions was not significantly correlated with entropy change at the corresponding transition (p>0.05, Wilcoxon rank-sum test). (B) Change in transition entropy was not significantly different for transitions within chunks and at branchpoints (p>0.05, Wilcoxon rank-sum test, n=94). Error bars show standard error of the mean.
-
Figure 3—figure supplement 1—source data 1
Median gap durations for generating Figure 3—figure supplement 1 for bird 1.
- https://cdn.elifesciences.org/articles/93272/elife-93272-fig3-figsupp1-data1-v1.csv
-
Figure 3—figure supplement 1—source data 2
Median change in transition entropy for generating Figure 3—figure supplement 1 for bird 1.
- https://cdn.elifesciences.org/articles/93272/elife-93272-fig3-figsupp1-data2-v1.csv
-
Figure 3—figure supplement 1—source data 3
Median gap durations for generating Figure 3—figure supplement 1 for bird 2.
- https://cdn.elifesciences.org/articles/93272/elife-93272-fig3-figsupp1-data3-v1.csv
-
Figure 3—figure supplement 1—source data 4
Median change in transition entropy for generating Figure 3—figure supplement 1 for bird 2.
- https://cdn.elifesciences.org/articles/93272/elife-93272-fig3-figsupp1-data4-v1.csv
-
Figure 3—figure supplement 1—source data 5
Median gap durations for generating Figure 3—figure supplement 1 for bird 3.
- https://cdn.elifesciences.org/articles/93272/elife-93272-fig3-figsupp1-data5-v1.csv
-
Figure 3—figure supplement 1—source data 6
Median change in transition entropy for generating Figure 3—figure supplement 1 for bird 3.
- https://cdn.elifesciences.org/articles/93272/elife-93272-fig3-figsupp1-data6-v1.csv
-
Figure 3—figure supplement 1—source data 7
Median gap durations for generating Figure 3—figure supplement 1 for bird 4.
- https://cdn.elifesciences.org/articles/93272/elife-93272-fig3-figsupp1-data7-v1.csv
-
Figure 3—figure supplement 1—source data 8
Median change in transition entropy for generating Figure 3—figure supplement 1 for bird 4.
- https://cdn.elifesciences.org/articles/93272/elife-93272-fig3-figsupp1-data8-v1.csv
-
Figure 3—figure supplement 1—source data 9
Median gap durations for generating Figure 3—figure supplement 1 for bird 5.
- https://cdn.elifesciences.org/articles/93272/elife-93272-fig3-figsupp1-data9-v1.csv
-
Figure 3—figure supplement 1—source data 10
Median change in transition entropy for generating Figure 3—figure supplement 1 for bird 5.
- https://cdn.elifesciences.org/articles/93272/elife-93272-fig3-figsupp1-data10-v1.csv
-
Figure 3—figure supplement 1—source data 11
Median gap durations for generating Figure 3—figure supplement 1 for bird 6.
- https://cdn.elifesciences.org/articles/93272/elife-93272-fig3-figsupp1-data11-v1.csv
-
Figure 3—figure supplement 1—source data 12
Median change in transition entropy for generating Figure 3—figure supplement 1 for bird 6.
- https://cdn.elifesciences.org/articles/93272/elife-93272-fig3-figsupp1-data12-v1.csv
-
Figure 3—figure supplement 1—source data 13
Median gap durations for generating Figure 3—figure supplement 1 for bird 7.
- https://cdn.elifesciences.org/articles/93272/elife-93272-fig3-figsupp1-data13-v1.csv
-
Figure 3—figure supplement 1—source data 14
Median change in transition entropy for generating Figure 3—figure supplement 1 for bird 7.
- https://cdn.elifesciences.org/articles/93272/elife-93272-fig3-figsupp1-data14-v1.csv
-
Figure 3—figure supplement 1—source code 1
Code for generating Figure 3—figure supplement 1 based on data from Figure 3—figure supplement 1—source data 1.
- https://cdn.elifesciences.org/articles/93272/elife-93272-fig3-figsupp1-code1-v1.zip
Figure 4

The number of syllables per repeat phrase (repeat number) became more variable after bilateral medial magnocellular nucleus of the anterior nidopallium (mMAN) lesions.
(A) Example spectrogram (bird 6) highlighting one repeat syllable before (blue) and after (red) mMAN lesions. (B) Repeat numbers for two additional example birds before (blue) and after (red) mMAN lesions. (C) Average repeat numbers before and after mMAN lesions for all repeat phrases (p>0.05, n=6, Wilcoxon signed rank test). Boxes mark interquartile range and whiskers mark data points within one additional interquartile range. (D) Coefficient of variation for distribution of repeat numbers before and after mMAN lesions for all repeat phrases (p<0.05, n=6, Wilcoxon signed rank test). Example birds from (B) are shown as darker lines. Boxes mark interquartile range and whiskers mark data points within one additional interquartile range.
-
Figure 4—source code 1
Code for generating Figure 4B based on data from Source data 1 - Source data 28.
- https://cdn.elifesciences.org/articles/93272/elife-93272-fig4-code1-v1.zip
-
Figure 4—source code 2
Code for generating Figure 4D based on data from Source data 1 - Source data 28.
- https://cdn.elifesciences.org/articles/93272/elife-93272-fig4-code2-v1.zip
-
Figure 4—source code 3
Code for generating Figure 4C based on data from Source data 1 - Source data 28.
- https://cdn.elifesciences.org/articles/93272/elife-93272-fig4-code3-v1.zip
Author response image 1
Syllable similarity calculated using Sound Analysis Pro (SAP).
‘Self Similarity’ = Similarity comparison of syllables before mMAN lesions to syllables of the same type, taken from two separate control recordings before the lesions, ‘Pre vs Post’ = Similarity comparison of the same syllable types before and after mMAN lesions, ‘Cross Similarity’ = Similarity comparison of each syllable type to other syllable types. For Birds 1-2 and 4-7, ‘Self Similarity’ was not significantly different from ‘Pre vs Post’ Similarity (p>0.05, Wilcoxon sign rank test), while for Bird 3, there was a significant difference (p = 0.03, Wilcoxon sign rank test). For all birds ‘Pre vs Post’ was significantly different from ‘Cross Similarity’ (p<0.05, Wilcoxon sign rank test). On average, ‘Pre vs Post’ was 4.8 % less than ‘Self Similarity’ (range 0.2%-14%) while ‘Cross Similarity’ was 40% less than ‘Self Similarity’ (range 20.2%-56.3%). These measures confirm the qualitative impression from Figure 2- figure supplement 1 that for most birds and syllables there were no greater changes to syllable structure following lesions than was present across control recordings, and that pre-post similarity remained higher than cross-similarity, i.e. syllables remained clearly identifiable.
Author response image 2
(A) CV of fundamental frequency (FF) of select syllables before and after mMAN lesions. In the Bengalese finch and zebra finch, lesions of lMAN, which sits immediately lateral to mMAN, cause a consistent reduction in the coefficient of variation (CV) of fundamental frequency across repeated renditions of a given syllable (Sakata, Hampton, Brainard 2008, Andalman, Fee 2009, Warren et al. 2011). We therefore supposed that unintended damage to lMAN or its projections to RA might have resulted in a reduction in the CV of syllables following mMAN lesions. Instead we saw a modest increase in the CV of fundamental frequency (p<0.05, Wilcoxon sign rank test; mean across birds of +20%; range -19 to +43%). These data suggest that it is unlikely that changes to syllable structure might have arisen due to accidental damage to lMAN. (B) Percent change in mean fundamental frequency aqer mMAN lesions vs mean fundamental frequency before mMAN lesions.
Author response image 3
Selected acoustic features for all syllables in all birds before and after mMAN lesions.
Different colors represent different syllable types per bird. ‘entS’ = Entropy of spectral envelope, ‘meanT’ = Temporal centroid for temporal envelope, ‘F1’ = First formant, ‘F2’ = Second formant, ‘F3’ = Third formant. Acoustic features generally showed little change between pre and post lesion songs. They highlight as relative outliers the same individual examples that stand out in the average spectrograms in Figure 2 – figure supplement 1.
Author response image 4
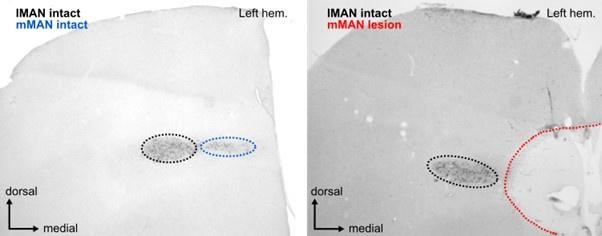
Image of calcitonin gene-related peptide (CGRP)-stained frontal section (left) control and (right) bird 5.
CGRP labels cells in both lMAN (seen in black to the left of the lesion) and mMAN (blue, intact; red, completely destroyed).
Tables
Key resources table
| Reagent type (species) or resource | Designation | Source or reference | Identifiers | Additional information |
|---|---|---|---|---|
| Antibody | Anti-CGRP antibody (rabbit polyclonal) | Sigma-Aldrich, St. Louis, MO; 10.1159/000113342 | Dilution 1:10,000 | |
| Software, algorithm | Custom recording software, LabView | 10.1038/nature06390 | ||
| Software, algorithm | Sound Analysis Pro software | 10.1006/anbe.1999.1416 | ||
| Software, algorithm | SoundSig sound analysis package | 10.1007/s10071-015-0933-6 | ||
| Software, algorithm | TweetyNet sound annotation package | 10.7554/eLife.63853 |
Additional files
-
MDAR checklist
- https://cdn.elifesciences.org/articles/93272/elife-93272-mdarchecklist1-v1.pdf
-
Source data 1
Sequence data for bird 1 post lesion with introductory notes and repeats replaced.
- https://cdn.elifesciences.org/articles/93272/elife-93272-data1-v1.txt
-
Source data 2
Sequence data for bird 1 post lesion with only introductory notes replaced.
- https://cdn.elifesciences.org/articles/93272/elife-93272-data2-v1.txt
-
Source data 3
Sequence data for bird 1 pre lesion with introductory notes and repeats replaced.
- https://cdn.elifesciences.org/articles/93272/elife-93272-data3-v1.txt
-
Source data 4
Sequence data for bird 1 pre lesion with only introductory notes replaced.
- https://cdn.elifesciences.org/articles/93272/elife-93272-data4-v1.txt
-
Source data 5
Sequence data for bird 2 post lesion with introductory notes and repeats replaced.
- https://cdn.elifesciences.org/articles/93272/elife-93272-data5-v1.txt
-
Source data 6
Sequence data for bird 2 post lesion with only introductory notes replaced.
- https://cdn.elifesciences.org/articles/93272/elife-93272-data6-v1.txt
-
Source data 7
Sequence data for bird 2 pre lesion with introductory notes and repeats replaced.
- https://cdn.elifesciences.org/articles/93272/elife-93272-data7-v1.txt
-
Source data 8
Sequence data for bird 2 pre lesion with only introductory notes replaced.
- https://cdn.elifesciences.org/articles/93272/elife-93272-data8-v1.txt
-
Source data 9
Sequence data for bird 3 post lesion with introductory notes and repeats replaced.
- https://cdn.elifesciences.org/articles/93272/elife-93272-data9-v1.txt
-
Source data 10
Sequence data for bird 3 post lesion with only introductory notes replaced.
- https://cdn.elifesciences.org/articles/93272/elife-93272-data10-v1.txt
-
Source data 11
Sequence data for bird 3 pre lesion with introductory notes and repeats replaced.
- https://cdn.elifesciences.org/articles/93272/elife-93272-data11-v1.txt
-
Source data 12
Sequence data for bird 3 pre lesion with only introductory notes replaced.
- https://cdn.elifesciences.org/articles/93272/elife-93272-data12-v1.txt
-
Source data 13
Sequence data for bird 4 post lesion with introductory notes and repeats replaced.
- https://cdn.elifesciences.org/articles/93272/elife-93272-data13-v1.txt
-
Source data 14
Sequence data for bird 4 post lesion with only introductory notes replaced.
- https://cdn.elifesciences.org/articles/93272/elife-93272-data14-v1.txt
-
Source data 15
Sequence data for bird 4 pre lesion with introductory notes and repeats replaced.
- https://cdn.elifesciences.org/articles/93272/elife-93272-data15-v1.txt
-
Source data 16
Sequence data for bird 4 pre lesion with only introductory notes replaced.
- https://cdn.elifesciences.org/articles/93272/elife-93272-data16-v1.txt
-
Source data 17
Sequence data for bird 5 post lesion with introductory notes and repeats replaced.
- https://cdn.elifesciences.org/articles/93272/elife-93272-data17-v1.txt
-
Source data 18
Sequence data for bird 5 post lesion with only introductory notes replaced.
- https://cdn.elifesciences.org/articles/93272/elife-93272-data18-v1.txt
-
Source data 19
Sequence data for bird 5 pre lesion with introductory notes and repeats replaced.
- https://cdn.elifesciences.org/articles/93272/elife-93272-data19-v1.txt
-
Source data 20
Sequence data for bird 5 pre lesion with only introductory notes replaced.
- https://cdn.elifesciences.org/articles/93272/elife-93272-data20-v1.txt
-
Source data 21
Sequence data for bird 6 post lesion with introductory notes and repeats replaced.
- https://cdn.elifesciences.org/articles/93272/elife-93272-data21-v1.txt
-
Source data 22
Sequence data for bird 6 post lesion with only introductory notes replaced.
- https://cdn.elifesciences.org/articles/93272/elife-93272-data22-v1.txt
-
Source data 23
Sequence data for bird 6 pre lesion with introductory notes and repeats replaced.
- https://cdn.elifesciences.org/articles/93272/elife-93272-data23-v1.txt
-
Source data 24
Sequence data for bird 6 pre lesion with only introductory notes replaced.
- https://cdn.elifesciences.org/articles/93272/elife-93272-data24-v1.txt
-
Source data 25
Sequence data for bird 7 post lesion with introductory notes and repeats replaced.
- https://cdn.elifesciences.org/articles/93272/elife-93272-data25-v1.txt
-
Source data 26
Sequence data for bird 7 post lesion with only introductory notes replaced.
- https://cdn.elifesciences.org/articles/93272/elife-93272-data26-v1.txt
-
Source data 27
Sequence data for bird 7 pre lesion with introductory notes and repeats replaced.
- https://cdn.elifesciences.org/articles/93272/elife-93272-data27-v1.txt
-
Source data 28
Sequence data for bird 7 pre lesion with only introductory notes replaced.
- https://cdn.elifesciences.org/articles/93272/elife-93272-data28-v1.txt
Download links
A two-part list of links to download the article, or parts of the article, in various formats.
Downloads (link to download the article as PDF)
Open citations (links to open the citations from this article in various online reference manager services)
Cite this article (links to download the citations from this article in formats compatible with various reference manager tools)
Lesions in a songbird vocal circuit increase variability in song syntax
eLife 13:RP93272.
https://doi.org/10.7554/eLife.93272.3


