Inhibitory G proteins play multiple roles to polarize sensory hair cell morphogenesis
- The Jackson Laboratory, United States
- Tufts University School of Medicine, United States
Figures
Figure 1

Summary of GNAI-related functions proposed previously in hair cells (HC).
(A) Phylogenetic tree of GNAI/O proteins with percent amino acid identity (mouse). (B) Apical HC differentiation from symmetry breaking to hair bundle development. The distribution of the GPSM2-GNAI complex at the bare zone and stereocilia tips is indicated in orange. Arrows indicate off-center (left) and then inward (middle) movements of the basal body. (C) Defects observed with pertussis toxin (ptx) or when inactivating GNAI proteins. Defective off-center migration of the basal body and inverted OHC1–2 were only observed with ptx, respectively, in cochlear explants (in vitro) and by expressing the ptx catalytic subunit (ptxA) in vivo. Mouse knock-out (KO)s of Gnai genes were to date only reported to affect hair bundle morphogenesis. Known GNAI regulators that produce similar defects when inactivated are indicated on top for each type of defect. DKO, double KO.
Figure 2 with 1 supplement
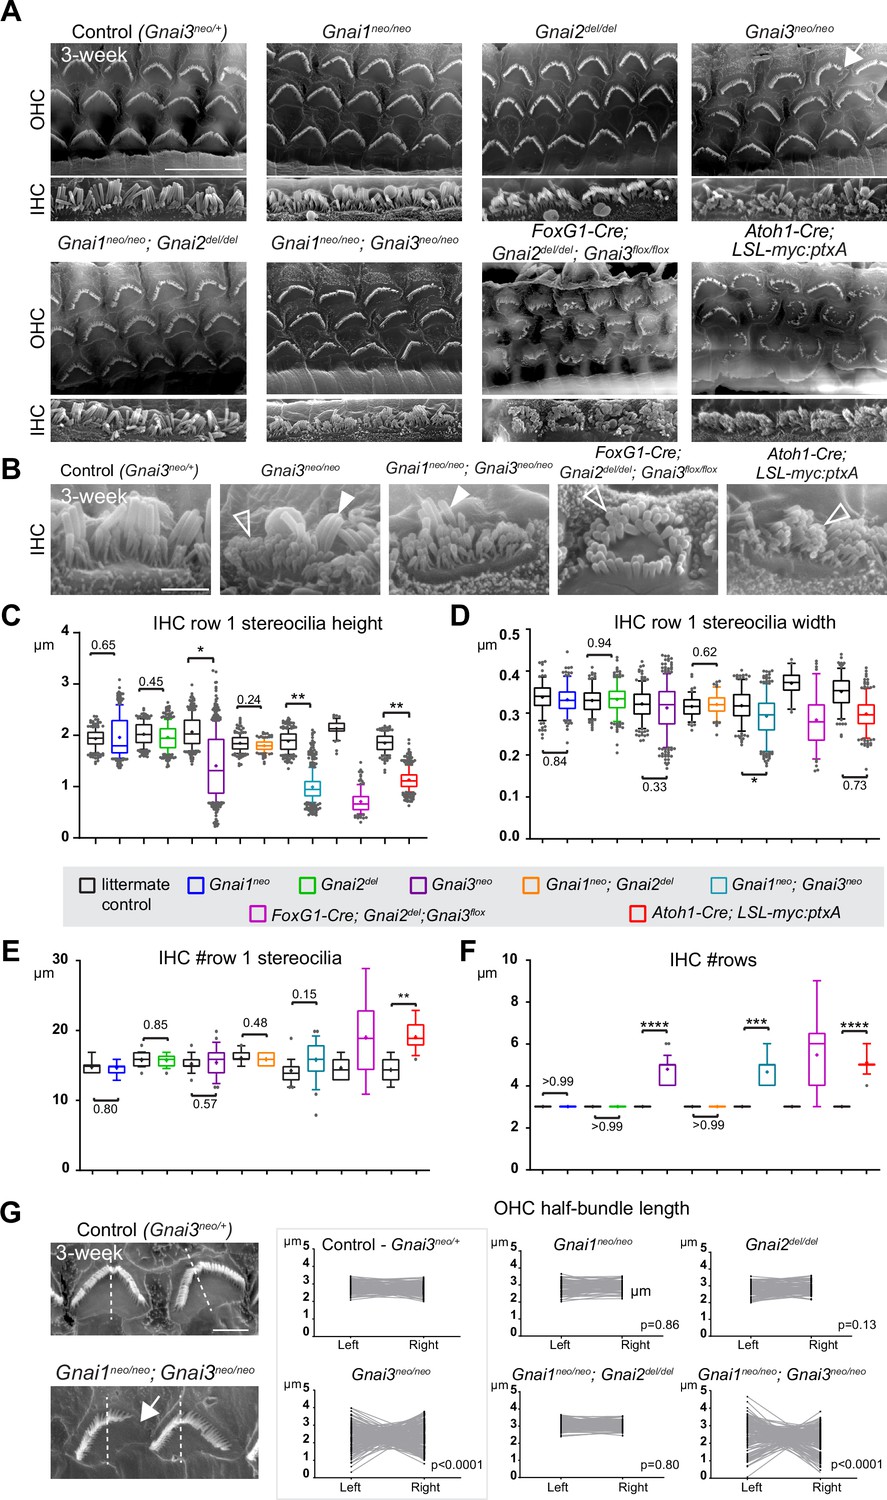
Individual GNAI proteins make different contributions to hair bundle development.
(A and B) Scanning electron microscopy (SEM) images of representative OHC (A) and IHC (B) in 3-week-old animals at the cochlear mid. Gnai1neo, Gnai2del, and Gnai1neo; Gnai2del mutants show apparently normal hair bundles in both HC types. In contrast, Gnai3neo and Gnai1neo; Gnai3neo mutants show defects in both HC types, including truncated hair bundles in OHC (arrow), as well as supernumerary rows of stunted (hollow arrowheads) or variable height stereocilia (full arrowheads) in IHC. In addition, in Foxg1-Cre; Gnai2del; Gnai3flox and Atoh1-Cre; LSL-myc:ptxA mutants, OHC1–2s are severely misoriented. (C–F) Quantification of various hair bundle features in 3-week-old IHC at the cochlear mid. Each mutant strain is compared to littermate controls (in black). At least 3 animals, 17 IHC, and 108 stereocilia are represented per condition, except for Foxg1-Cre; Gnai2del; Gnai3flox where we could only obtain a single adult animal due to postnatal lethality. Nested (hierarchical) t-test sorted by animal; p<0.0001****, p<0.001***, p<0.01**, p<0.05*; non-significant p-values are indicated. (G) SEM images of representative OHC showing a truncated hair bundle (arrow). Lengths of the left and right wing of the hair bundle were measured and plotted as paired values for the same OHC. A littermate control graph is only shown for Gnai3 mutants (Gnai3neo/+ controls). Littermate control graphs for the other mutants can be found in Figure 2—figure supplement 1G. p-values are for an F-test of variance of pooled left and right wing lengths compared to littermate controls. At least 3 animals and 88 OHC are represented per genotype. Only Gnai3 and Gnai1; Gnai3 mutants show truncated hair bundles and a significant p-value (p<0.05). Scale bars are 10 μm (A) and 2 μm (B, G). OHC, outer hair cell; IHC, inner hair cell.
Figure 2—figure supplement 1

New mouse strains generated, normal apical hair cell morphology in absence of GNAO and control littermate graphs for Figure 2G.
(A–D) New mouse strains generated in this study are Gnai2del (A), Gnai3flox (B), and Rosa26DIO-ptxA (D; see Methods for details). Rosa26LSL-myc:ptxA was published previously and is used in this study as well (C). (E and F) Loss of GNAO has no obvious impact on apical hair cell (HC) morphology or HC orientation. Representative confocal images of phalloidin-stained Gnao1 constitutive mutants at P21 (E; Gnao1neo) and scanning electron microscopy images of conditional Gnao1 inactivation in the Gnai1; Gnai3 double mutant background (F; Gnao1flox). In F, top panels compare control (left) and conditional Gnao1 inactivation (right) when GNAI1 and GNAI3 function is preserved. Bottom panels compare control (left) and conditional Gnao1 inactivation (right) when GNAI1 and GNAI3 are inactivated. Note how HC-specific inactivation of GNAO using the Atoh1-Cre driver does not obviously enhance defects observed in Gnai1; Gnai3 double mutants (F, bottom). (G) Graphs showing the length of the left and right wing of 3-week-old outer HC (OHC) hair bundles paired by cell. Graphs for control littermates that were omitted in Figure 2G are added here (left) next to repeated mutant graphs (right). p-values are for an F-test of variance of pooled left and right wing lengths compared to littermate controls. At least 3 animals and 88 OHC are represented per genotype. Only Gnai3neo (Figure 2G) and Gnai1neo; Gnai3neo mutants show truncated hair bundles and a significant p-value (p<0.05). Scale bars are 10 μm.
Figure 3 with 1 supplement
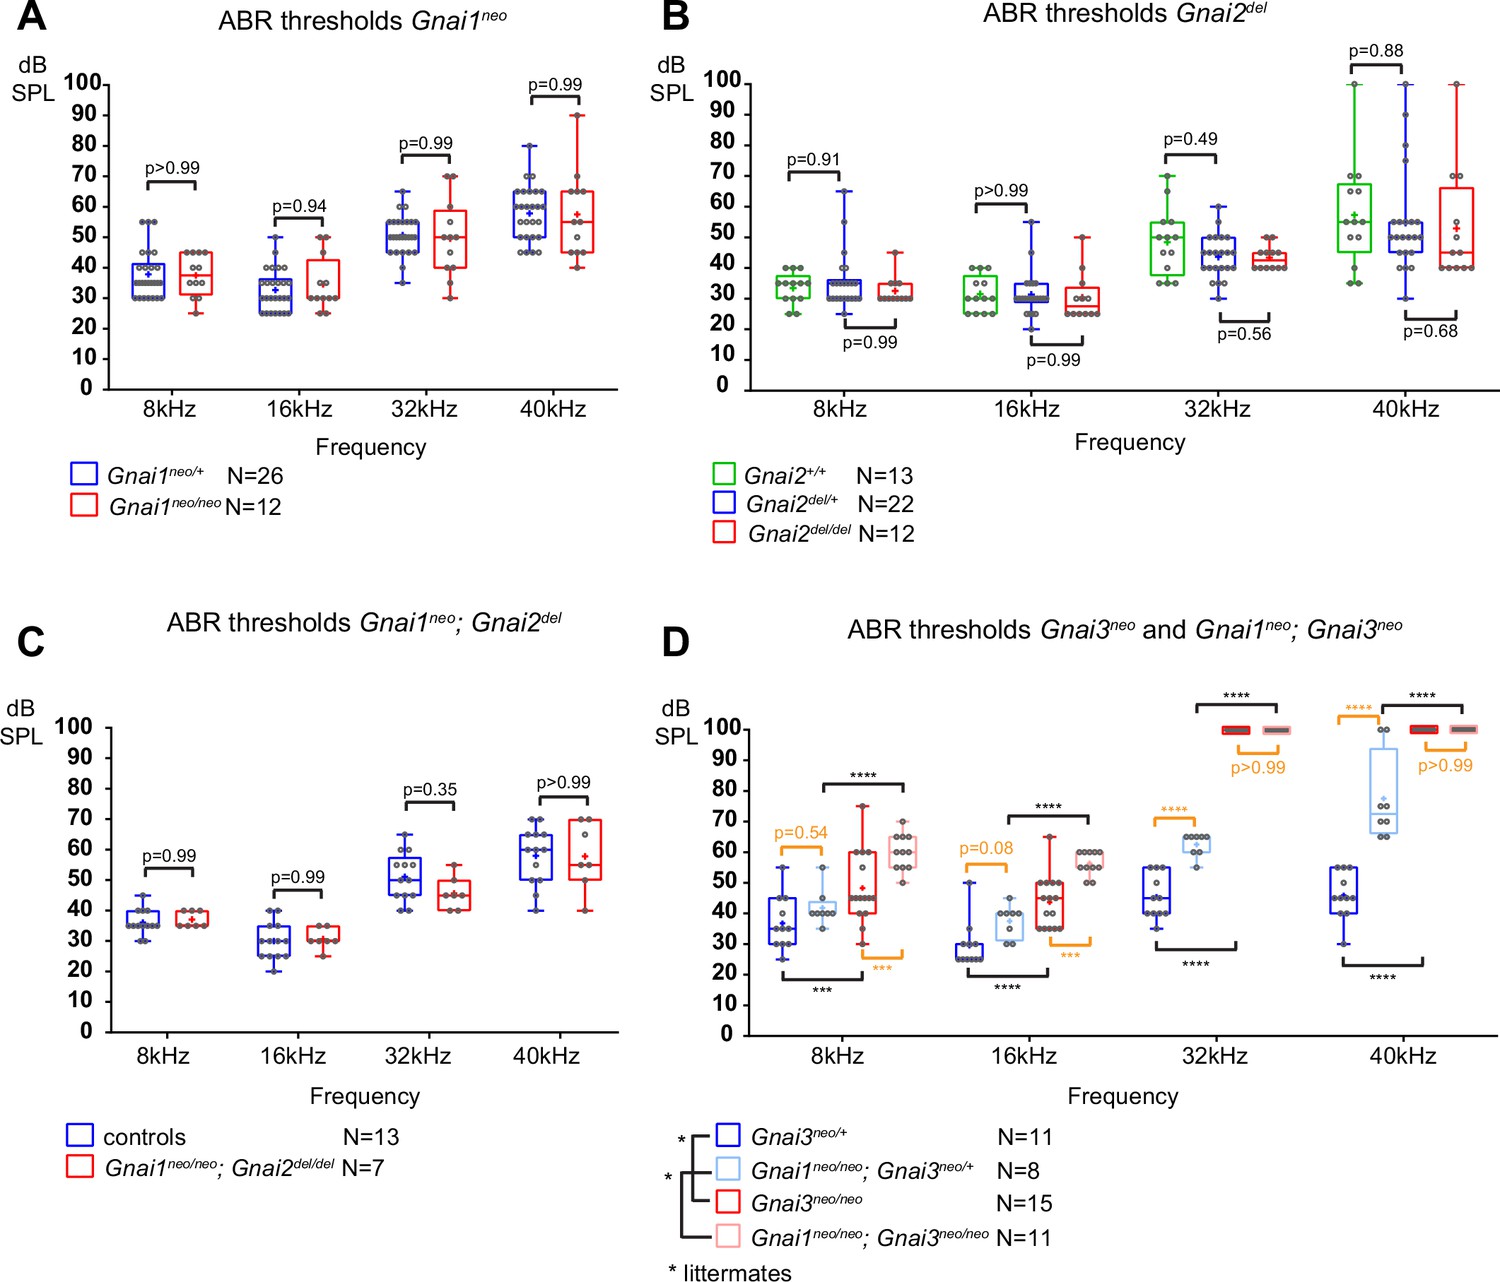
Loss of GNAI3 leads to hearing loss most severe at high frequencies.
(A–D) Auditory brainstem response (ABR) thresholds at 8, 16, 32, and 40 kHz for Gnai1neo (A), Gnai2del (B), Gnai1neo; Gnai2del (C), and Gnai3neo and Gnai1neo; Gnai3neo (D) mutants tested between P21 and P29. Boxplots are framed with 25–75% whisker boxes where exterior lines show the minimum and maximum values, the middle line represents the median, and + represent the mean. A plotted value of 100 dB indicates animals that did not respond to 90 dB stimuli. In (C), controls are a pool of Gnai1+/+; Gnai2del/+, Gnai1neo/+; Gnai2+/+, and Gnai1neo/+; Gnai2del/+ animals. N indicates the number of animals of both sexes tested. Two-way ANOVA with Sidak’s multiple comparison. p<0.0001****, p<0.001***; non-significant p-values are indicated. p-values in orange were obtained comparing non-littermate animals and suggest possibly raised thresholds when GNAI1 is inactivated in addition to GNAI3, or due to a difference in genetic background (see text). kHz, kiloHertz, dB SPL, decibel sound pressure level.
Figure 3—figure supplement 1

Loss of GNAO does not impact hearing thresholds.
(A and B) Auditory brainstem response (ABR) thresholds at 8, 16, 32 kHz for constitutive Gnao1 (A) and conditional Atoh1-Cre; Gnao1flox/flox (B) mutants tested between P20 and P25. Boxplots are framed with 25–75% whisker boxes where exterior lines show the minimum and maximum values, the middle line represents the median, and + represent the mean. N indicates the number of animals tested. In (B), because the original animal cohort was established to test whether the loss of GNAO could enhance defects in Gnai1; Gnai3 double mutants (see Figure 2—figure supplement 1F), controls include the following genotypes: Atoh1-Cre; Gnao1flox/+, Gnao1flox/flox, Gnai1neo/+; Gnai3neo/+, Gnai1neo/+, Atoh1-Cre; Gnao1flox/+; Gnai1neo/neo; Gnai3neo/+ and Gnai1neo/neo; Gnai3neo/+ where other alleles are wild-type. Mutants include the following: Atoh1-Cre; Gnao1flox/flox; Gnai3neo/+ and Atoh1-Cre; Gnao1flox/flox; Gnai1neo/neo; Gnai3neo/+ where other alleles are wild-type. Two-way ANOVA with Sidak’s multiple comparison. Non-significant p-values are indicated. kHz, kiloHertz, dB SPL, decibel sound pressure level.
Figure 4 with 1 supplement
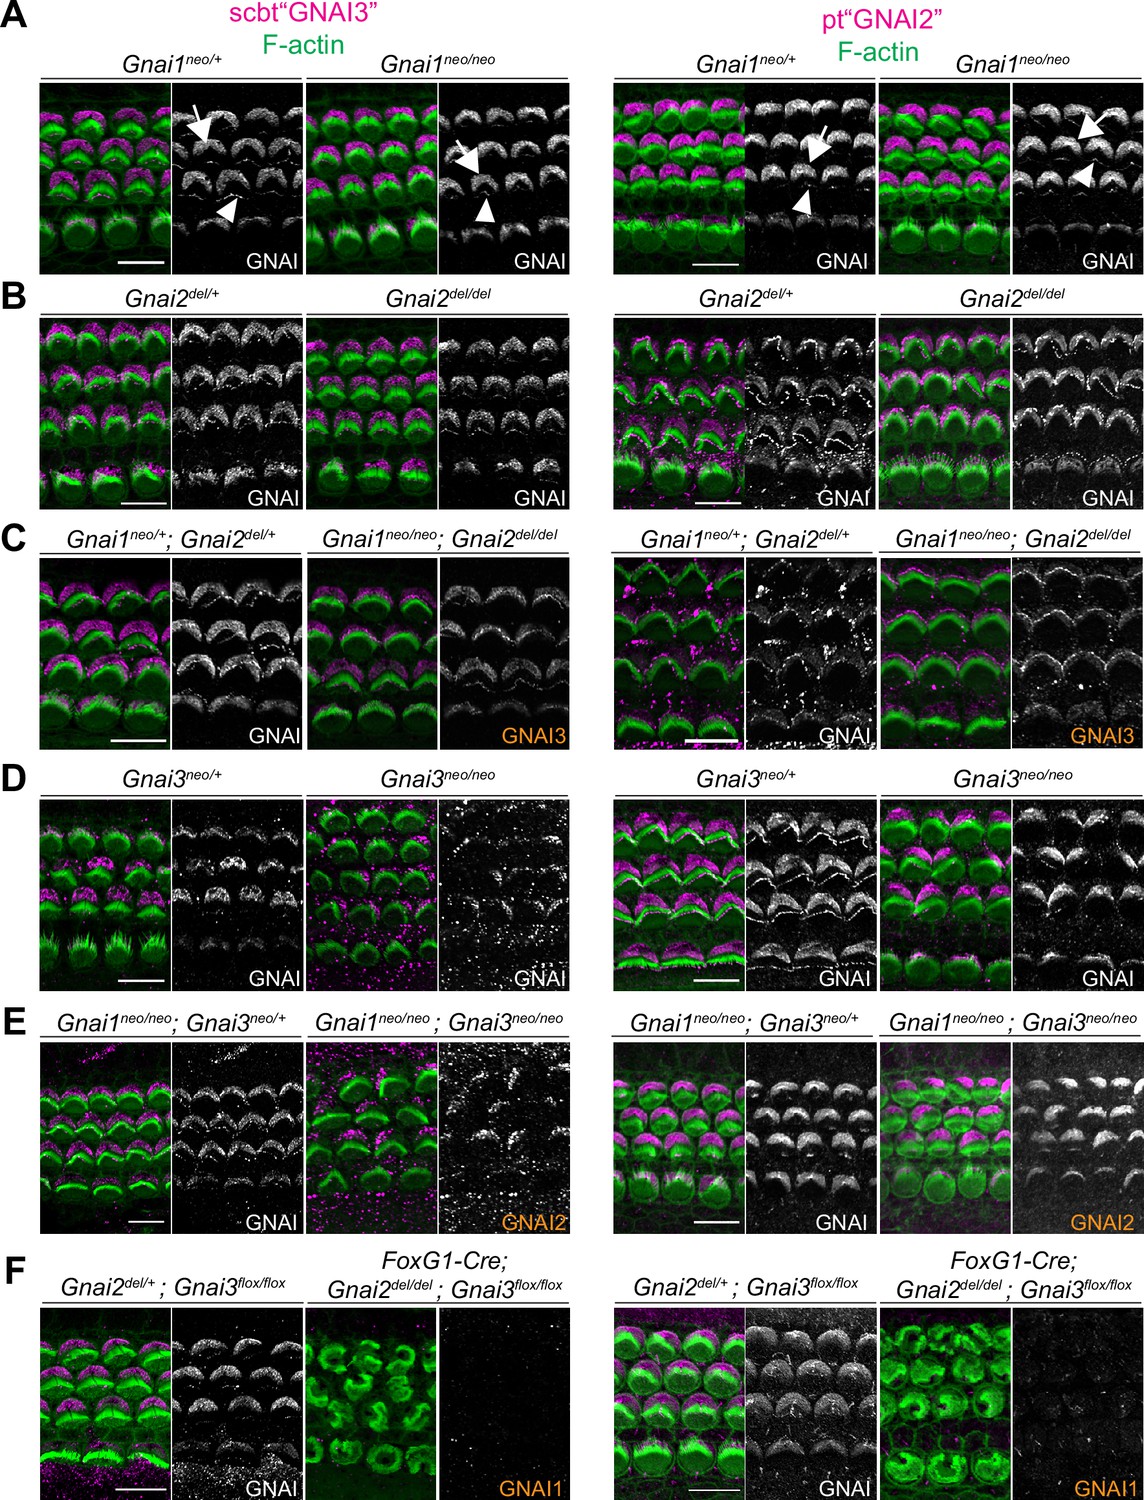
Systematic immunolabeling of GNAI proteins in Gnai mutant strains.
(A–F) Two different antibodies (scbt"GNAI3" and pt"GNAI2") were used to label the auditory epithelium at P0-P3. GNAI proteins were detected at the bare zone (arrows) and at stereocilia tips (arrowheads). Neither antibody is specific for its protein target, as scbt"GNAI3" is able to detect GNAI2 (E) and pt"GNAI2" is able to detect GNAI3 (C). Note how no apical GNAI signal is visible with either antibody in Gnai2; Gnai3 double mutants (F), showing that GNAI1 is not enriched apically in HC (see Figure 4—figure supplement 1A and B for evidence that pt"GNAI2" detects GNAI1). When the identity of the GNAI protein detected is unambiguous based on genotype, it is made explicit in orange. Scale bars are 10 µm.
Figure 4—figure supplement 1
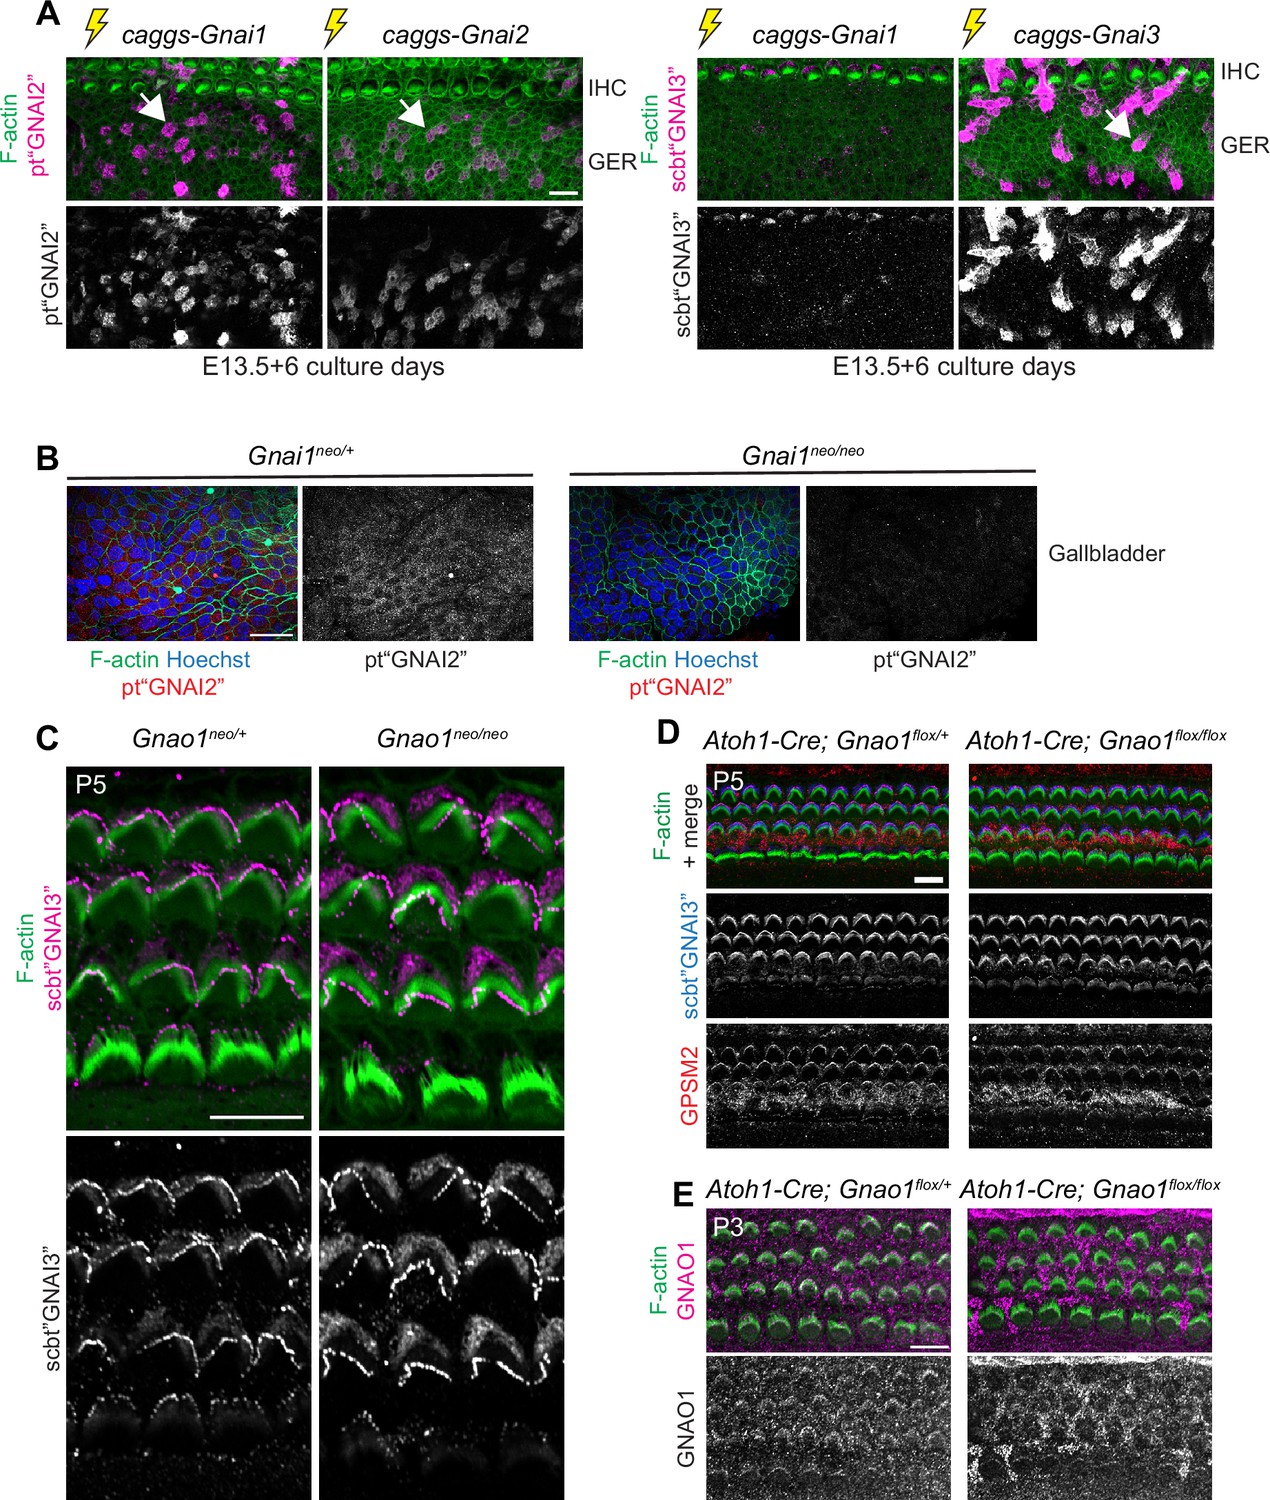
GNAI1 detection by Proteintech GNAI2 antibody, GNAI protein distribution in Gnao1 mutants, and lack of evidence for GNAO enrichment at the hair cell apex.
(A) Cochlear explants electroporated at embryonic day (E) 13.5 with the Gnai constructs indicated and cultured for 6 days before immunolabeling with Proteintech (pt"GNAI2"; left) or Santa Cruz Biotechnology (scbt"GNAI3"; right) GNAI antibodies (maximum projections). pt"GNAI2" efficiently detects ectopically expressed GNAI1 (and GNAI2, as expected), but scbt"GNAI3" only weakly detects GNAI1 (and efficiently detects GNAI3, as expected). The greater epithelial ridge (GER) is imaged with IHC on top. Caggs: CMV early enhancer/beta-actin promoter expression vector. Results are representative of three independent explants. (B) pt"GNAI2" immunolabeling of the adult gallbladder epithelium (maximum projection) where specific Gnai1 expression was reported in the Gnai1tm1a(EUCOMM)Wtsi mouse strain (International Mouse Phenotyping Consortium; mousephenotype.org). Apical signals are reduced in Gnai1 mutants, confirming that the pt"GNAI2" antibody can detect endogenous GNAI1. (C and D) GNAI (scbt"GNAI3" antibody; see Figure 4) immunolabeling in P5 Gnao1 constitutive (C) and Atoh1-Cre; Gnao1flox conditional (D) mutants at the cochlear base. Enrichment of GNAI (C–D) and GPSM2 (D) at the bare zone and stereocilia tips is unchanged in absence of GNAO. (E) GNAO immunolabeling at the P3 cochlear mid produces signals that are unspecific since they are unchanged in conditional Gnao1 mutants. Scale bars are 10 μm (A, C–E) and 25 µm (B).
Figure 5 with 1 supplement
GNAI2 only partially rescues loss of GNAI3 in individual postnatal hair cells.
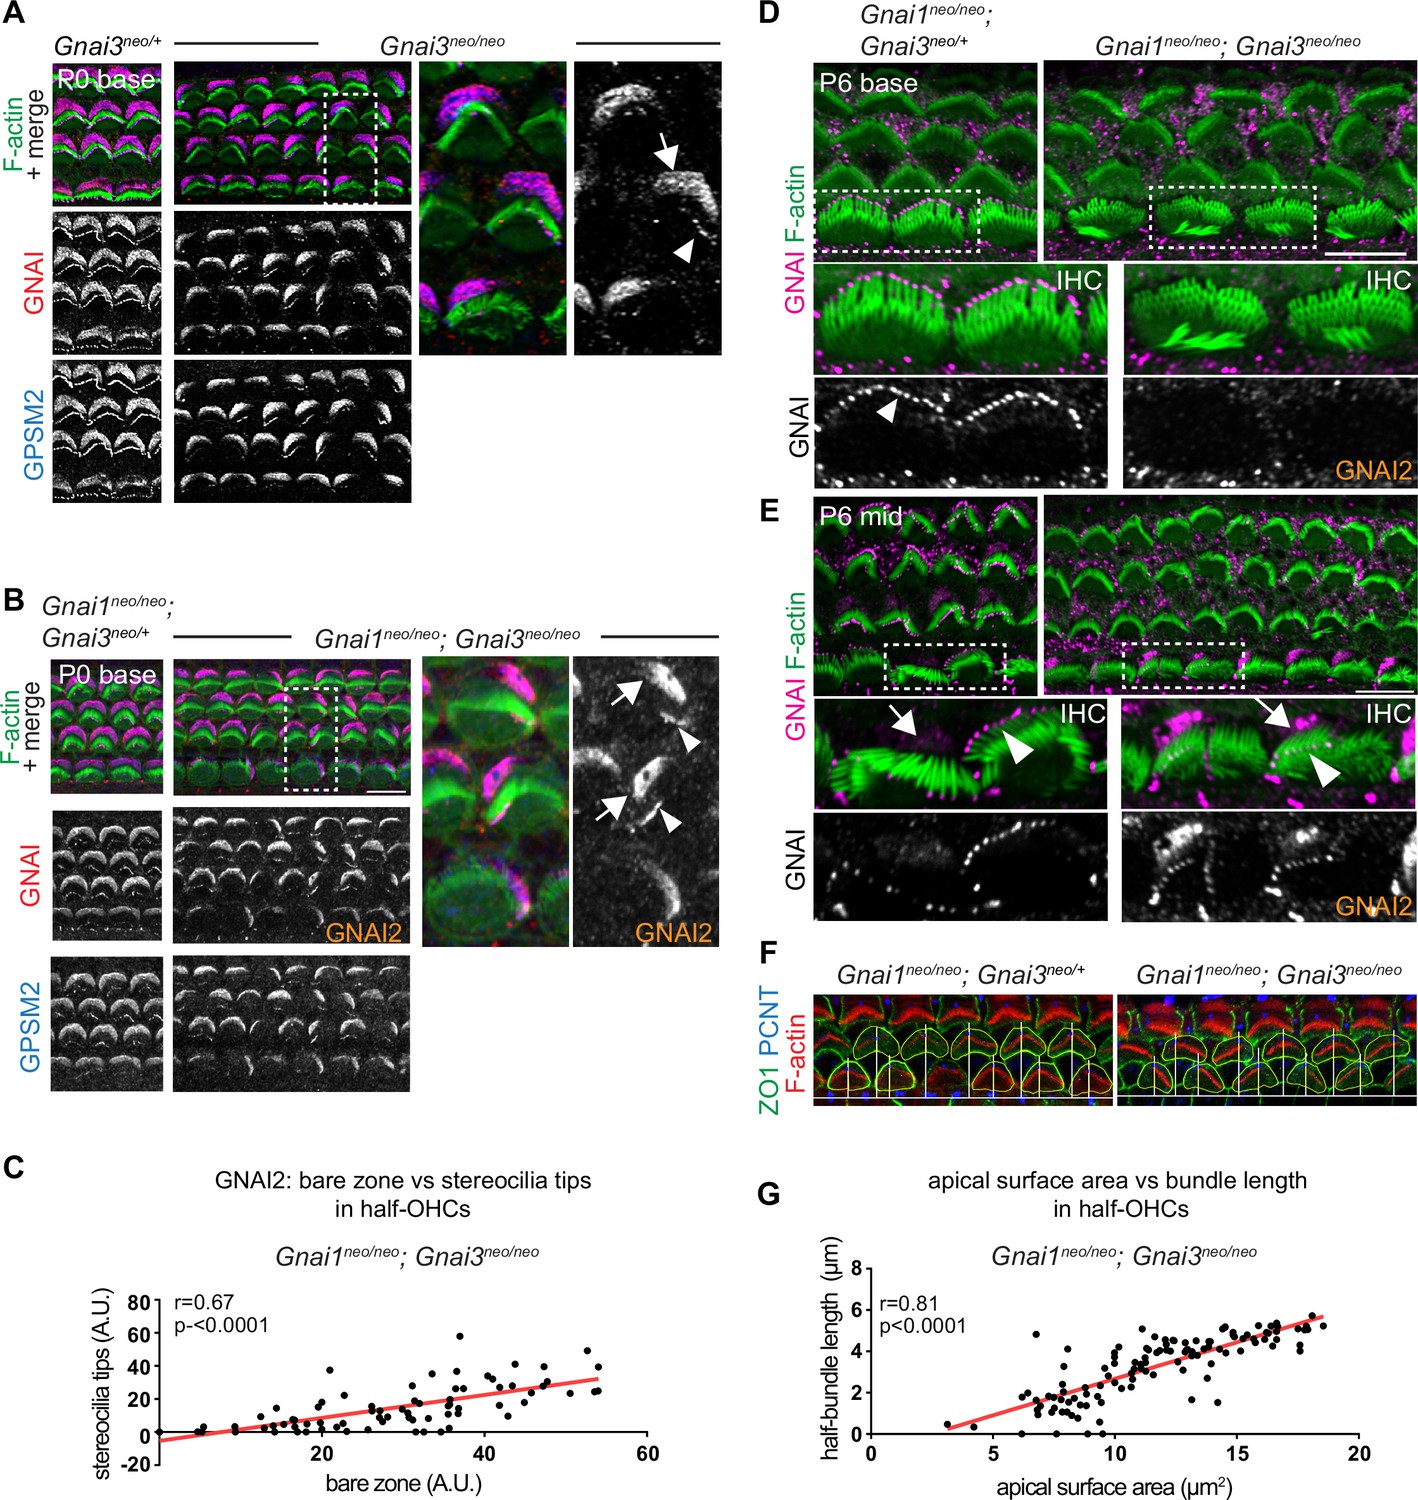
(A and B) GNAI (pt"GNAI2" antibody; see Figure 4) and GPSM2 co-immunolabeling in P0 Gnai3neo (A) and Gnai1neo; Gnai3neo (B) animals at the cochlear base. Boxed regions are magnified on the right. In both mutants, incomplete GNAI patterns are observed at the bare zone (arrow) and stereocilia tips (arrowheads). Remaining GNAI signals must reflect GNAI2 in (B). (C) Correlation plot of GNAI signal intensity at the bare zone and tips in half-OHC at the P2 cochlear mid. Presence or absence of GNAI is remarkably correlated spatially between bare zone and tips in the same half-OHC. N=3 animals, n=37 OHC, Pearson correlation with best fit (red line; plot for control littermates can be found in Figure 5—figure supplement 1A). (D and E) GNAI (pt"GNAI2" antibody) immunolabeling in P6 Gnai1neo; Gnai3neo animals. Boxed IHC regions are magnified below. Loss of GNAI2 progresses with HC differentiation, with largely absent IHC signals at the P6 cochlear base (D) but partial rescue on one side of the cell at the P6 mid (E), as observed at the cochlear base at P0 (A and B). (F) ZO1 (apical junctions) and pericentrin (PCNT; basal body) immunolabeling in P8 OHC (maximum projection). The position of the basal body is used to determine the vertex (middle) of the original hair bundle and to draw a radial line separating each OHC into two halves. (G) The length of each hair bundle wing (y axis) is graphed in relation to the corresponding apical surface area (x axis) in the same half-OHC. Truncated OHC wings correlate with reduced apical membrane area on the same side. N=3 animals, n=58 OHC, Pearson correlation with best fit (red line; plot for control littermates can be found in Figure 5—figure supplement 1C). AU, arbitrary unit; IHC, inner hair cell; OHC, outer hair cell. Scale bars are 10 µm.
Figure 5—figure supplement 1

GNAI2 fully rescues loss of GNAI3 at embryonic stages and is still detected in low amounts at stereocilia tips in adult hair cells lacking GNAI3.
(A) Control correlation plot for Gnai1; Gnai3 double mutants in Figure 5C. GNAI signal intensity at the bare zone and stereocilia tips in control half-HC at the P2 cochlear base. N=3 animals, n=40 OHC, Pearson correlation with best fit (red line). The graph shows relatively uniform GNAI enrichment in each sub-cellular compartment, unlike in Gnai1; Gnai3 double mutants (Figure 5C). (B) GNAI (pt"GNAI2" antibody; see Figure 4) and GPSM2 co-immunolabeling at the embryonic day (E) 18.5 5 cochlear base. As sole remaining GNAI, GNAI2 can still encompass the entire bare zone in Gnai1; Gnai3 double mutants and no obvious hair bundle defects are observed, unlike at P0 (Figure 5A and B). The boxed region is magnified to the right. (C) Control correlation plot for Gnai1; Gnai3 double mutants in Figure 5G. The position of the basal body was used to determine the vertex (middle) of the hair bundle and to draw a radial line separating each OHC into two halves. The length of each hair bundle wing (y axis) is graphed in relation to the corresponding apical surface area (x axis) in the same half-OHC. The plot shows relatively uniform wing lengths and half apical areas in littermate controls, unlike in Gnai1; Gnai3 double mutants (Figure 5G). N=3 animals, n=52 OHC, Pearson correlation with best fit (red line). (D and E) GNAI (pt"GNAI2" antibody; see Figure 4) immunolabeling in P28 adults (maximum projections). As sole remaining GNAI, GNAI2 can still be detected at low levels at stereocilia tips in Gnai1; Gnai3 double mutants at the cochlear base, mid, and apex (arrowheads). (E) Shows higher magnification views of a single OHC1 (left) and IHC (right) at the cochlear mid. AU, arbitrary unit; IHC, inner hair cell; OHC, outer hair cell. Scale bars are 10 µm (B, D) and 5 µm (E).
Figure 6 with 1 supplement
Delayed bare zone expansion and severely dysmorphic hair bundles in absence of GNAI2 and GNAI3.
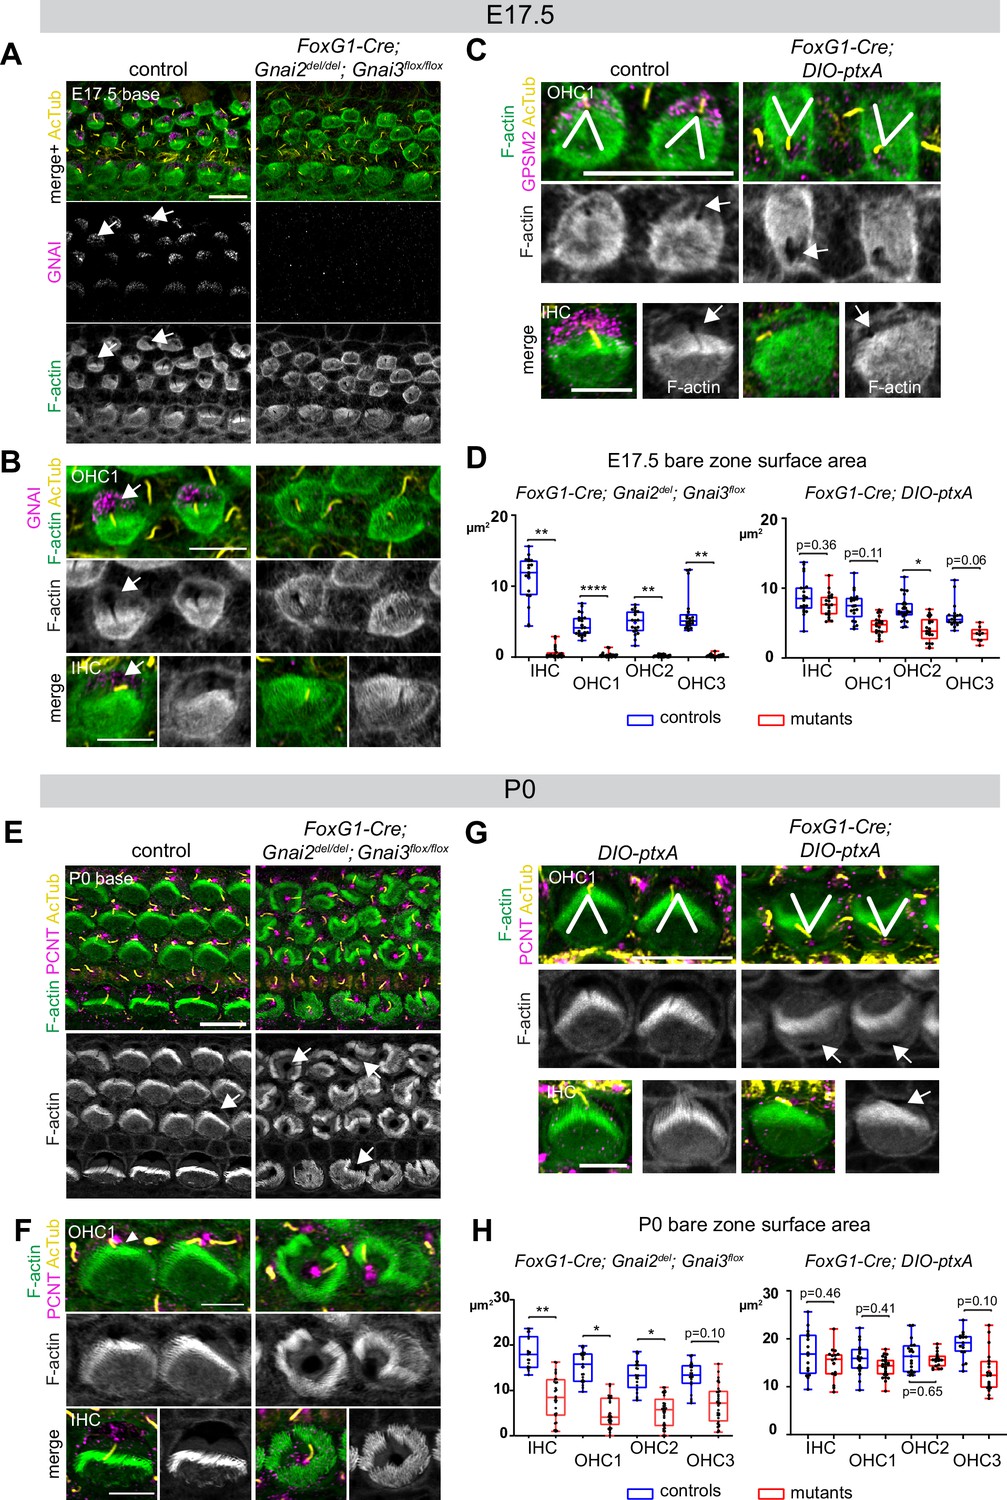
(A and B) GNAI (scbt"GNAI3" antibody, see Figure 4) and acetylated tubulin (AcTub; kinocilium) co-immunolabeling at the embryonic day (E) 17.5 cochlear base. Note how F-actin labeling (phalloidin) reveals a polarized bare zone marked by GNAI (arrows) in control but not in Gnai2; Gnai3 double mutants. (C) GPSM2 and AcTub co-immunolabeling at the E17.5 cochlear base. In contrast to Gnai2; Gnai3 double mutants (A and B), Foxg1-Cre; DIO-ptxA mutants have a polarized bare zone (arrows) despite OHC1–2 adopting a reversed orientation (V brackets indicate OHC1 orientation). GPSM2 marks the bare zone in controls and is reduced in mutants. (D) Graphs of bare zone surface area in E17.5 hair cell (HC) at the cochlear base. Foxg1-Cre; Gnai2del; Gnai3flox: controls (Gnai2del/+; Gnai3flox/+ and Gnai2del/+; Gnai3flox/flox) N=3 animals, n=19 IHC, 23 OHC1, 19 OHC2, 21 OHC3; mutants N=3, n=23 IHC, 24 OHC1, 23 OHC2, 24 OHC3. Foxg1-Cre; DIO-ptxA: controls (Cre-negative DIO-ptxA) N=3, n=18 IHC, 18 OHC1, 21 OHC2, 18 OHC3; mutants N=3, n=21 IHC, 20 OHC1, 21 OHC2, 9 OHC3. (E–G) Pericentrin (PCNT) and AcTub co-immunolabeling at P0 at the cochlear base. Unlike at E17.5 (A, B, D), most P0 Gnai2; Gnai3 double mutant HC have a bare region (E and F, arrows). This bare region is unpolarized and its abnormal shape reflects aberrant stereocilia distribution. In sharp contrast, ptxA mutants have normally shaped hair bundles and bare zones despite OHC1–2 adopting a reversed orientation (G). (H) Graphs of bare zone surface area in P0 HC at the cochlear base. Foxg1-Cre; Gnai2del; Gnai3flox: controls (Gnai2del/+; Gnai3flox/+, Gnai2del/+; Gnai3flox/flox and Foxg1-Cre; Gnai2del/+; Gnai3flox/+) N=3, n=19 IHC, 23 OHC1, 21 OHC2, 21 OHC3; mutant N=3, n=21 IHC, 22 OHC1, 24 OHC2, 24 OHC3. Foxg1-Cre; DIO-ptxA: controls (Cre-negative DIO-ptxA) N=3, n=15 IHC, 23 OHC1, 18 OHC2, 15 OHC3; mutants N=3, n=16 IHC, 24 OHC1, 18 OHC2, 19 OHC3. (D, H) Nested (hierarchical) t-test sorted by animal; p<0.0001****, p<0.01**, p<0.05*; non-significant p-values are indicated. All ptxA samples are heterozygotes (Rosa26DIO-ptxA/+). Scale bars are 10 μm (A, C [OHC], E, G [OHC]) and 5 μm (B, C [IHC], F, G [IHC]). IHC, inner hair cell; OHC, outer hair cell.
Figure 6—figure supplement 1
Validation of the Gnai3flox and DIO-ptxA mouse strains.
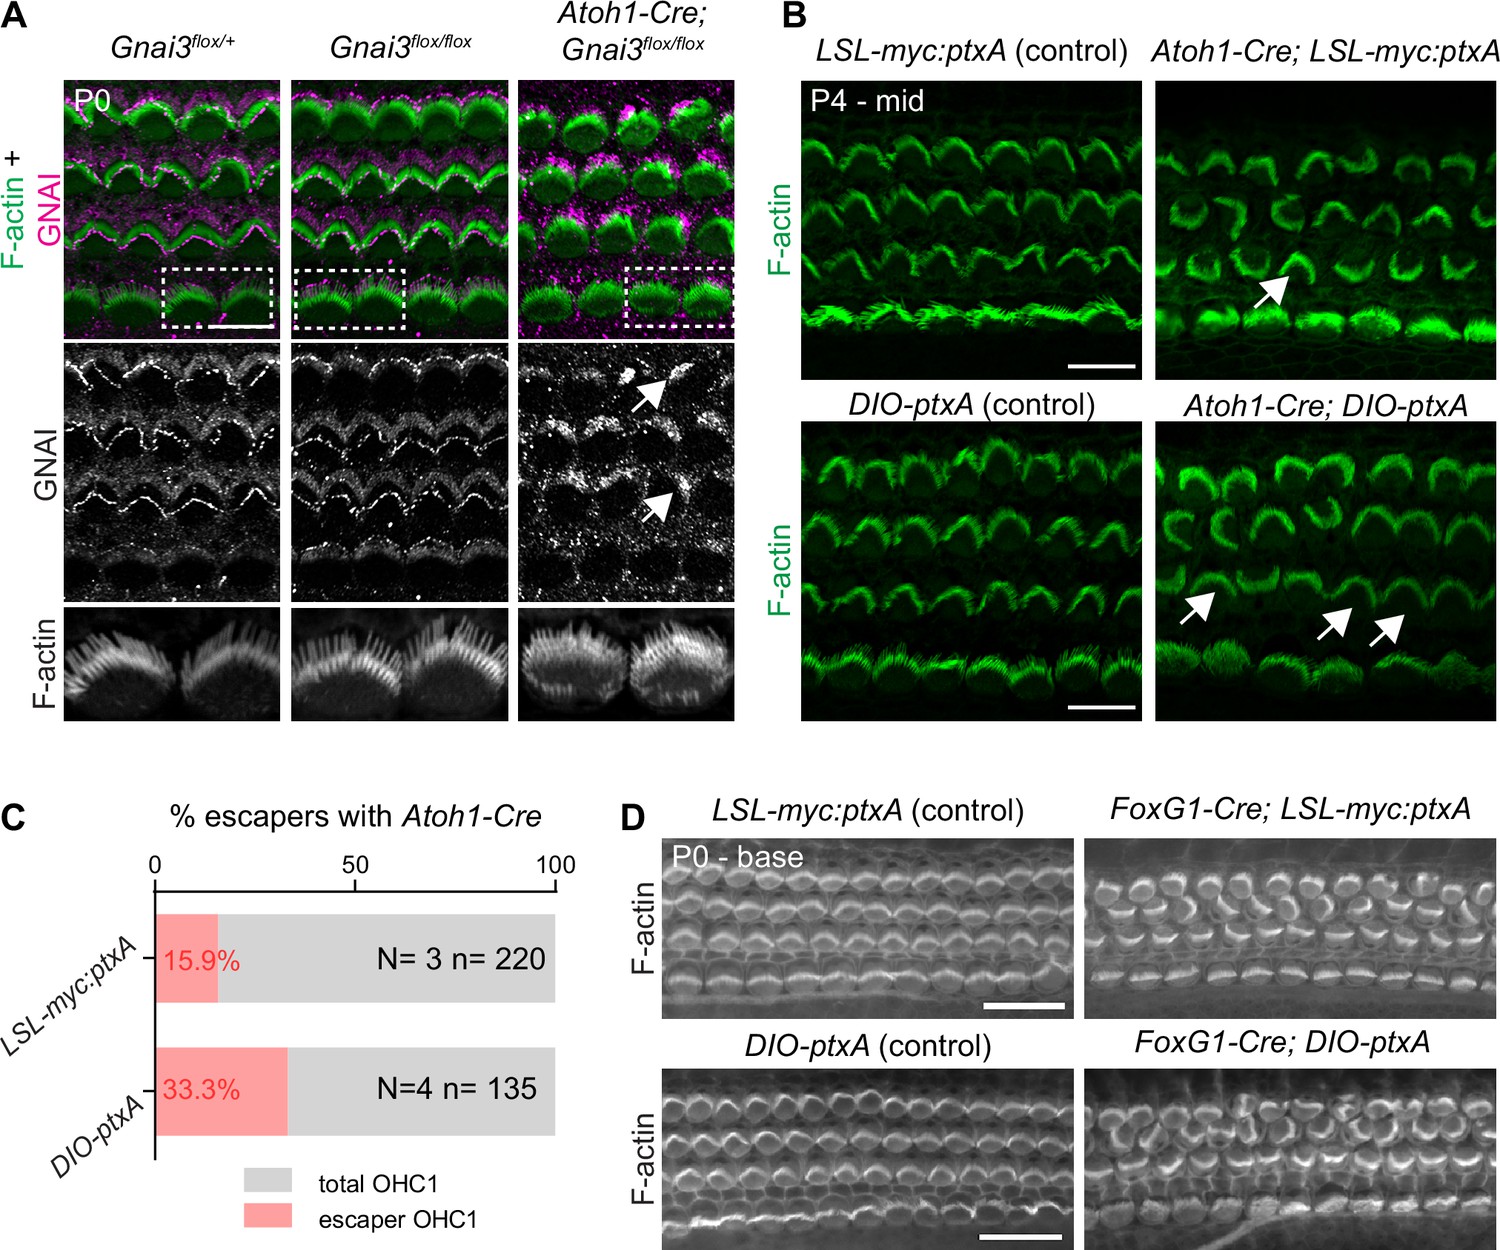
(A) GNAI (pt"GNAI2" antibody; see Figure 4) immunolabeling at the P0 cochlear base. Note how in absence of Cre recombinase, Gnai3flox/flox hair cell (HC) have normal hair bundles and normal GNAI enrichment at the bare zone and stereocilia tips. In contrast, Atoh1-Cre produces incomplete GNAI enrichment (arrows; compare with Figure 4D) and shortened stereocilia typical of constitutive Gnai3 mutants. Boxed inner HC (IHC) regions are magnified below. (B–D) Comparison of the two ptxA strains used in this study (see also Figure 2—figure supplement 1C and D). PtxA expression with the Atoh1-Cre driver produces comparable P4 apical HC defects in the LSL-myc:ptxA and DIO-ptxA strains (B). "Escaper" OHC1 that are not inverted in orientation (arrows) likely do not express Cre, or did not undergo recombination. (C) When Atoh1-Cre induces ptxA expression in post-mitotic HC, the number of escaper OHC1 is higher in the DIO-ptxA strain. This is likely because lox-based genomic deletions (LSL) are favored over genomic inversions (DIO; see Figure 2—figure supplement 1C and D). (D) In contrast to Atoh1-Cre, an earlier Cre driver (Foxg1-Cre) shows virtually no escapers in either ptxA strain. N and n indicate the number of animals and OHC1 analyzed, respectively. All ptxA samples in the study are heterozygotes (Rosa26LSL-myc:ptxA/+ or Rosa26DIO-ptxA/+), and controls are Cre-negative heterozygotes. Scale bars are 10 µm (A, B), 20 μm (D).
Figure 7
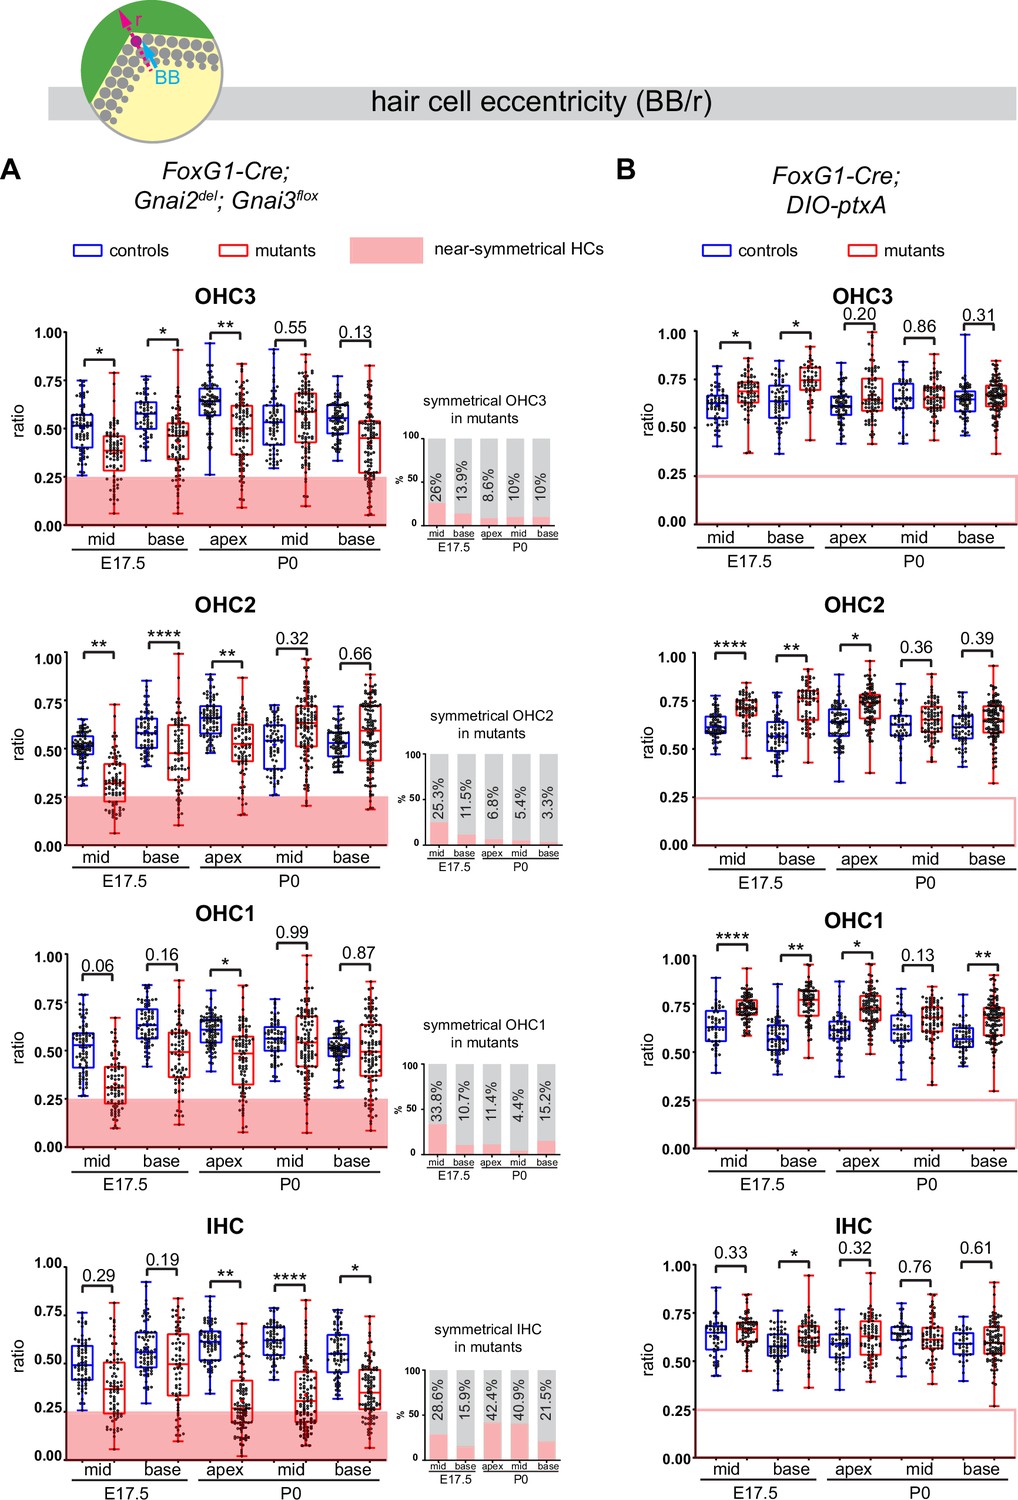
Loss of GNAI2 and GNAI3 provokes hair cell (HC) eccentricity defects absent in ptxA mutants.
(A and B) Graphs of HC eccentricity representing the position of the basal body as a ratio of the radius (BB/r, top diagram). Data cover embryonic day (E) 17.5 mid and base and P0 apex, mid and base cochlear positions for each HC type. HC were considered near-symmetrical when their eccentricity ratio was lower than 0.25 (red zone). Only Foxg1-Cre; Gnai2del; Gnai3flox mutants harbor symmetrical HC. Their proportion is indicated in the bar graphs on the right (A). Overall, the proportion of symmetrical cells tends to decrease in maturing outer HC (OHC) but remains high or increases in inner HC (IHC). At least 3 animals and 39 cells per HC type are represented for each stage, cochlear position, and genotype. Controls for Foxg1-Cre; Gnai2del/del; Gnai3flox/flox are Gnai2del/+; Gnai3flox/+, Gnai2del/+; Gnai3flox/flox, Foxg1-Cre; Gnai2del/+; Gnai3flox/+, and Foxg1-Cre; Gnai2del/+; Gnai3flox/flox. Controls for Foxg1-Cre; DIO-ptxA are Cre-negative DIO-ptxA heterozygotes. Nested (hierarchical) t-test sorted by animal; p<0.0001****, p<0.01**, p<0.05*; non-significant p-values are indicated.
Figure 8 with 2 supplements

Loss of GNAI2 and GNAI3 recapitulates hair cell (HC) orientation defects observed in ptxA mutants.
(A–D) Circular histograms showing HC orientation (α) based on the position of the basal body (purple dot in top diagram) at the stage and cochlear position indicated. 0° is toward the cochlear base and 90° is lateral. HC represented have an eccentricity greater than 0.4 in A and B (embryonic day [E] 17.5), and 0.25 in C and D (P0) (see Figure 7). Histograms show frequency distribution (10° bins) and red radial lines and arcs respectively indicate circular mean and circular mean deviation. In control cochleae, HC are tightly oriented laterally (90°) except for OHC3 that show a slight bias toward the cochlear apex (180°). As reported previously, ptxA expression inverts OHC1 and OHC2, and results in imprecise lateral orientation of OHC3. This phenotype is recapitulated in Gnai2; Gnai3 double mutants with a delay (compare least mature E17.5 mid (A) and most mature P0 base (D)). Inner HC (IHC) also show severe misorientation in Gnai2; Gnai3 double mutants, unlike in ptxA mutants. n, HC number in N=3–4 animals. Controls for Foxg1-Cre; Gnai2del/del; Gnai3flox/flox are Gnai2del/+; Gnai3flox/+, Gnai2del/+; Gnai3flox/flox, Foxg1-Cre; Gnai2del/+; Gnai3flox/+ and Foxg1-Cre; Gnai2del/+; Gnai3flox/flox. Data at the P0 cochlear mid position can be found in Figure 8—figure supplement 1A. Histograms for littermate controls of Foxg1-Cre; DIO-ptxA mutants can be found in Figure 8—figure supplement 2.
Figure 8—figure supplement 1

Loss of GNAI2 and GNAI3 recapitulates hair cell (HC) orientation defects observed in ptxA mutants.
(A) P0 mid cochlea histograms that complement P0 apex and P0 base histograms in Figure 8C and D. (B) Comparison of OHC1 and OHC2 orientation in Foxg1-Cre; Gnai2del/del; Gnai3flox/flox (left diagrams; identical to Figure 8B-D), Atoh1-Cre; DIO-ptxA (center diagrams) and Foxg1-Cre; DIO-ptxA mutants (right diagrams); identical to Figure 8B-D at the embryonic day (E) 17.5 base, P0 apex, and P0 base. Post-mitotic Cre expression in Atoh1-Cre HC results in delayed ptxA expression and delayed inversion of OHC2 compared to earlier Foxg1-Cre expression in progenitor cells. This outcome is reminiscent of Gnai2; Gnai3 mutants. At the E17.5 base and P0 apex (less mature), most OHC2s are inverted in the Foxg1-Cre; DIO-ptxA model only. At the P0 cochlear base (more mature), OHC2s are largely inverted in Gnai2; Gnai3 mutants and in the Atoh1-Cre; DIO-ptxA model as well. Circular histograms show HC orientation (α) based on the position of the basal body (purple dot in top diagram) at the stage and cochlear position indicated. 0° is toward the cochlear base and 90° is lateral. HC represented have an eccentricity greater than 0.4 (E17.5) or 0.25 (P0). Histograms show frequency distribution (10° bins) and red radial lines and arcs respectively indicate the circular mean and the circular mean deviation. n, HC number in N=3–4 animals. Littermate control histograms for Atoh1-Cre; DIO-ptxA mutants (B) can be found in Figure 8—figure supplement 2F.
Figure 8—figure supplement 2

Littermate control histograms for ptxA mutants.
(A–E) Histograms showing littermate controls for Foxg1-Cre; DIO-ptxA mutants in Figure 8A–D and in Figure 8—figure supplement 1A (D; P0 mid), and littermate controls for Atoh1-Cre; DIO-ptxA mutants in Figure 8—figure supplement 1B (F). Note that mutant histograms are identical to Figure 8 or Figure 8—figure supplement 1. Circular histograms show hair cell (HC) orientation (α) based on the position of the basal body (purple dot in top diagram) at the stage and cochlear position indicated. 0° is toward the cochlear base and 90° is lateral. HC represented have an eccentricity above 0.4 at E17.5 and above 0.25 at P0. Histograms show frequency distribution (10° bins) and red radial lines and arcs respectively indicate the circular mean and the circular mean deviation. n, HC number in N=3–4 animals. Controls for Foxg1-Cre; DIO-ptxA and Atoh1-Cre; DIO-ptxA are Cre-negative DIO-ptxA heterozygotes.
Figure 9

Summary and model: three roles validated in vivo for GNAI proteins during hair cell (HC) polarized morphogenesis.
GNAI proteins are required for the off-center migration of the basal body, and thus HC symmetry breaking (a). This activity is distinct from defining binary HC orientation downstream of GPR156 (b), as Gpr156 mutant HC have off-center basal bodies and normal hair bundles. Finally, GNAI partner with GPSM2 to shape the hair bundle and elongate stereocilia (c). The specific identity and the dosage of GNAI proteins required differ for each role. GNAI3 is the principal architect of hair bundle development (c), with GNAI2 playing an important but progressively waning role. High amounts of GNAI3/GNAI2 are required with GPSM2. A lower dose of GNAI/O proteins is required for embryonic role, and we speculate that GNAI2 and GNAI3 play a prominent role for symmetry breaking (a) whereas any GNAI/O protein may effectively signal downstream of GPR156 for proper HC orientation (b). A GNAI/O regulator for symmetry breaking remains to be identified.
Additional files
-
Supplementary file 1
Table providing mouse strain details.
- https://cdn.elifesciences.org/articles/88186/elife-88186-supp1-v1.xlsx
-
Supplementary file 2
Table providing genotyping strategies.
- https://cdn.elifesciences.org/articles/88186/elife-88186-supp2-v1.xlsx
-
MDAR checklist
- https://cdn.elifesciences.org/articles/88186/elife-88186-mdarchecklist1-v1.pdf
Download links
A two-part list of links to download the article, or parts of the article, in various formats.
Downloads (link to download the article as PDF)
Open citations (links to open the citations from this article in various online reference manager services)
Cite this article (links to download the citations from this article in formats compatible with various reference manager tools)
Inhibitory G proteins play multiple roles to polarize sensory hair cell morphogenesis
eLife 12:RP88186.
https://doi.org/10.7554/eLife.88186.3


