Navigating contradictions in enteric chemotactic stimuli
- Department of Veterinary Microbiology and Pathology, Washington State University, United States
- Institute of Molecular Biology, University of Oregon, United States
- Department of Chemistry & Biochemistry, University of Oregon, United States
- Amethyst Antimicrobials, LLC, United States
Figures
Figure 1 with 2 supplements
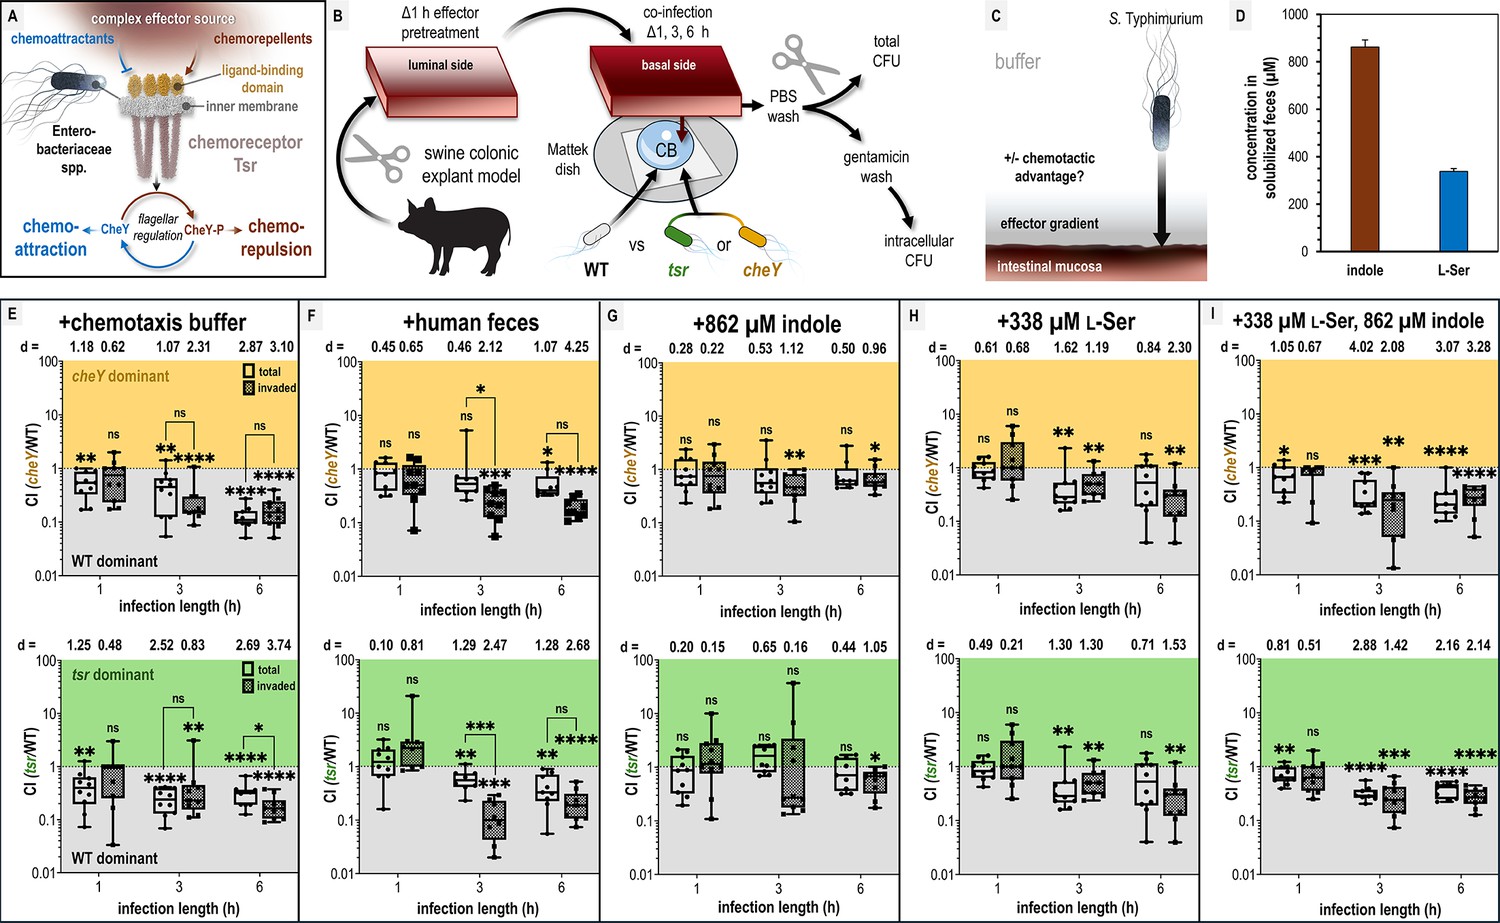
Chemotaxis-mediated infection advantages in the presence of fecal effectors.
(A) Overview of the role of Tsr in coordinating responses to conflicting stimuli. (B) Experimental design of colonic explant infections. See Materials and methods for experimental details such as tissue dimensions. (C) Conceptual model of the explant infection system. The effectors from the treated tissue (gray) diffuse into the surrounding buffer solution providing a gradient. Note that the bacteria are not immersed in the effector solution and experience a local concentration during infection much lower than the effector pretreatment. Quantifications of tissue-associated bacteria reflect the ability of chemotaxis to provide an advantage (black arrow) in accessing the intestinal mucosa (reddish brown). (D) Serine (presumed to be nearly 100% l-Ser, see Materials and methods) and indole content of liquid human fecal treatments, as measured by mass spectrometry. (E–I) Competitive indices (CIs) of colony-forming units (CFUs) recovered from co-infected swine explant tissue, either from the total homogenate (open box and whiskers plots), or from tissue washed with gentamicin to kill extracellular and attached cells, which we refer to as the ‘invaded’ intracellular population (checkered box and whisker plots), as indicated. Each data point represents a single experiment of a section of tissue infected with bacteria, normalized by tissue weight, and the CI of CFUs recovered from that tissue (n = 7–10). Boxes show median values (line) and upper and lower quartiles, and whiskers show max and min values. Effect size (Cohen’s d) and statistical significance are noted for each experiment in relation to competitive advantage, that is deviation from a CI of 1 (not significant, ns; *p < 0.05, **p < 0.01, ***p < 0.001, ****p < 0.0001). See also Figure 1 - figure supplement 1 for competition between wildtype (WT) and an invasion-inhibited mutant invA, and Figure 1 - figure supplement 2 for disaggregated CFU enumerations for each experimental group prior to CI calculation. Source data 1 contains all numerical CFU measurements.
Figure 1—figure supplement 1
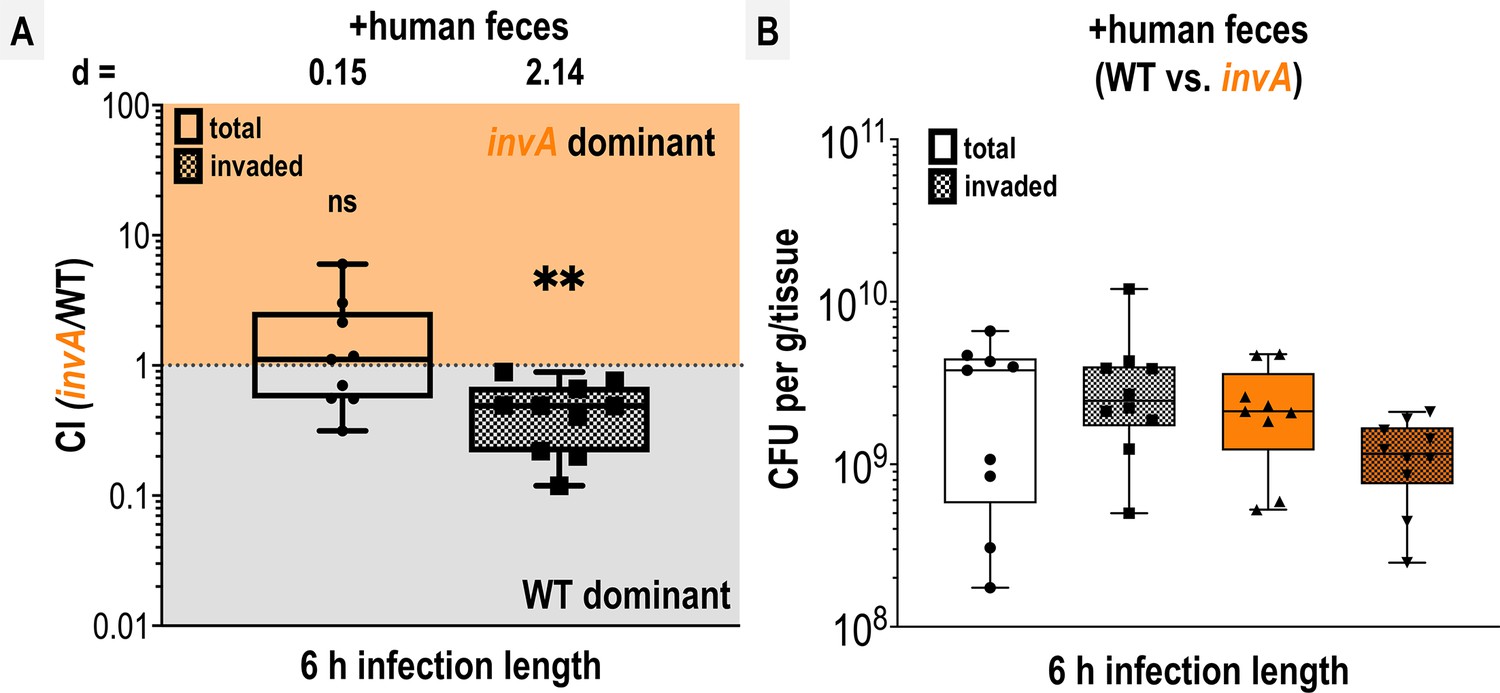
Competition of wildtype (WT) and invA in explant infections.
(A) Competitive indices (CIs) of colony-forming units (CFUs) recovered from co-infected swine explant tissue, either from the total homogenate (total, open box and whiskers plots), or from tissue washed with gentamicin to kill extracellular and attached cells (invaded, checkered box and whisker plots), as indicated. Each data point represents a single experiment and the CI of CFUs recovered from that tissue (n = 9–10). Boxes show median values (line) and upper and lower quartiles, and whiskers show max and min values. Effect size (Cohen’s d) and statistical significance are noted for each experiment in relation to competitive advantage, that is deviation from a CI of 1 (not significant, ns; *p < 0.05, **p < 0.01, ***p < 0.001, ****p < 0.0001). (B) Disaggregated CFU enumerations for each experimental group prior to CI calculation.
Figure 1—figure supplement 2
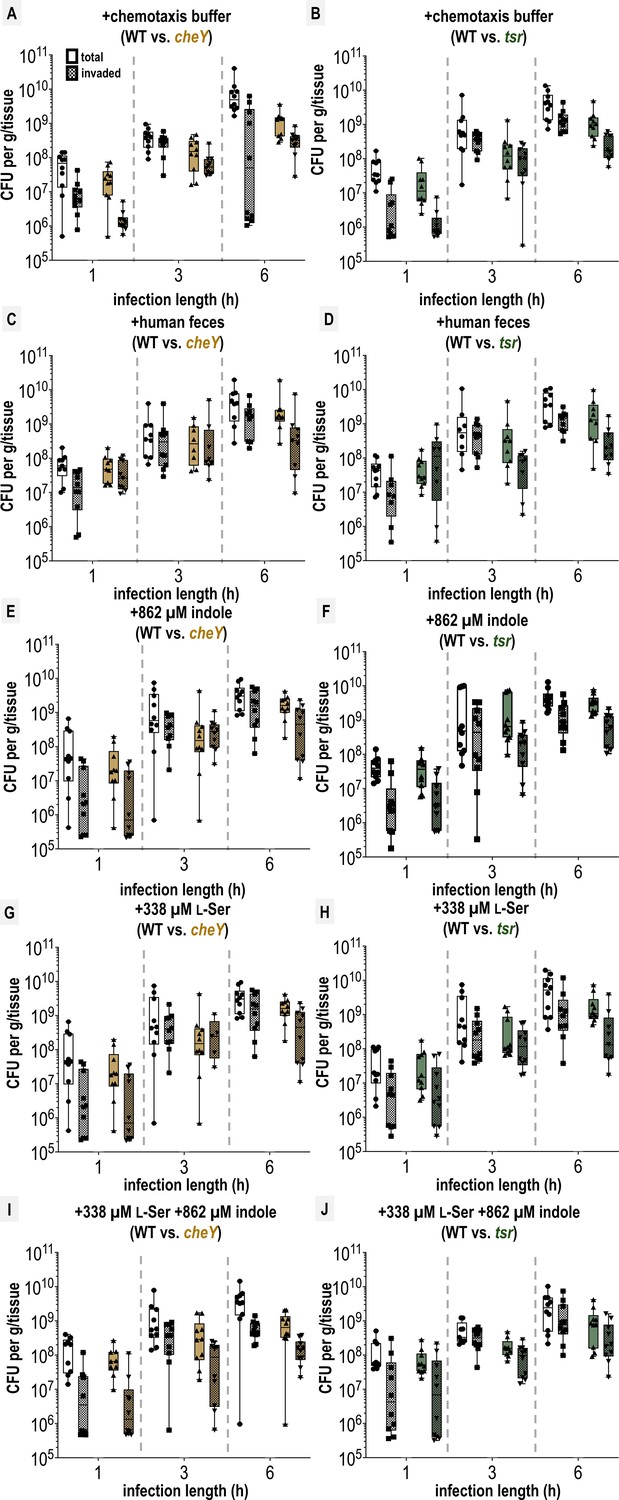
Colony-forming units (CFUs) recovered from swine colonic explant infections.
A-J. Shown are disaggregated CFU enumerations for each co-infection experiment with S. Typhimurium IR715 wildtype (WT) and mutant strains following tissue treatments, as indicated. CFUs extracted either using the entire tissue homogenate (total) or extracted from tissue treated with a gentamicin wash to kill exterior non-invaded cells (invaded) are noted separately (see Materials and methods). Each data point represents CFUs recovered from a single explant experiment (n = 8–10). Box and whisker plots represent the sample median (line), the edges are the upper and lower quartiles, and whiskers extend to the max and min values. The limit of detection was 1 × 10⁵ CFUs, and experiments at or below this limit are not included here. See Source data 1Data S1 for numeric values.
Figure 2 with 1 supplement
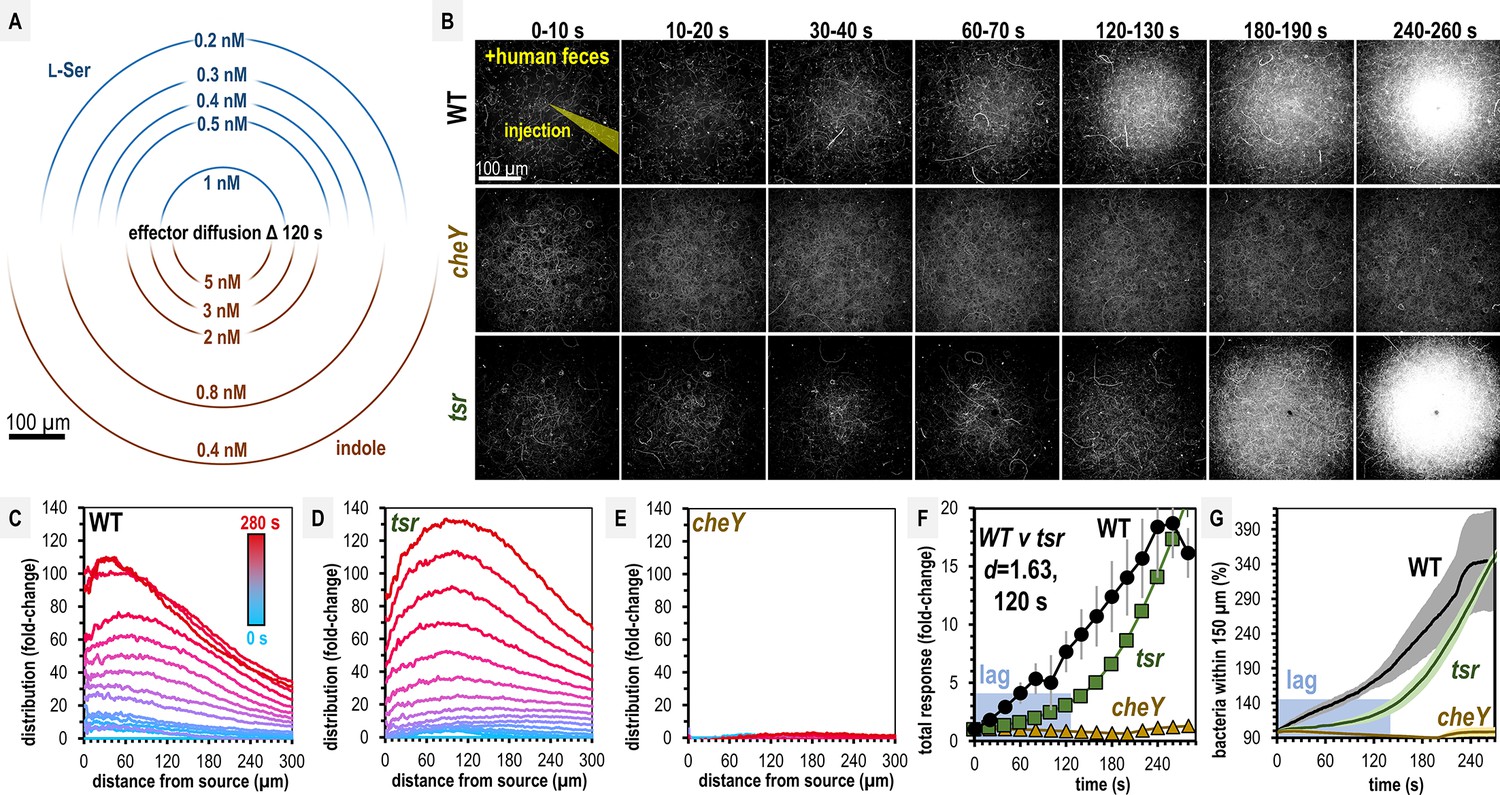
Salmonella Typhimurium exhibits attraction toward indole-rich liquid human fecal material.
(A) Diffusion modeling showing calculated local concentrations in chemosensory injection rig assay (CIRA) experiments with liquid human fecal material based on distance from the central injection source. (B) Max projections of representative S. Typhimurium IR715 responses to a central source of injected liquid human fecal material. (C–E) Bacterial population density over time in response to fecal treatment. The initial uniform population density in these plots is indicated with the blue line (time 0), and the final mean distributions with the red line (time 280 s), with the mean distributions between these displayed as a blue-to-red spectrum at 10-s intervals. (F–G) Temporal analyses of area under the curve (AUC) or relative number of bacteria within 150 µm of the source. Effect size (Cohen’s d) comparing responses of wildtype (WT) and tsr attraction at 120 s post-treatment is indicated. Data were collected at 30°C. Data are means and error bars are standard error of the mean (SEM, n = 3–5). See also Figure 2—figure supplement 1, Video 1, Supplementary file 1.
Figure 2—figure supplement 1
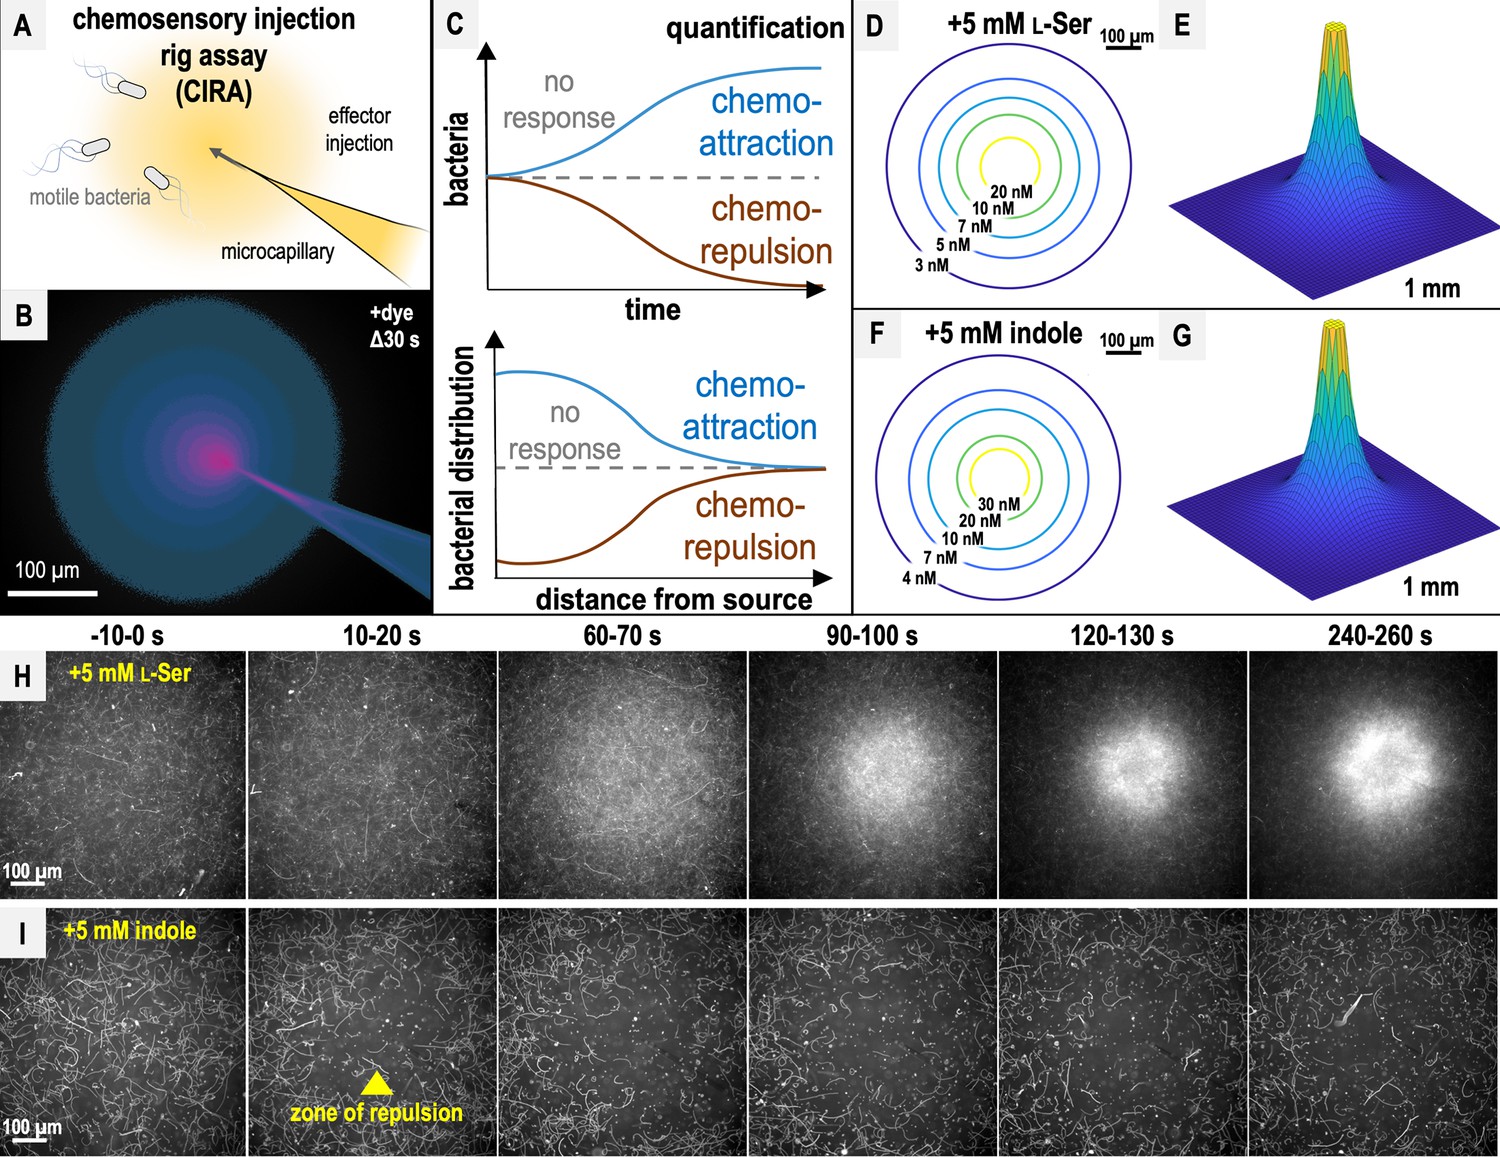
Chemosensory injection rig assay (CIRA) design, diffusion modeling, and responses to l-Ser or indole.
(A) CIRA experimental design. (B) CIRA microgradient diffusion model, simulated with a source of 1.13 mM A488 dye after 30 s of injection. Image rendered on a pink (100% source concentration)–blue–black (0%) color intensity scale, based on previous work (Glenn et al., 2024). (C) CIRA quantification overview, with blue lines corresponding to chemoattraction, null chemotactic response corresponding to gray dashed lines, and chemorepulsion corresponding to brown lines. (D–G) Microgradient models of the local effector concentration for treatments with 5 mM l-Ser or indole, respectively, at Δ300 s. Color gradient corresponds to gradually decreasing effector concentrations from yellow to blue. (H, I) Representative 10 s max projections of S. Typhimurium IR715 response to sources of l-Ser (strong chemoattraction) or indole (strong chemorepulsion) using CIRA. The glass microcapillary that injects the treatment solution is centered within the field of view. Note that cells contain a plasmid expressing mPlum (see Materials and methods), and fluorescence data are collected in the far-red channel, so the glass microcapillary is poorly visible.
Figure 3
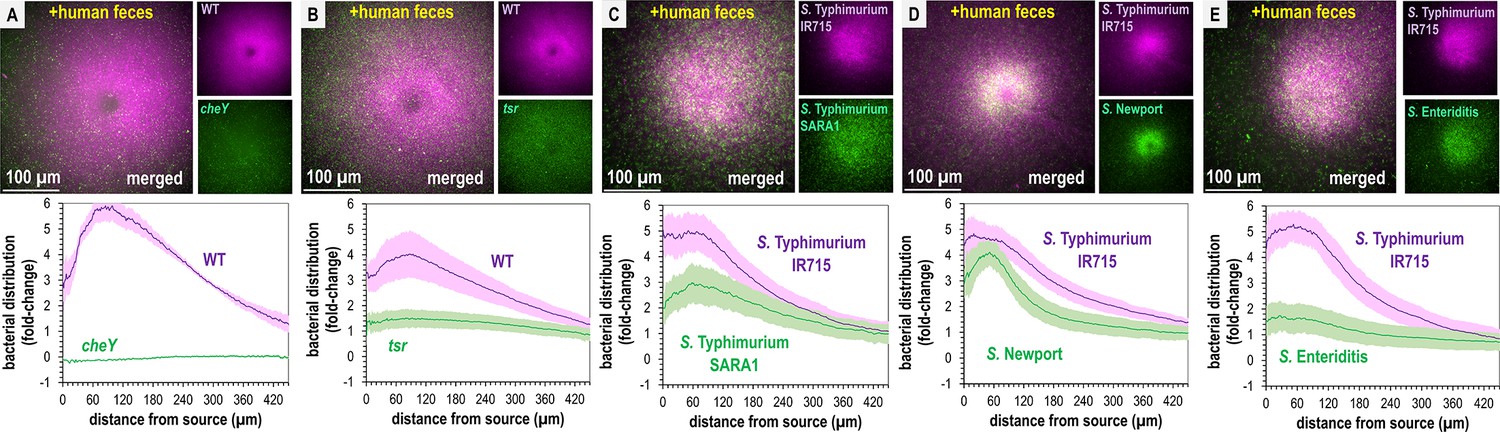
Non-typhoidal Salmonella exhibit fecal attraction.
(A–E) Dual-channel imaging of chemotactic responses to solubilized human feces by wildtype (WT) S. Typhimurium IR715 (pink) and isogenic mutants or clinical isolate strains (green), as indicated. Max projections are shown at time 295–300 s post-treatment. Data were collected at 37°C. Data are means and error bars are standard error of the mean (SEM, n = 3–5). See also Videos 2 and 3.
Figure 4 with 1 supplement
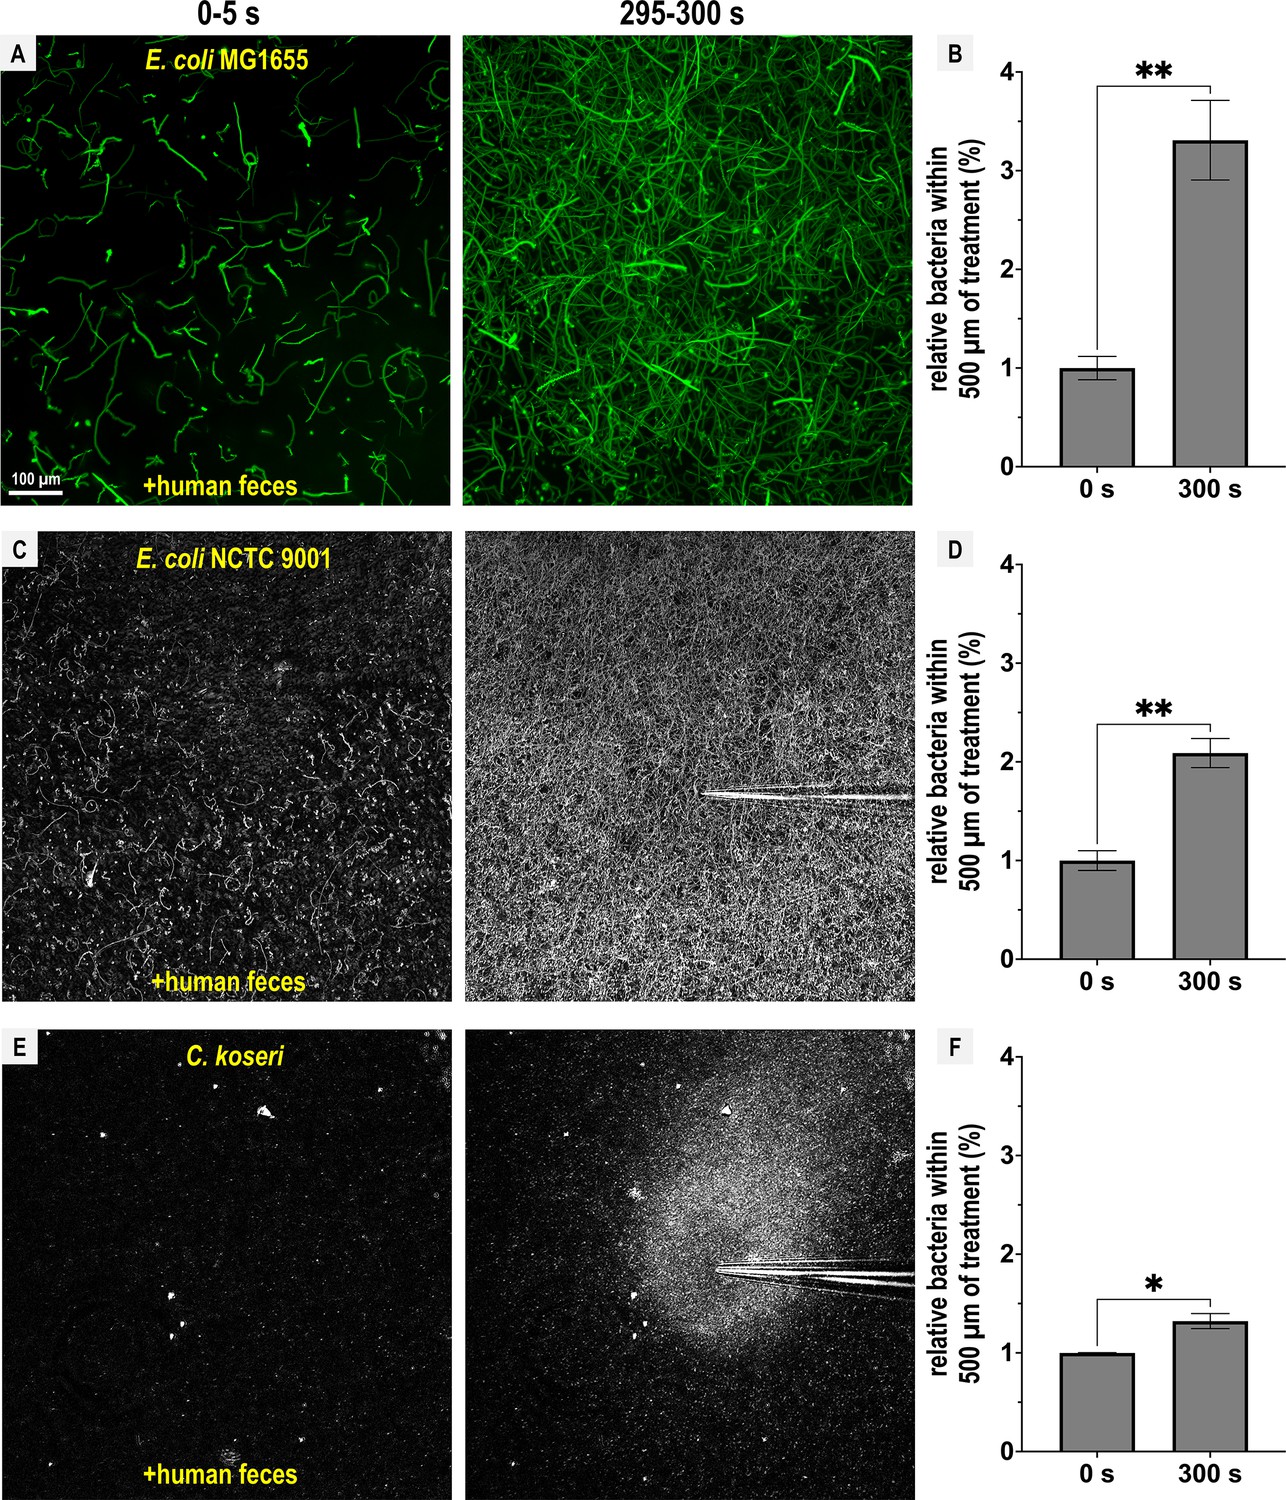
Representative Enterobacteriaceae exhibit fecal attraction.
Max projections are shown from chemosensory injection rig assay (CIRA) experiments over 5 s before fecal treatment and after 5 min of treatment, as well as quantifications of bacteria within 500 µm of the treatment source at these same time points for E. coli MG1655 (A, B, GFP-reporter), E. coli NCTC 9001 (C, D, phase), and C. koseri CDC 4225-83 (E, F, phase). Data were collected at 37°C. Data are means and error bars are standard error of the mean (SEM, n = 3–5) with statistical significances denoted (not significant, ns; *p < 0.05, **p < 0.01, ***p < 0.001, ****p < 0.0001). See also Videos 4–6.
Figure 4—figure supplement 1
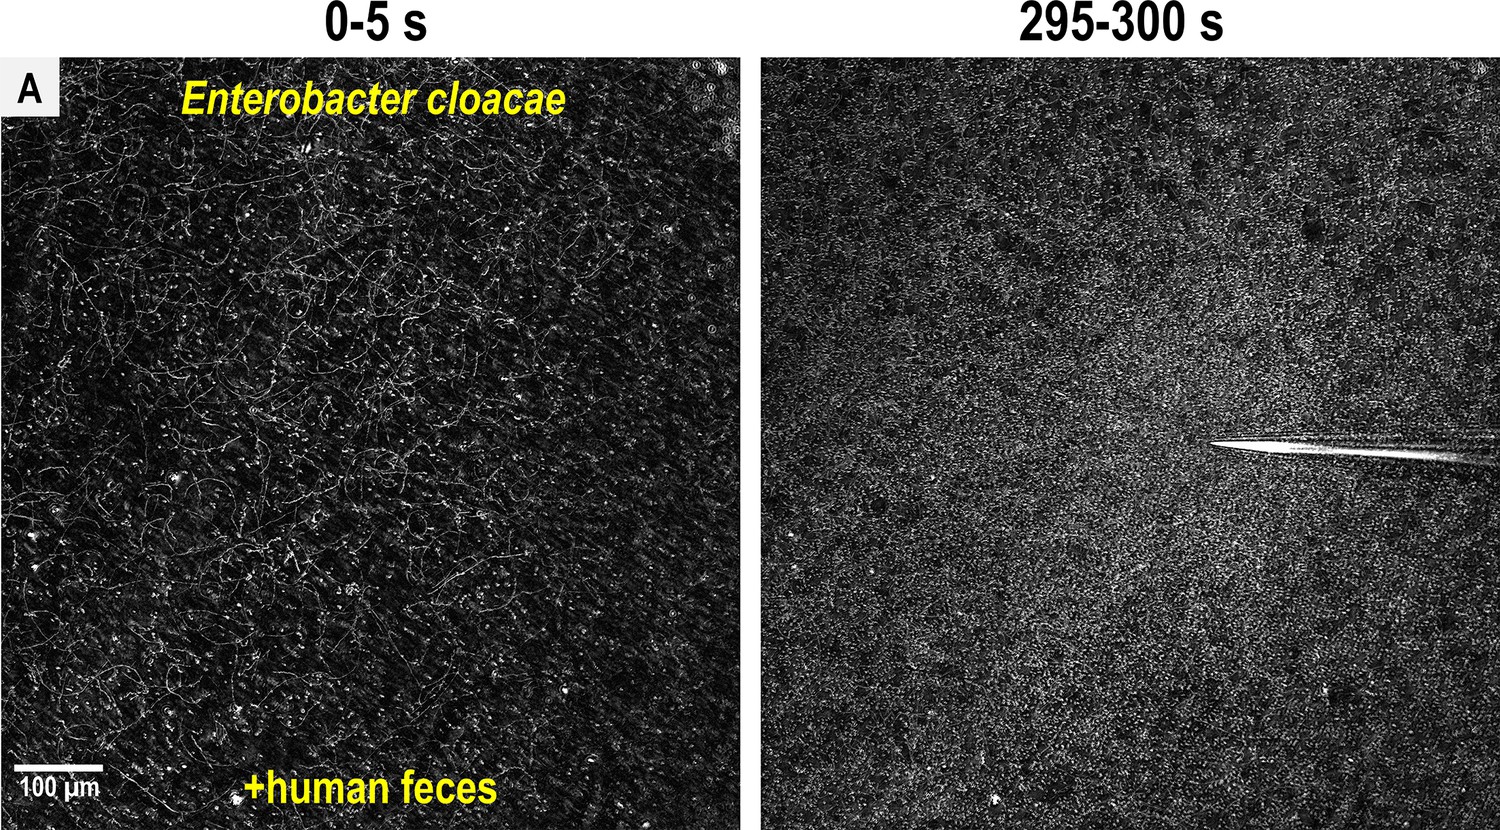
Enterobacter cloacae exhibits fecal attraction.
(A) Shown are max projections over 5 s from a chemosensory injection rig assay (CIRA) experiment from time −5 s before fecal treatment and after 5 min of treatment with liquid human feces. Data were collected using phase-contrast.
Figure 5
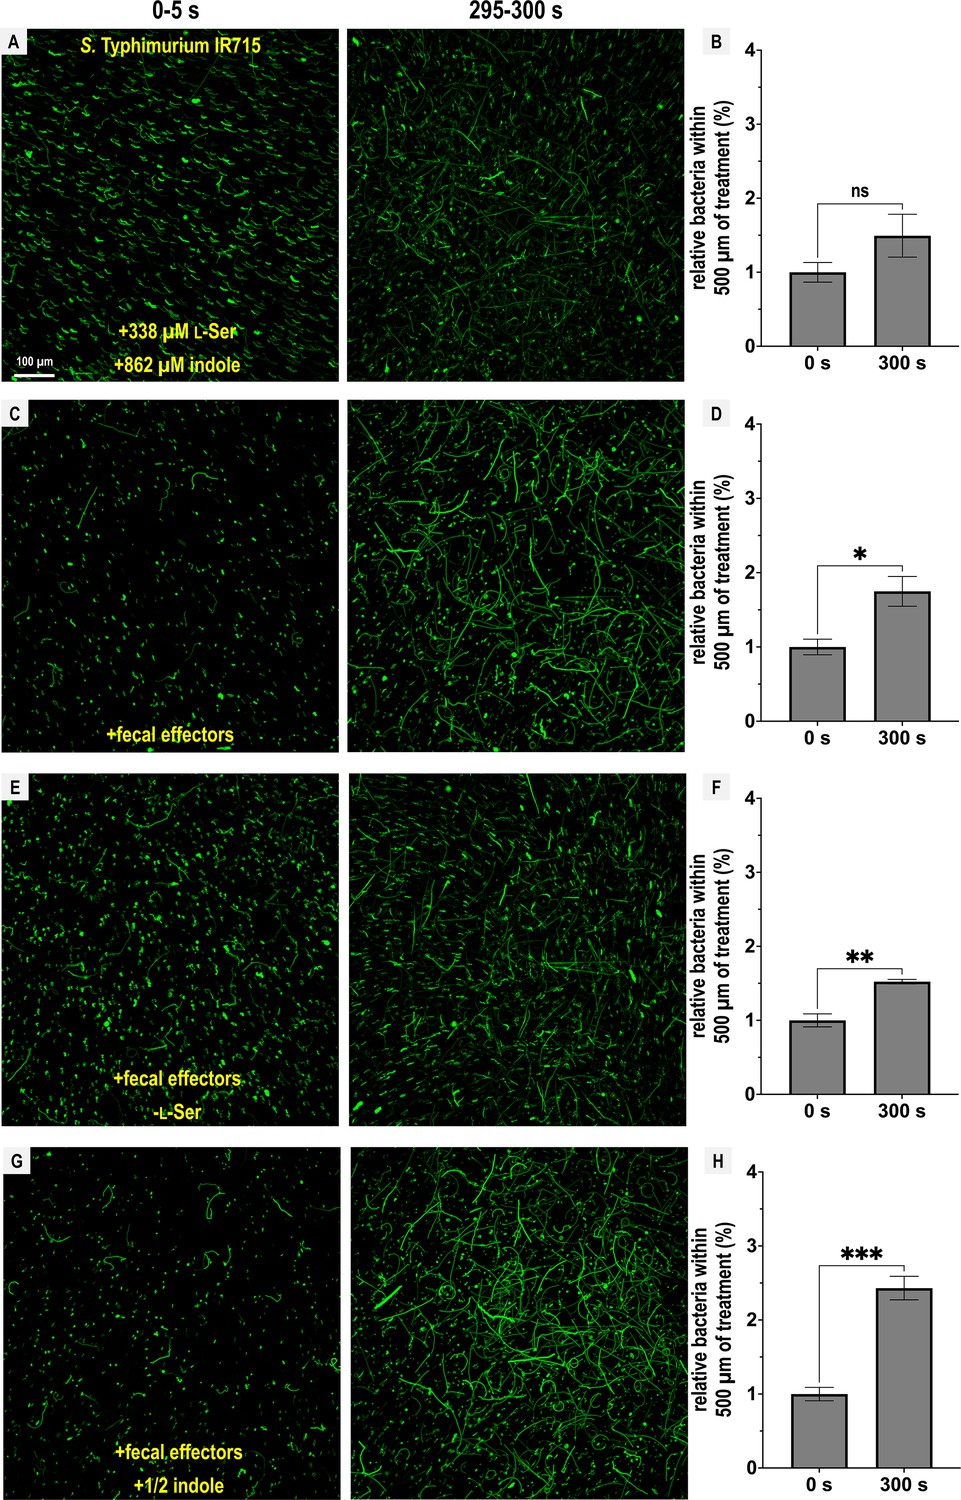
Chemotactic responses to defined fecal effector mixtures.
Chemosensory injection rig assay (CIRA) experiments with S. Typhimurium IR715 were performed with different combinations of fecal effectors (n = 3–5). Max projections are shown from experiments over 5 s before fecal treatment and after 5 min of treatment as well as quantifications of bacteria within 500 µm of the treatment source at these same time points. Data are means and error bars are standard error of the mean (SEM, n = 3–5), with statistical significance denoted (not significant, ns; *p < 0.05, **p < 0.01, ***p < 0.001, ****p < 0.0001). To achieve the greatest degree of sensitivity to differences in responses, experiments were performed using the same culture on the same day. The complete fecal effector mixture consists of indole (862 µM), l-Ser (338 µM), d-glucose (970 µM), d-galactose (78 µM), ribose (28.6 µM), and L-Asp (13 µM), modified to include or exclude certain effectors as indicated. See also Videos 7–10. Data were collected at 30°C.
Figure 6
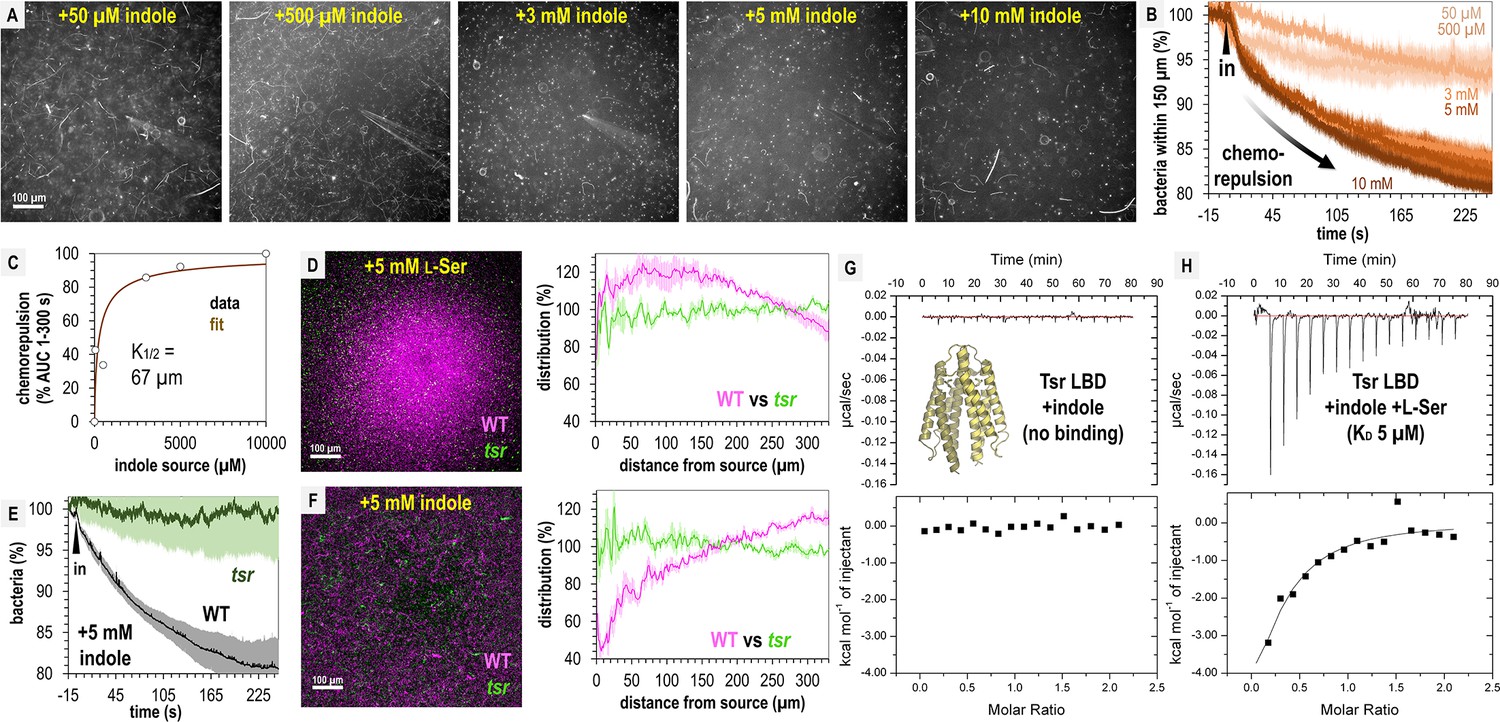
Tsr mediates indole chemorepulsion in S. Typhimurium.
(A) Representative max projections of responses at 295–300 s of indole treatment. (B, C) Quantification of chemorepulsion as a function of indole concentration (n = 3–5). (D–F) Comparison of wildtype (WT) and tsr mutant responses to l-Ser or indole. (E) Quantification of the relative number of cells in the field of view over time following treatment with 5 mM indole for a competition experiment with WT and tsr (representative image shown in F). Data were collected at 30°C. (G, H) Isothermal titration calorimetry (ITC) experiments with 50 μM S. Typhimurium Tsr ligand-binding domain (LBD) and indole, or with l-Ser in the presence of 500 μM indole. Data are means and error bars are standard error of the mean (SEM, n = 3–5). AUC indicates area under the curve.
Figure 7
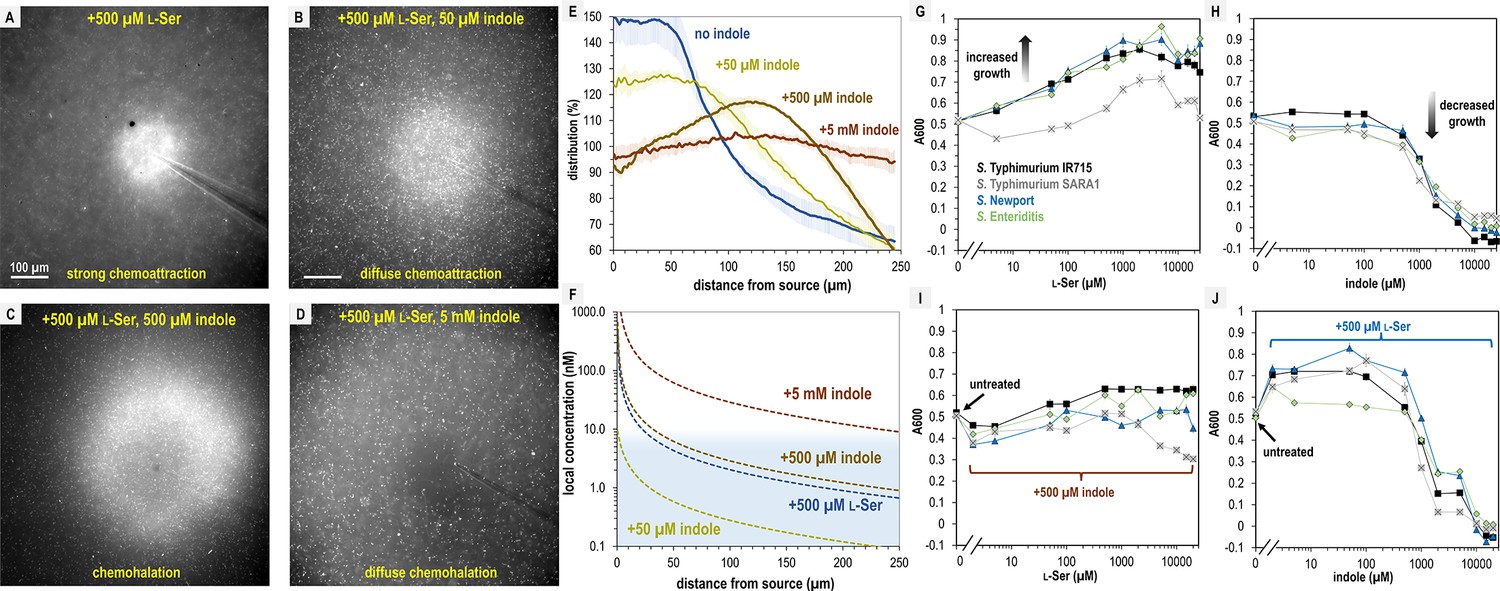
S. Typhimurium mediates distinct chemotactic responses based on the ratio of l-Ser to indole.
(A–D) Representative max projections of responses to treatments of l-Ser and indole at 295–300 s, as indicated. (E) Relative bacterial distribution in response to treatments of 500 µM l-Ser and varying amounts of indole, from panels A–D, with the mean value normalized to 100%. Data were collected at 30°C. Data are means and error bars are standard error of the mean (SEM, n = 3–5). (F) Diffusion modeling of local effector concentrations based on sources of 5 mM indole (dark brown), 500 µM l-Ser (blue), 500 µM indole (light brown), and 50 µM indole (yellow) are shown as dashed lines. The approximate local concentration of indole that elicits a transition in chemotactic behavior is highlighted in light blue. (G, H) Bacterial growth as a function of l-Ser or indole, at the time point where the untreated culture reaches A600 of 0.5. (I, J) Bacterial growth ± pretreatment with 500 µM indole or l-Ser, and increasing concentrations of indole or l-Ser, as indicated at the time point where the untreated culture reaches A600 of 0.5. Data are means and error bars are standard error of the mean (SEM, n = 8–24). See also Video 11.
Figure 8
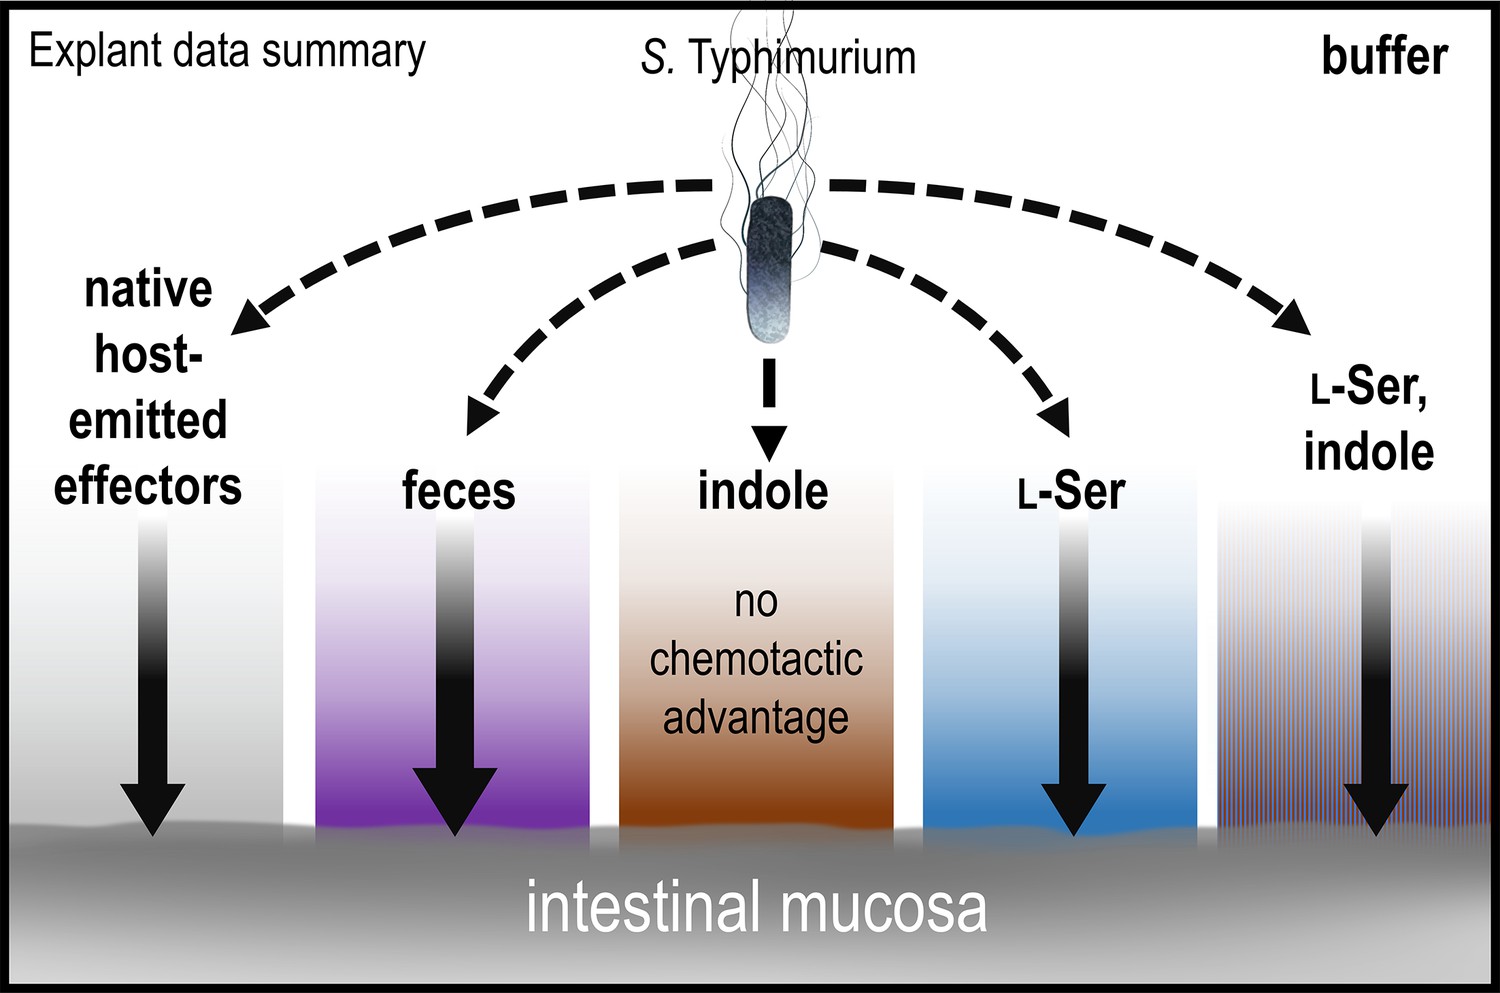
Model and summary for explant infection data.
Based on analyses in this study, we provide this summary of the role of chemotaxis in mediating infection advantages for different tissue pretreatments. The strength of chemotactic advantage for transiting each chemical gradient and accessing the host tissue is indicated by the width of the solid black arrows. The baseline level of chemotactic advantage seen in buffer treatments may be from effectors emitted from the host tissue (gray gradient). Other gradients containing fecal chemoattractants show a similar level of chemotactic advantage, with the highest being for fecal treatment (purple). Only soaking the tissue in pure indole results in a chemical gradient for which chemotaxis and Tsr do not provide an infection advantage. Note that bacteria are exposed only to low concentrations of residual effectors that remain after the tissue is soaked and then transferred to 300 µl of buffer for infection; they are not immersed in the more concentrated effector solution. See also Figure 1, Figure 1—figure supplement 1.
Videos
Video 1
Chemotactic response of S. Typhimurium IR715 to solubilized human feces.
Representative chemosensory injection rig assay (CIRA) experiments showing S. Typhimurium IR715 wildtype (WT) and mutant strains responding to a source over 300 s (shown at 10× speed). Viewable at: https://www.youtube.com/watch?v=BqUcRN3YwjU.
Video 2
Chemotactic response of S. Typhimurium IR715 wildtype (WT) and chemotactic mutant strains to solubilized human feces.
Representative chemosensory injection rig assay (CIRA) experiments showing competition between S. Typhimurium IR715 (mPlum) and cheY, or tsr, as indicated (GFP), over 300 s. Viewable at: https://www.youtube.com/watch?v=D5JL46b4lsI.
Video 3
Chemotactic response of S. enterica clinical isolates to solubilized human feces.
Representative chemosensory injection rig assay (CIRA) experiments showing competition between S. Typhimurium IR715 (mPlum) and clinical isolates, as indicated (GFP), responding to a source of solubilized human feces over 300 s. Viewable at: https://www.youtube.com/watch?v=dLsFDV0XgpY.
Video 4
Chemotactic response of E. coli MG1655 to solubilized human feces.
Representative chemosensory injection rig assay (CIRA) experiment over 300 s. Viewable at: https://youtube.com/shorts/WH6tabDbrw4?feature=share.
Video 5
Chemotactic response of E. coli NCTC 9001 to solubilized human feces.
Representative chemosensory injection rig assay (CIRA) experiment over 300 s. Viewable at: https://youtube.com/shorts/yzU2M4Z_Yf4?feature=share.
Video 6
Chemotactic response of C. koseri 4225-83 to solubilized human feces.
Representative chemosensory injection rig assay (CIRA) experiments with treatment sources as indicated, over 300 s. Viewable at: https://youtube.com/shorts/s_ybO0xcIDw?feature=share.
Video 7
Chemotactic response of S. Typhimurium IR715 to l-Ser and indole treatment at fecal-relevant concentrations.
Representative chemosensory injection rig assay (CIRA) experiment over 300 s. Viewable at: https://youtube.com/shorts/4UEYoBS6jIQ?feature=share.
Video 8
Chemotactic response of S. Typhimurium IR715 to complete mixture of fecal effectors.
Representative chemosensory injection rig assay (CIRA) experiment over 300 s. Viewable at: https://youtube.com/shorts/Yd14m3sI6Pw?feature=share.
Video 9
Chemotactic response of S. Typhimurium IR715 to a mixture of fecal effectors lacking l-Ser.
Representative chemosensory injection rig assay (CIRA) experiment over 300 s. Viewable at: https://youtu.be/5QM116BrHhQ.
Video 10
Chemotactic response of S. Typhimurium IR715 to mixture of fecal effectors with 0.5× indole.
Representative chemosensory injection rig assay (CIRA) experiment over 300 s. Viewable at: https://youtube.com/shorts/OqH0HE2rYIE?feature=share.
Video 11
Chemotactic response of S. Typhimurium IR715 to l-Ser and indole treatments.
Representative chemosensory injection rig assay (CIRA) experiments with treatment sources as indicated, over 300 s. Viewable at: https://www.youtube.com/watch?v=bNQMqF2QMek.
Tables
Key resources table
| Reagent type (species) or resource | Designation | Source or reference | Identifiers | Additional information |
|---|---|---|---|---|
| Strain, strain background (Salmonella enterica serovar Typhimurium) | Salmonella enterica serovar Typhimurium | Rivera-Chávez et al., 2013 | IR715 | Nalidixic acid-resistant derivative of ATCC 14028 |
| Strain, strain background (S. enterica Typhimurium) | S. enterica Typhimurium cheY mutant | Rivera-Chávez et al., 2013 | FR13 | IR715 cheY::Tn10 (TetR) |
| Strain, strain background (S. enterica Typhimurium) | S. enterica Typhimurium tsr mutant | Rivera-Chávez et al., 2013 | FR4 | IR715 tsr::pFR3 (CmR) |
| Strain, strain background (S. enterica Typhimurium) | S. enterica Typhimurium invA mutant | Thiennimitr et al., 2011 | SW399 | IR715 invA::pSW127 (CarbR) |
| Strain, strain background (S. enterica Typhimurium) | S. enterica Typhimurium Clinical Isolate | Beltran et al., 1991 | SARA1 | Isolated from patient in Mexico |
| Strain, strain background (S. enterica Newport) | S. enterica Newport Clinical Isolate | Shariat et al., 2013 | M11018046001A | Isolated from patient in PA, USA |
| Strain, strain background (S. enterica Enteriditis) | S. enterica Enteriditis Clinical Isolate | Shariat et al., 2013 | 05E01375 | Isolated from patient in PA, USA |
| Strain, strain background (Citrobacter koseri) | C. koseri Clinical Isolate | ATCC | BAA-895 | Human Clinical Isolate |
| Strain, strain background (Enterobacter cloacae subsp. cloacae) | Enterobacter cloacae subsp. Cloacae clinical isolate | ATCC | 13047 | Human Clinical Isolate |
| Strain, strain background (Escherichia coli) | E. coli Clinical Isolate | ATCC | 11775 | Human Clinical Isolate |
| Strain, strain background (Escherichia coli) | BL21(DE3) | Millipore Sigma | 70954–3 | Electrocompetent cells |
| Biological sample (Homo sapiens) | Human feces | Lee Biosolutions | 991–18 | See method details |
| Recombinant DNA reagent | XS Plasmid expressing sfGFP | Wiles et al., 2018 | pXS-sfGFP | pGEN-mcs with a modular sfGFP expression scaffold (AmpR) |
| Recombinant DNA reagent | XS Plasmid expressing mPlum | Wiles et al., 2018 | pXS-mPlum | pGEN-mcs with a modular mPlum expression scaffold (AmpR) |
| Peptide, recombinant protein | SeTsr LBD | Glenn et al., 2024 | See ‘Method details’ |
Additional files
-
Source data 1
CFUs from explant infection assays.
- https://cdn.elifesciences.org/articles/106261/elife-106261-data1-v1.xlsx
-
MDAR checklist
- https://cdn.elifesciences.org/articles/106261/elife-106261-mdarchecklist1-v1.docx
-
Supplementary file 1
Summary of prior studies related to indole chemotaxis.
- https://cdn.elifesciences.org/articles/106261/elife-106261-supp1-v1.docx
Download links
A two-part list of links to download the article, or parts of the article, in various formats.
Downloads (link to download the article as PDF)
Open citations (links to open the citations from this article in various online reference manager services)
Cite this article (links to download the citations from this article in formats compatible with various reference manager tools)
Navigating contradictions in enteric chemotactic stimuli
eLife 14:RP106261.
https://doi.org/10.7554/eLife.106261.3


