Swarming bacteria undergo localized dynamic phase transition to form stress-induced biofilms
- Warwick Medical School, Universityof Warwick, United Kingdom
- Centre for Mechanochemical Cell Biology, University of Warwick, United Kingdom
- Physics Department, University of Warwick, United Kingdom
- Mediterranean Institute for Advanced Studies (IMEDEA UIB-CSIC), C/ Miquel Marqués, Spain
- Bio-Electrical Engineering Innovation Hub, University of Warwick, United Kingdom
- Warwick Integrative Synthetic Biology Centre, University of Warwick, United Kingdom
- School of Life Sciences, University of Warwick, United Kingdom
Figures
Figure 1
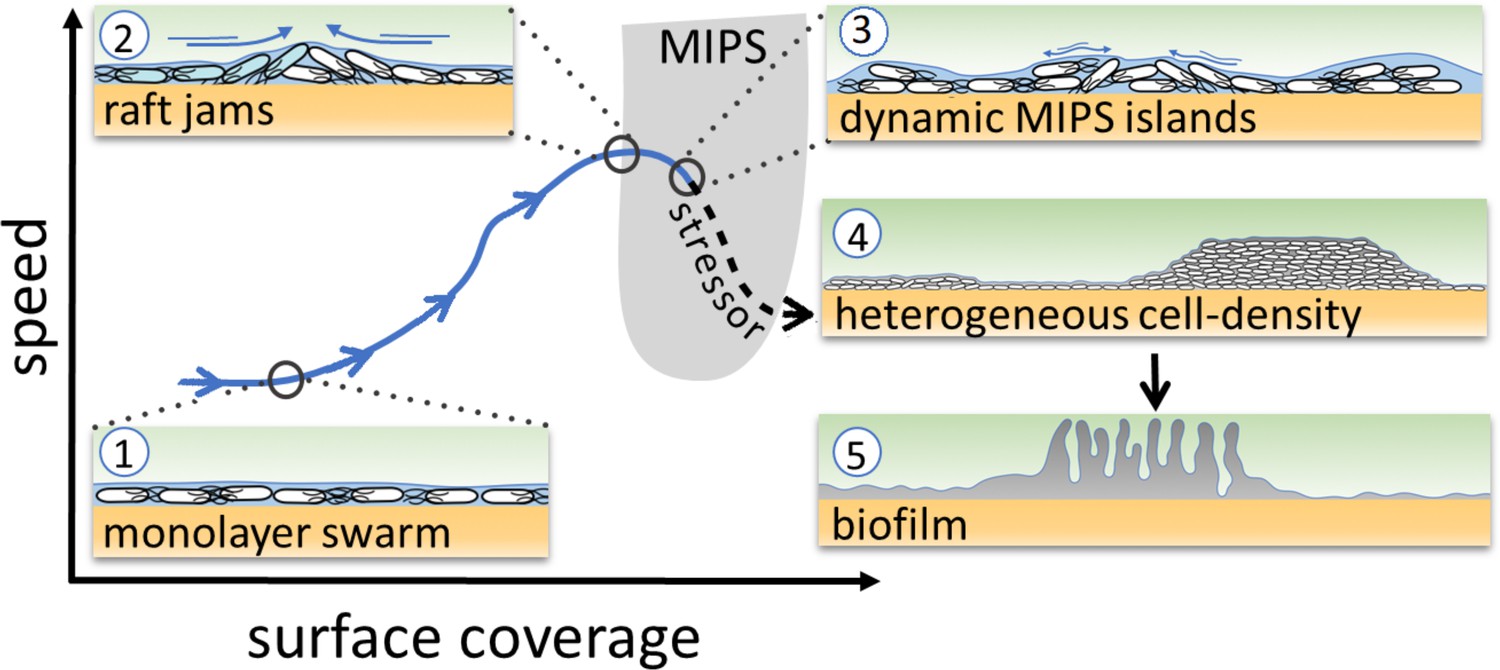
Schematic of the transition from swarming to biofilm formation through MIPS.
B. subtilis cells swarm in a monolayer (stage 1). As cell density increases, cells form fast-moving rafts which can collide and form transient jams. Cells at the boundary between the colliding rafts are pushed upwards and protrude from the surrounding monolayer (stage 2). Further increase in surface coverage can promote the formation of dynamic MIPS-like islands where cells accumulate within the swarm while still being dynamic (stage 3). Eventually, this uneven distribution of cells gives rise to macroscopic spatial heterogeneity in cell density (stage 4), which can lead to the formation of biofilms (stage 5).
Figure 2 with 7 supplements
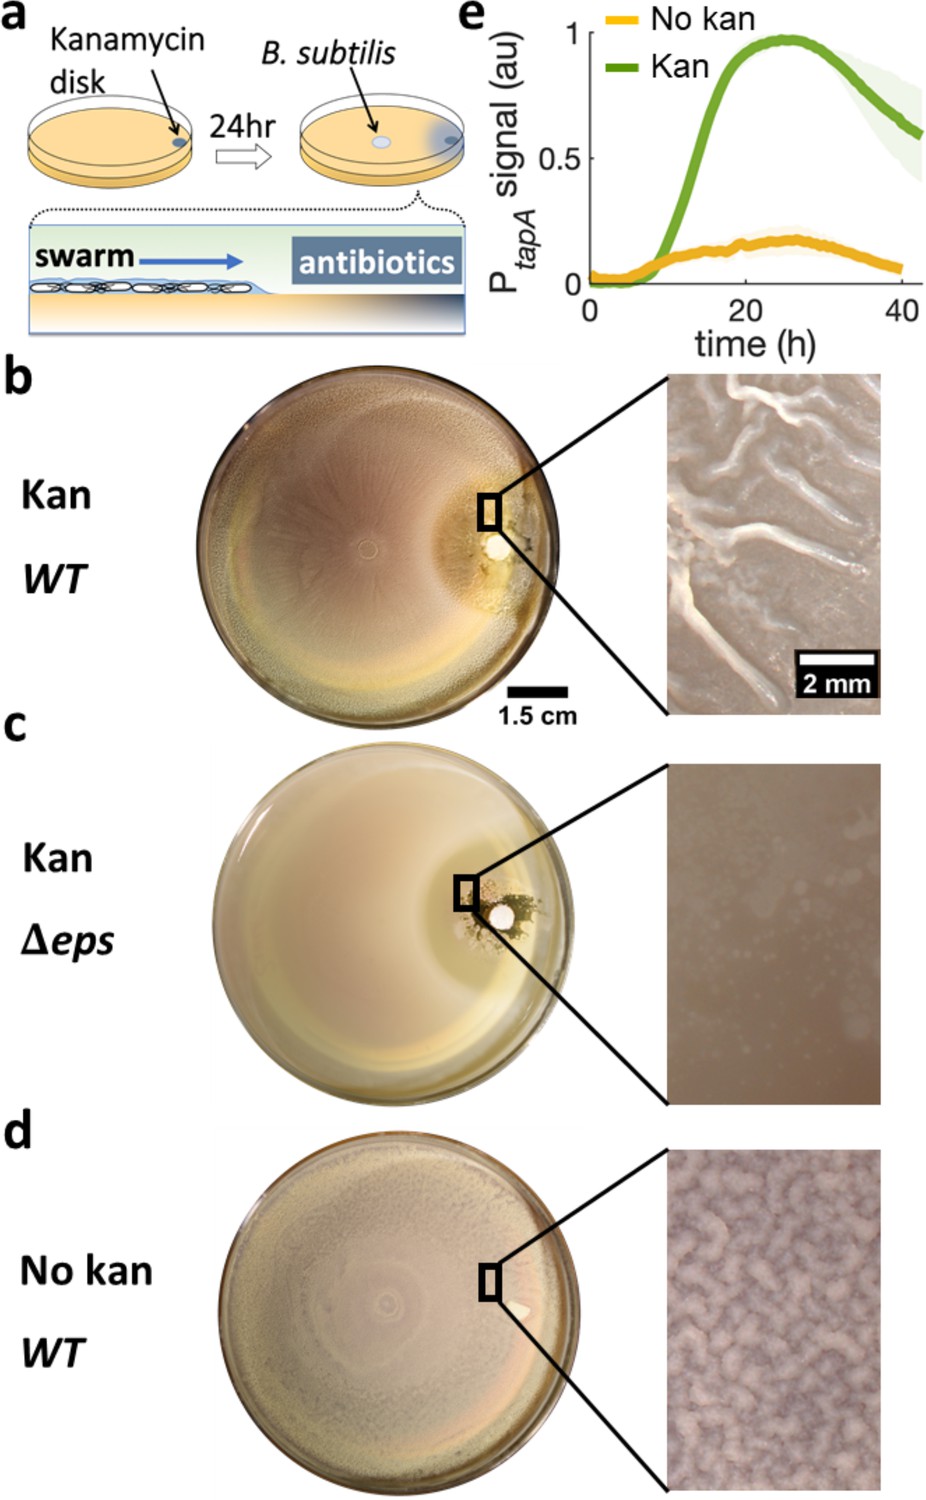
Swarming cells transit into biofilm in the presence of kanamycin gradient.
(a) Schematics of swarming bacteria expanding from the center of a 9-cm Petri dish toward a kanamycin-diffusive disk. Kanamycin disk was placed for 24 hr to form a spatial gradient (Figure 2—figure supplement 1). (b, c, d) Swarming B. subtilis plates after 40 hr incubation. Wrinkles are formed at the region ~2 cm away from disk with (b) wildtype (WT), but not with (c) Δeps deletion strain. (d) WT swarming plate with a diffusive disk without antibiotics. Zoomed images show the colony surface. (e) Mean fluorescence intensity of PtapA-yfp was measured in the region just after the depletion zone created by the kanamycin-diffusive disk (green). A region in a similar location was measured in absence of kanamycin (yellow). The mean was taken from three independent experiments. The shady areas represent the s.e.m.
Figure 2—figure supplement 1
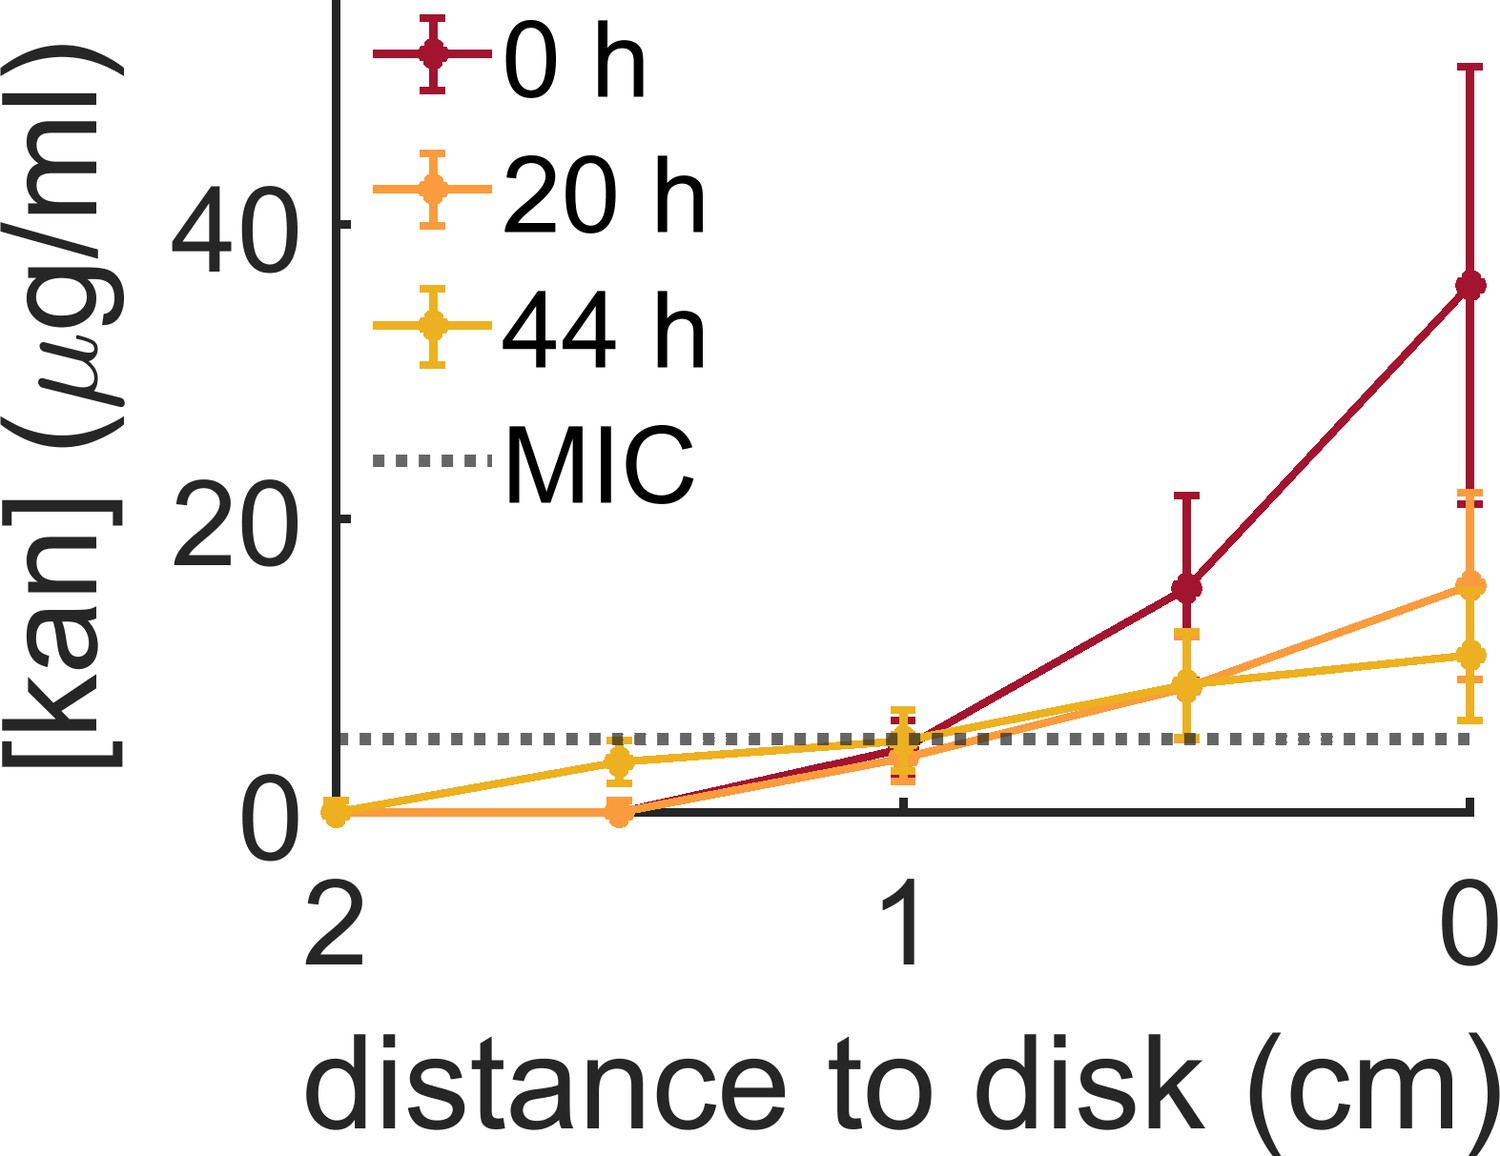
Evolution of the kanamycin profile along the plate measured from the kanamycin disk.
The initial profile was made by placing a kanamycin-diffusive disk for 24 hr on the swarming agar plate. At this point, bacteria were inoculated in the center of the plate (t = 0 hr). The kanamycin concentration was measured again 20 and 44 hr later to check the evolution of the gradient with time. The MIC for B. subtilis (5 µg/ml) has been indicated with a dotted line. Data indicate the mean and s.e.m. of three independent replicates.
Figure 2—figure supplement 2
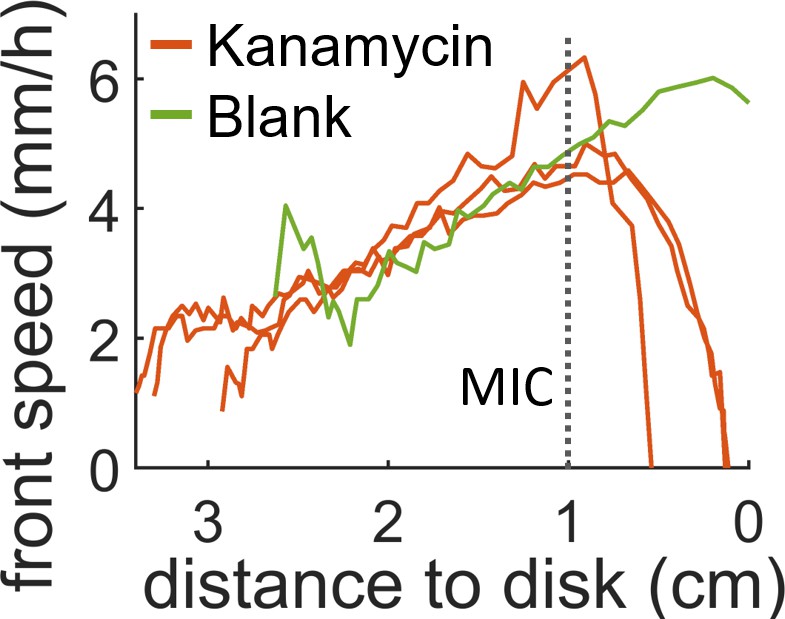
Speed of the swarming front when approaching the diffusive disk.
In presence of antibiotic the front speed rapidly decays and then halts completely before it reaches the disk. When a blank disk is placed the swarm invades the whole plate and no decay in speed is observed (green curve). The position which corresponds to the MIC (dotted line) was calculated by looking at the position of the MIC line in Figure 2—figure supplement 1 for t = 0 hr.
Figure 2—figure supplement 3
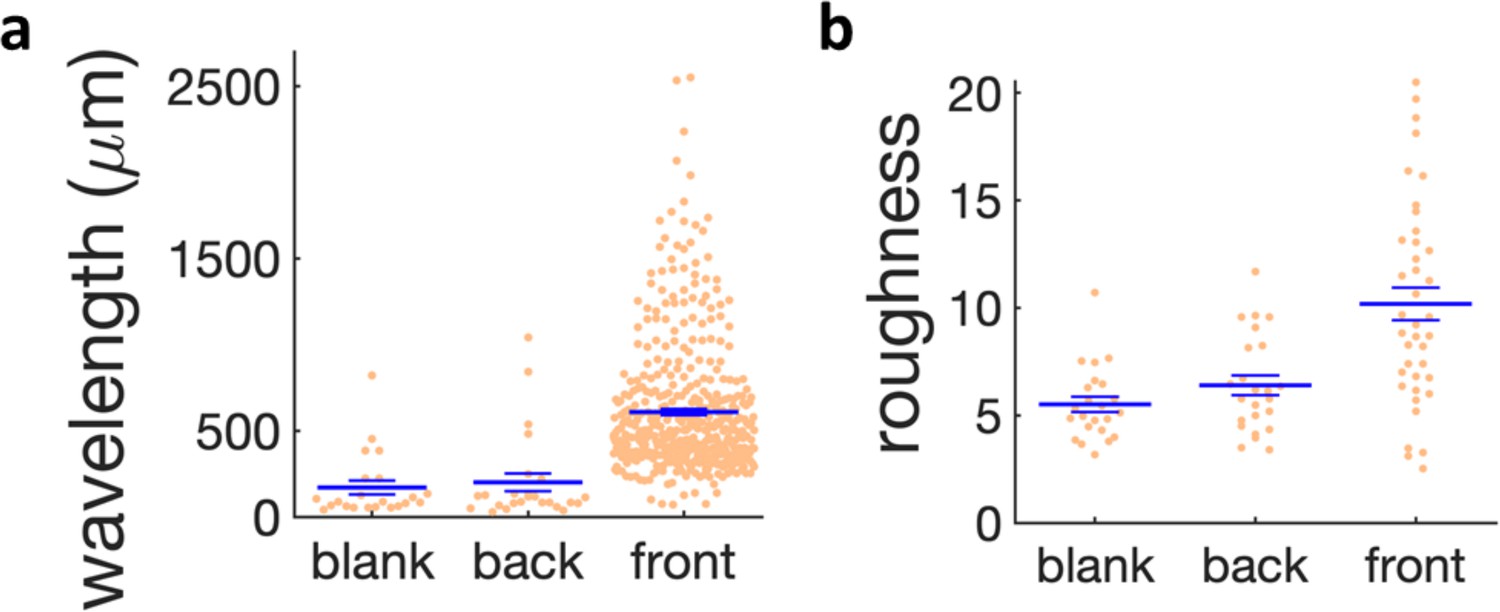
Quantification of wrinkle formation for different regions in the kanamycin plate and in the blank case.
(a) Scatter plot of the wavelength of the wrinkles near the kanamycin disk (front), in the bulk of the plate (back) and in absence of kanamycin (blank). (b) Scatter plot of the roughness of the wrinkles in the same regions. The large horizontal line shows the mean of the distributions and the small bars the s.e.m.
Figure 2—figure supplement 4
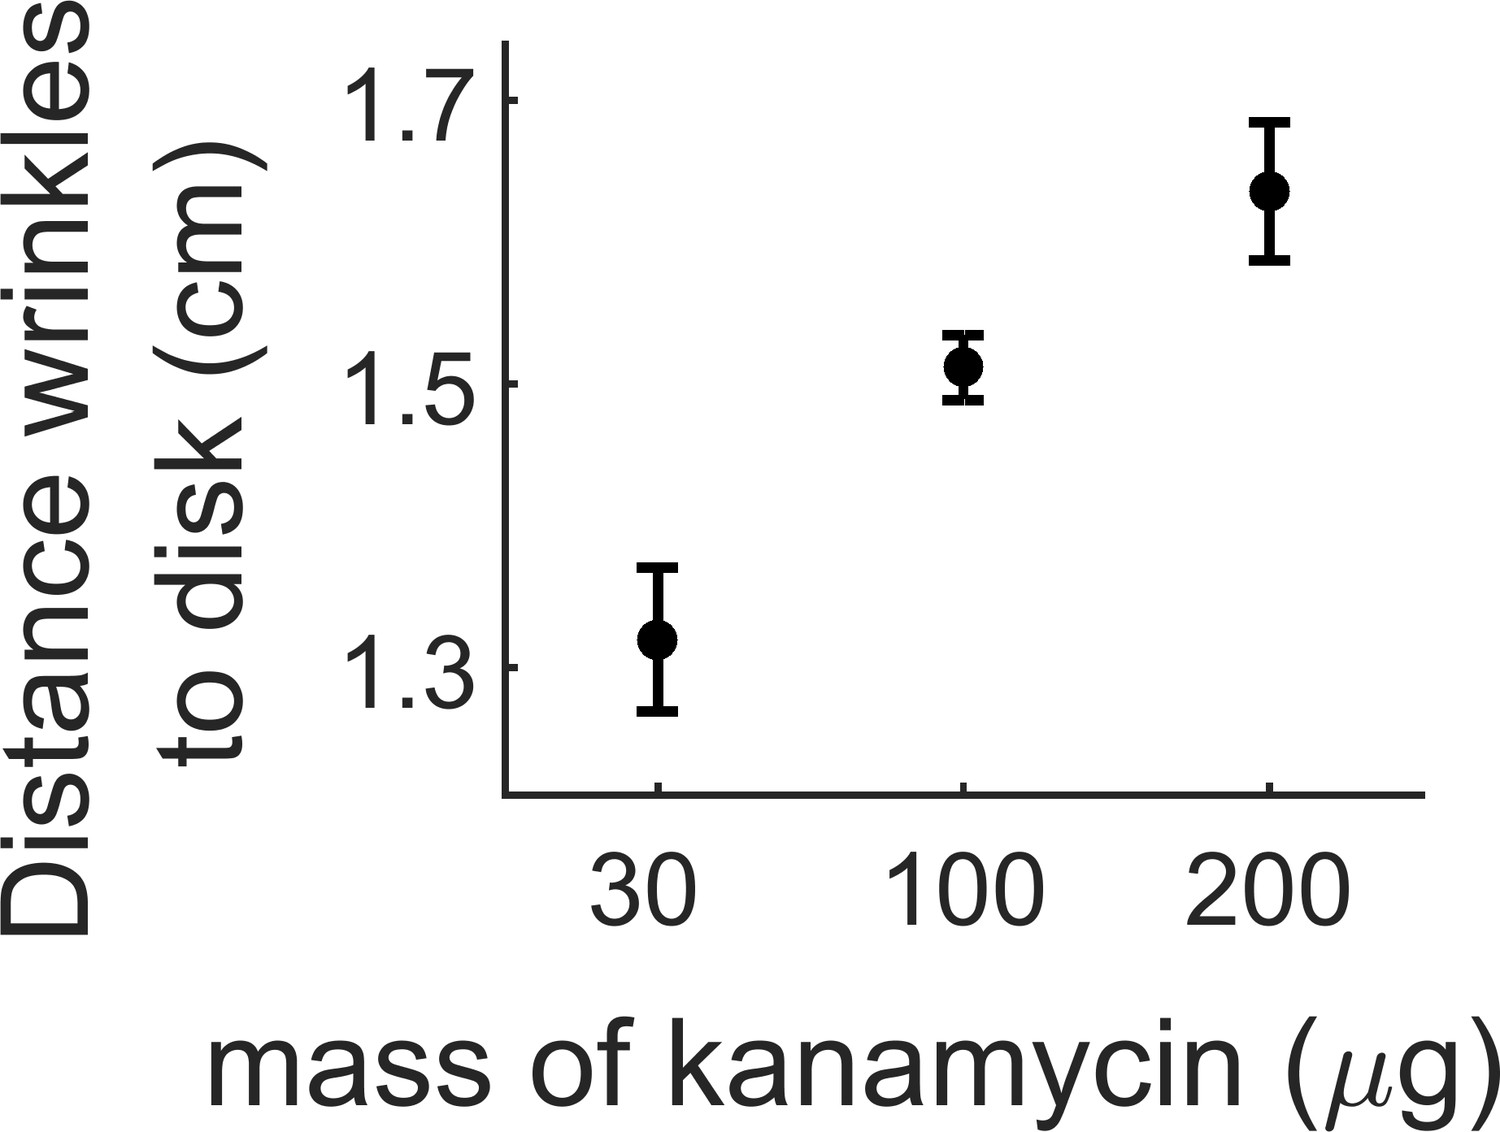
Distance where the wrinkles appear depending on the amount of kanamycin in the diffusive disk.
The wrinkles appear further from the kanamycin disk with increasing concentration of the antibiotic. The data for 100 µg comes from three replicates in a single experiment. Data for 30 and 200 µg come at least from three different replicates.
Figure 2—figure supplement 5
The plate inoculated with swarming B. subtilis showed no wrinkles even after a week incubation at 30°C.
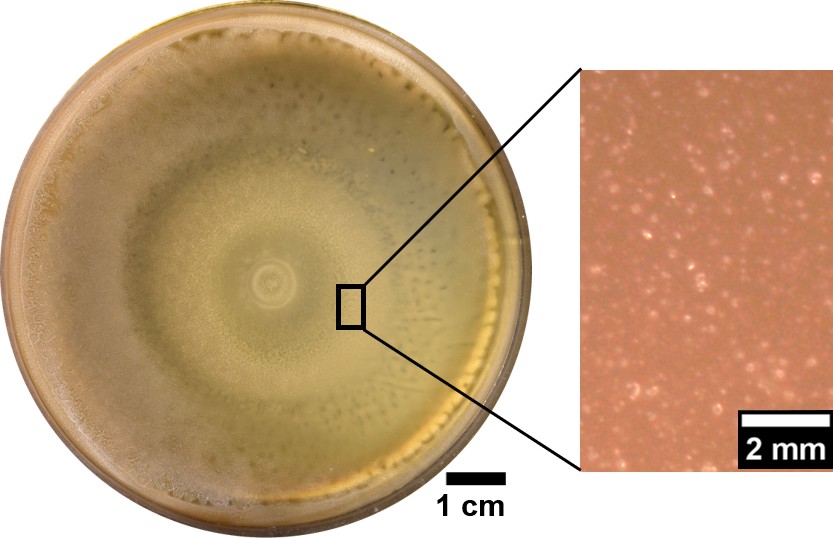
Figure 2—figure supplement 6
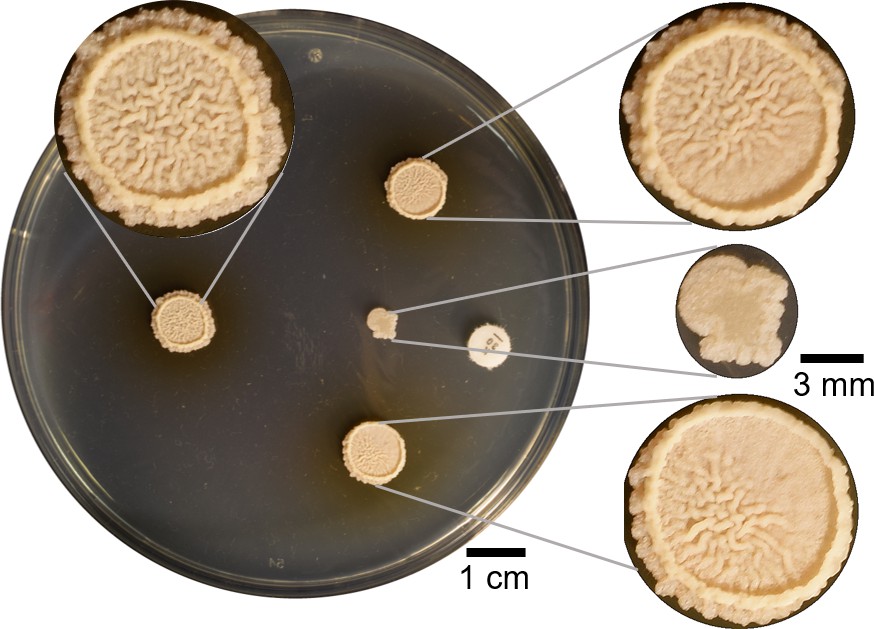
Four µl of B. subtilis were spotted in four different points on a hard agar plate.
The colony spotted 2 cm away from kanamycin was inhibited and a wrinkly biofilm did not grow. Other two colonies on both sides were spotted so just part of the colony were affected by the kanamycin. Both of them showed partial inhibition of wrinkles in the sides closest to the kanamycin disk. The colony at the back in absence of antibiotic is a commonly wrinkly biofilm in LBGM.
Figure 2—figure supplement 7
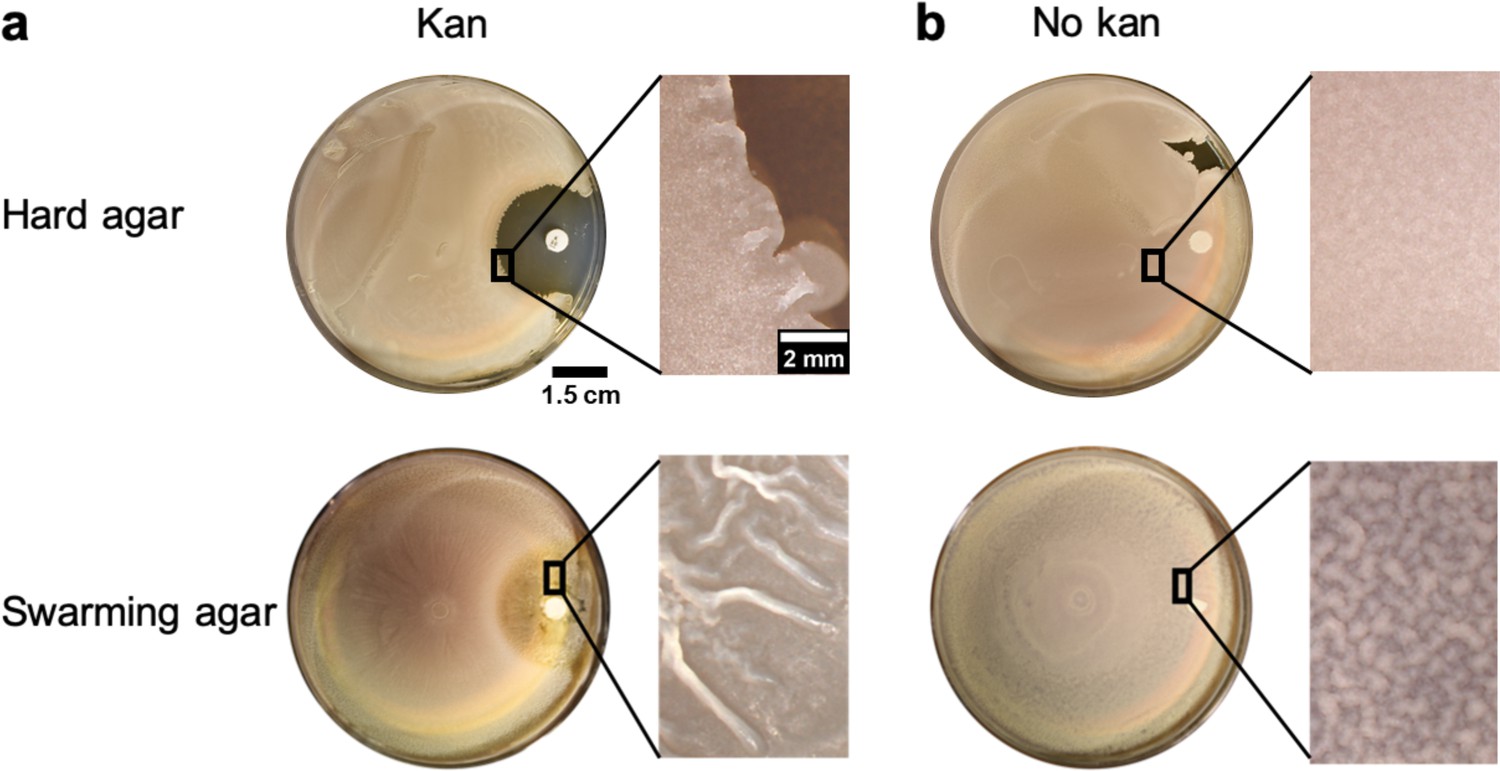
Comparison of wrinkle formation between hard agar and swarming agar in presence of a gradient of kanamycin.
(a) Weak wrinkles appeared at the edges of the clearance zone made by kanamycin for the hard agar case in comparison to the swarming agar case. (b) In the blank disk case, there was a slight surface roughness and wrinkles were not formed in hard agar or weakly formed in swarming agar.
Figure 3 with 4 supplements
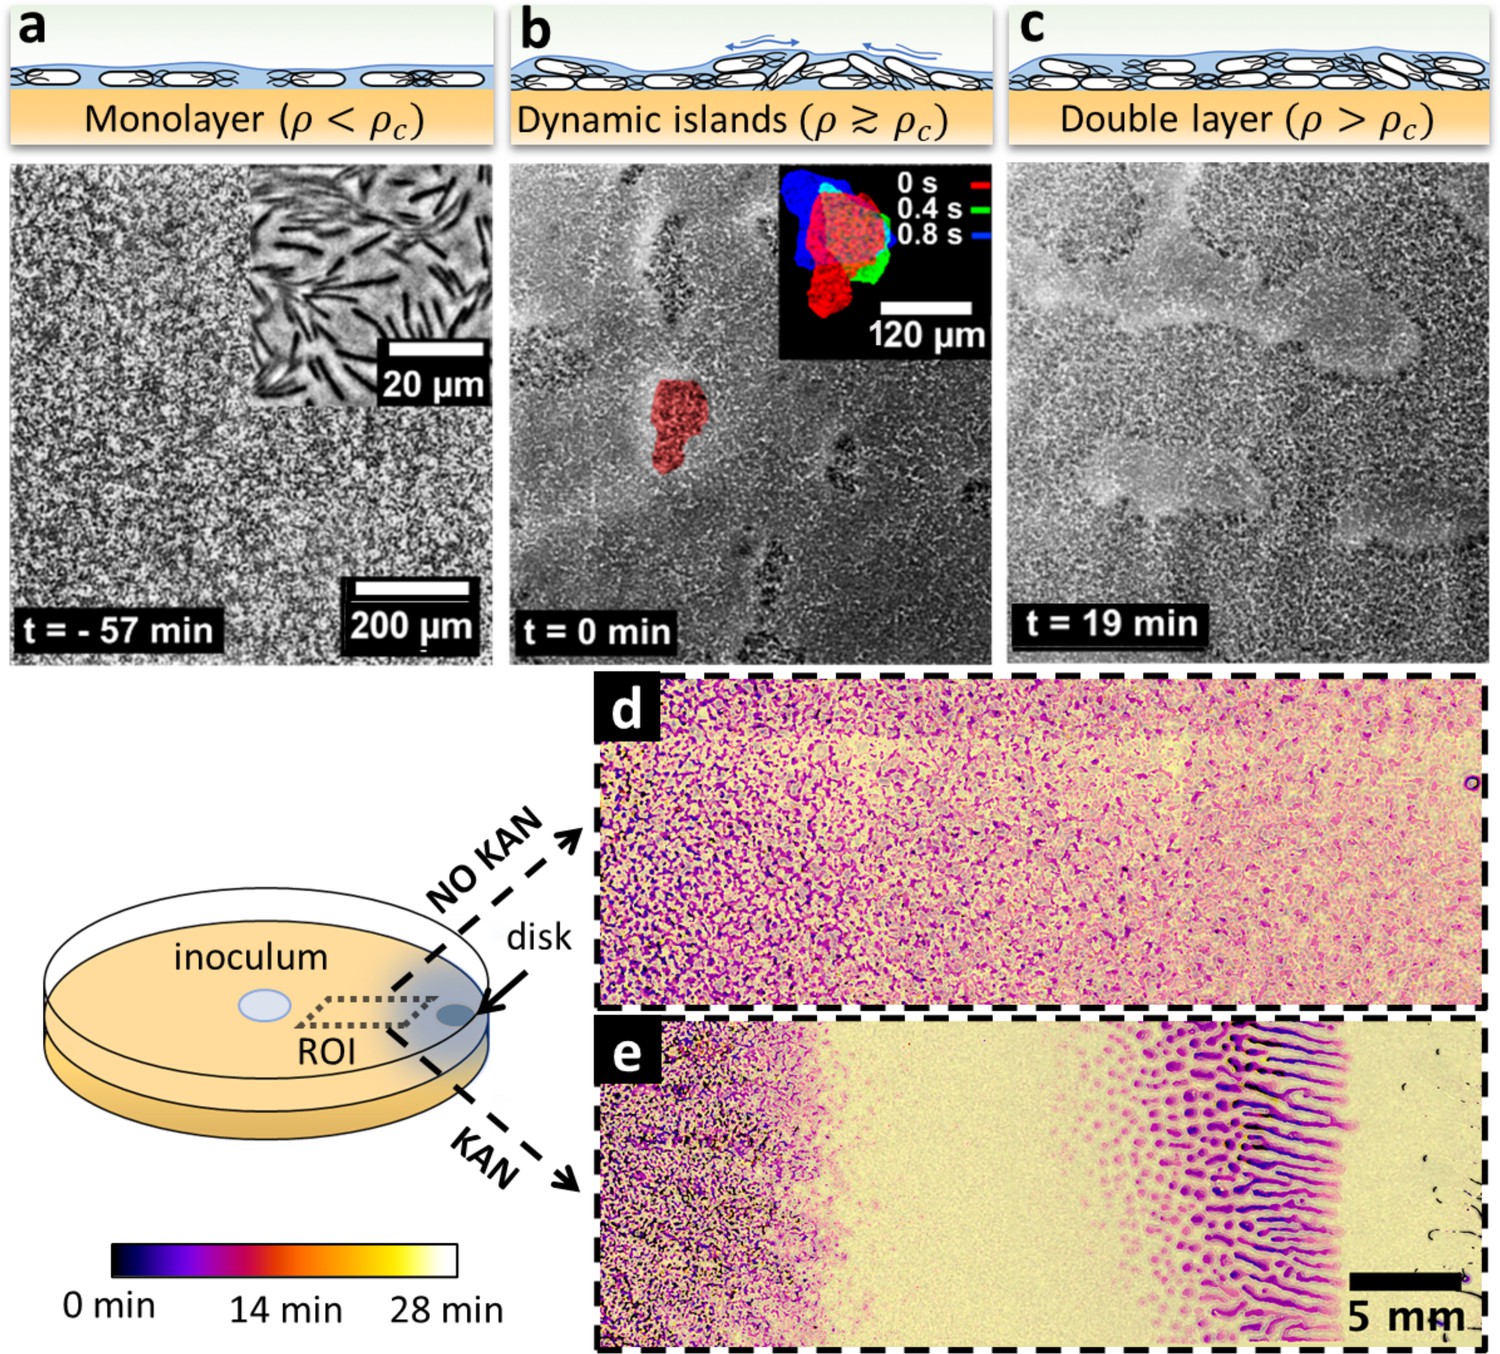
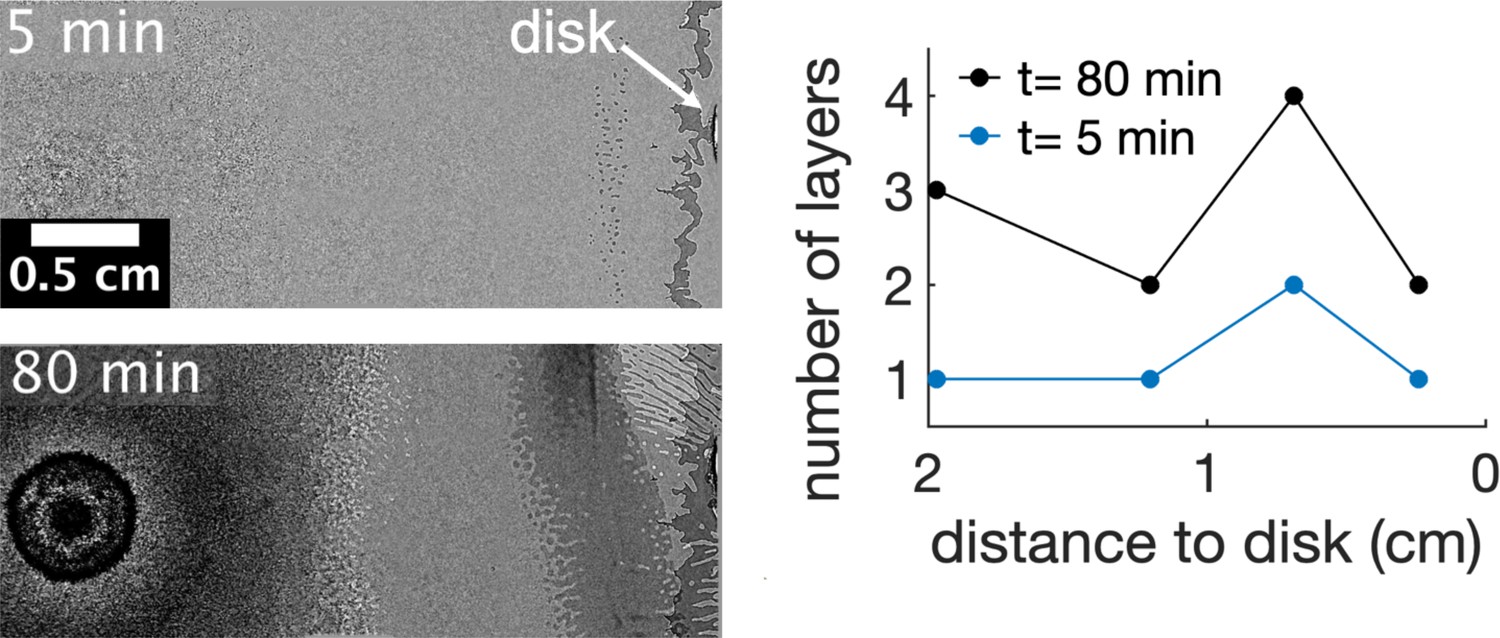
Swarming bacteria form patterned multilayer regions in presence of kanamycin.
(a, b, c) Microscopy images of swarming bacteria and side-view illustrations at different levels of cell density (). Timestamp is relative to the formation of dynamic multilayer islands. (a) When cell density is below a threshold , cells swarm in a monolayer. Image is 57 min prior to islands formation. Inset is a zoomed image showing swarming rafts. (b) Increase in cell density leads to formation of second layers, that appear as darker regions in the swarm. These islands are highly dynamic, and cells are motile. The shape of the islands changes dynamically within 1 s (insert). See also Video 4. (c) Over time, the islands increase their size and merge together to form double-layered regions, coexisting with mono-layered regions. Double-layered regions are seen darker than mono layered regions. (d, e) Images of swarming colony with and without kanamycin. The diagram illustrates the regions of interest (ROI) used for the panels. The dynamics of island formation are color coded using the lookup table. The origin of times is the appearance of island. The earliest islands correspond to the darkest colors whereas the new features correspond to the lightest ones. See also Video 6. (d) In the absence of kanamycin, multilayer regions are much grainer with no clear patterns of propagation. (e) In the presence of kanamycin, multilayered regions have a defined pattern, starting from the regions closer to kanamycin to form an elongated shape. These regions appear predominantly at ~7 mm away from kanamycin.
Figure 3—figure supplement 1
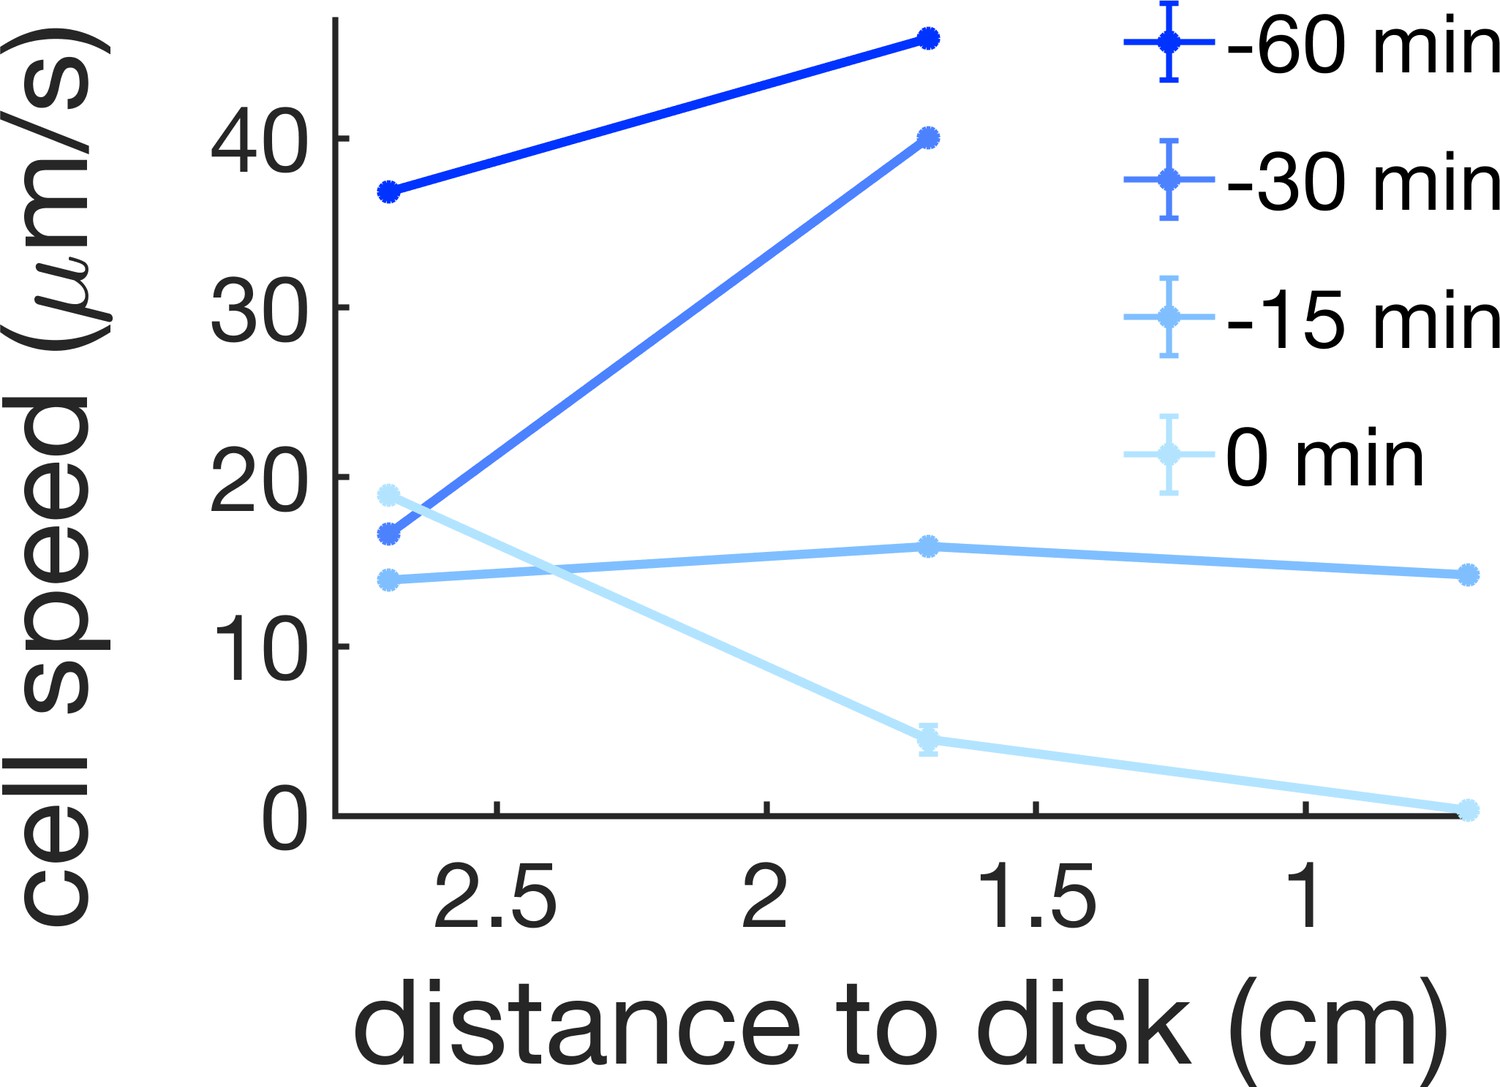
Cell speed at 0.7, 1.7, and 2.7 cm away from the kanamycin disk for a time interval of 1 hr before the initial formation of the islands (0 min corresponds to island formation at 1.7 cm).
For reference, in our kanamycin experiments the islands form within a band that goes from ~1.7 cm from the disk to just before the region where cells are immotile.
Figure 3—figure supplement 2
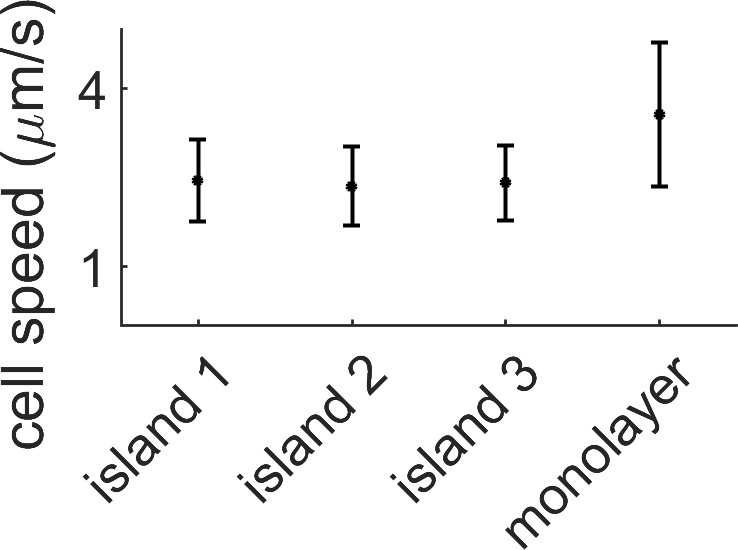
Average speed in the monolayer vs speed within the island.
The average cell speed of the swarm was measured by PIV for three different multi-layered regions and for the monolayer surrounding them. The speed in the monolayer is almost double the multilayer case. Data comes from a single replicate.
Figure 3—figure supplement 3
Asymmetric multilayer formation along time in presence of kanamycin.
The multilayer starts 0.7 cm away from the kanamycin disk. The formation of these islands marks where the multilayer first develops. Here, the number of layers continuously increases but it does not spread towards the center of the swarm giving rise to a gap in cell density between the swarming front and the center. The number of layers were measured by the number of times that a darker layer could be observed in the field of view. The origin of times is when the first island is seen in the field of view. Data taken from a single replicate.
Figure 3—figure supplement 4
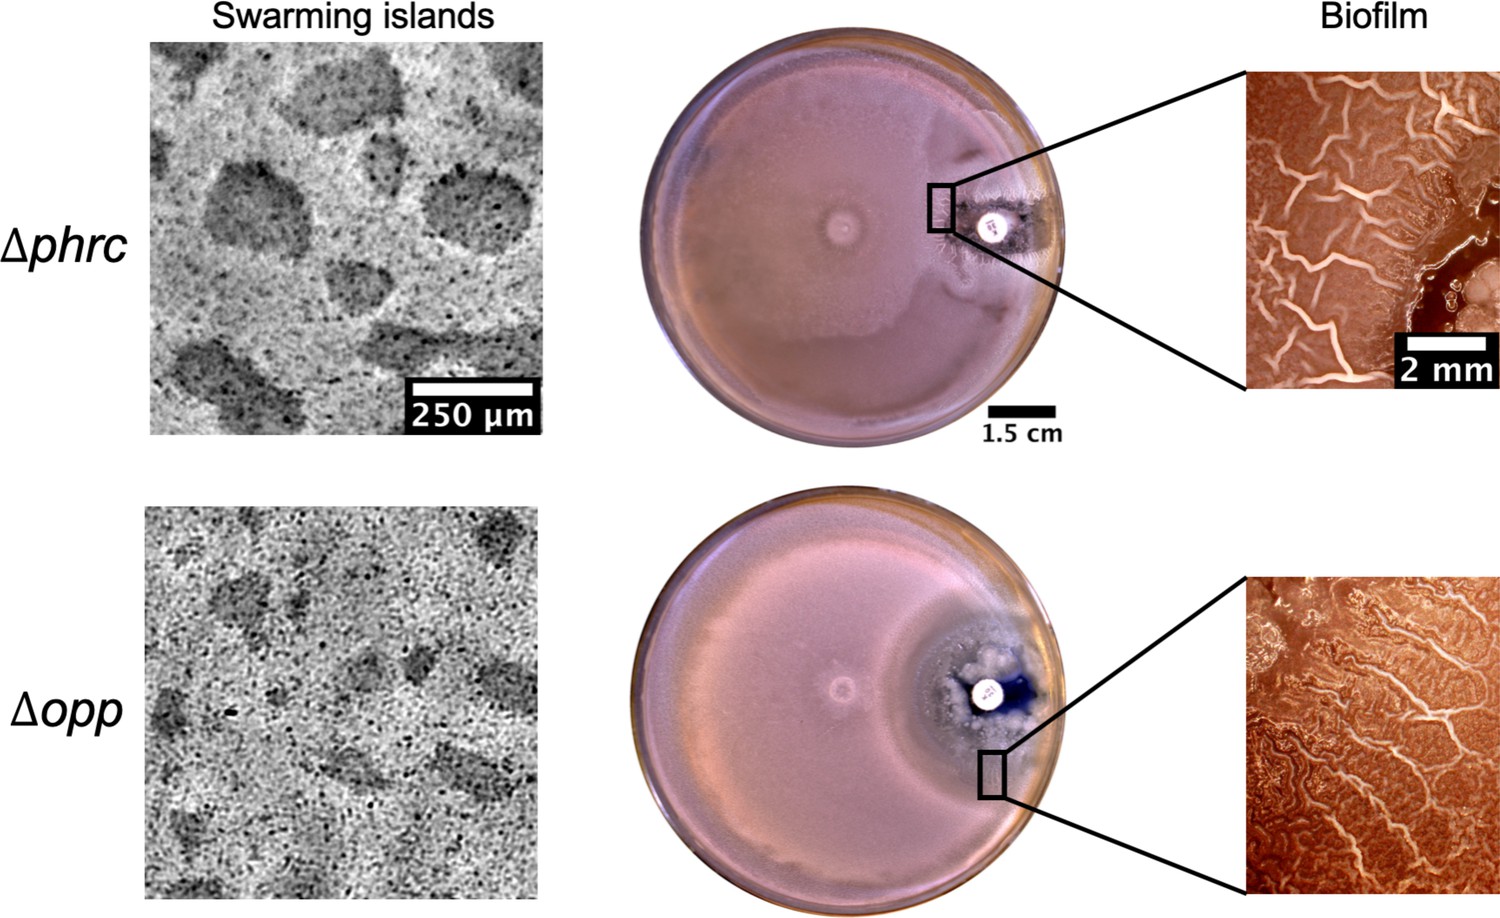
Islands and posterior wrinkle formation in presence of a kanamycin gradient by the quorum sensing knockout strains Δphrc and Δopp.
For both mutants the islands and the wrinkles were formed as in WT. The smaller clearance zone around kanamycin in the phrc case is due to its genetic resistance to neomycin.
Figure 4 with 1 supplement

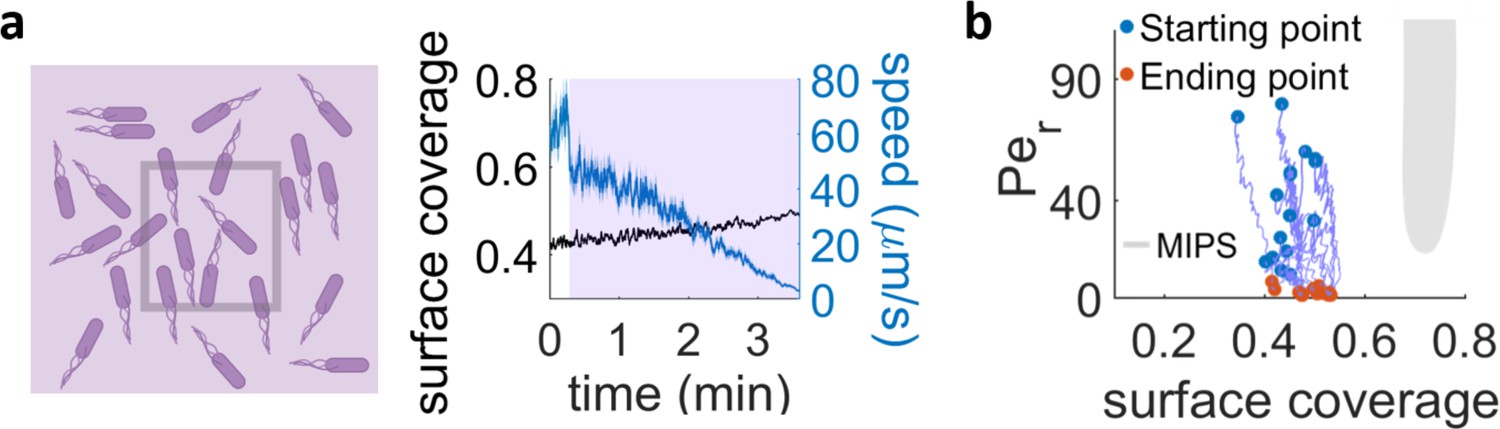
The interplay between cell density and cell speed primes jamming and multi-layer formation.
(a) Phase diagram of surface coverage and the rotational Péclet number (). is proportional to cells' speed (see Materials and methods). Grayed region depicts motility-induced phase separation (MIPS) heterogeneity. Each data point represents a result of a 4-s single-cell time-lapse microscopy data. The time-lapse data in which jamming events are observed are shown in red (see Video 3). Jams appear exclusively under the conditions near the border of the MIPS region. (b) The speed of motile cells drops by half during jamming (highlighted by dashed rectangle). Increase in jamming events lead to formation of islands (see Figure 2 and Video 4). (c, left) Illustrative diagram showing the accumulation of cells by UV irradiation. Cell speeds drop within the irradiated region (show by purple square), which elevates the surface coverage. (c, right) UV irradiation elevates surface coverage. The graph shows the dynamics of surface coverage (black) and cell speed (cyan). Magenta is the period with UV light illumination (1.2 mW/mm2). Vertical dashed line shows the onset of jamming events. (d) Time evolution trajectories of surface coverage and rotational Péclet number with UV illumination experiment. Blue dots are before UV illumination and red dots are when jams appear. Increasing surface coverage by UV induces formation of jams at the border to MIPS region (gray).
Figure 4—figure supplement 1
Exposure with UV light of an area much larger than the field of view.
(a) When a region approximately four times larger than our field of view is irradiated, the surface coverage within the field of view stays nearly constant and we can see a drop in cell speed over time. (b) Trajectories in the phase diagram for bacteria in the field of view, continuously irradiated with the conditions in (a). The systems mainly just decrease their Péclet number and hence never approach the MIPS region.
Figure 5 with 1 supplement
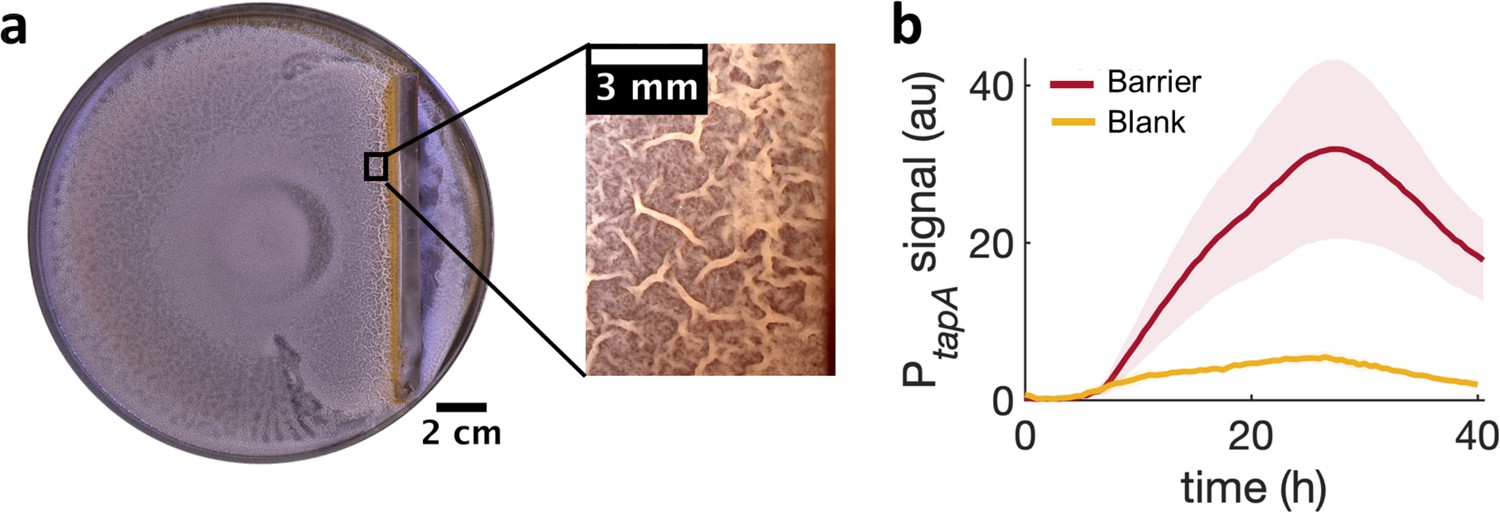
Locally increasing cell density is sufficient to induce wrinkle formation.
(a) A physical barrier placed on agar triggers wrinkle formation. Wrinkles are formed at the region close to the barrier. A plate was incubated for 40 hr as in Figure 1. (b) Mean fluorescence intensity of PtapA-yfp measured just by the barrier for four different experiments and for two different experiments in the blank case. The shade indicates the s.e.m.
Figure 5—figure supplement 1
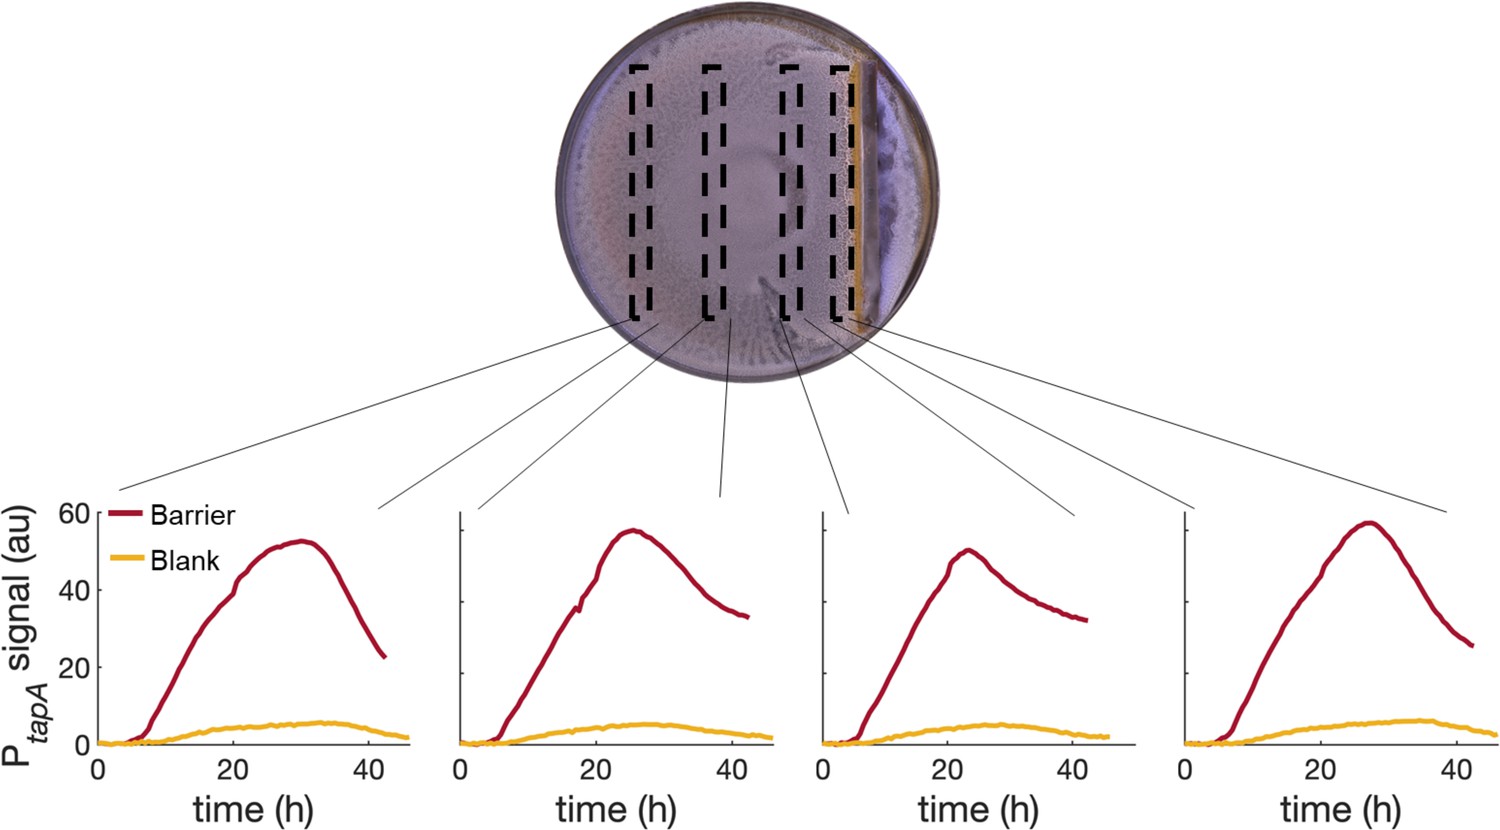
PtapA-yfp expression for four different regions across a swarming plate with a physical barrier in it.
The fluorescent profiles are very similar across the plate, indicating that the tapA-sipW-tasA operon is upregulated equally in the whole plate and not just next to the stressor (the physical barrier in this case).
Figure 6 with 2 supplements
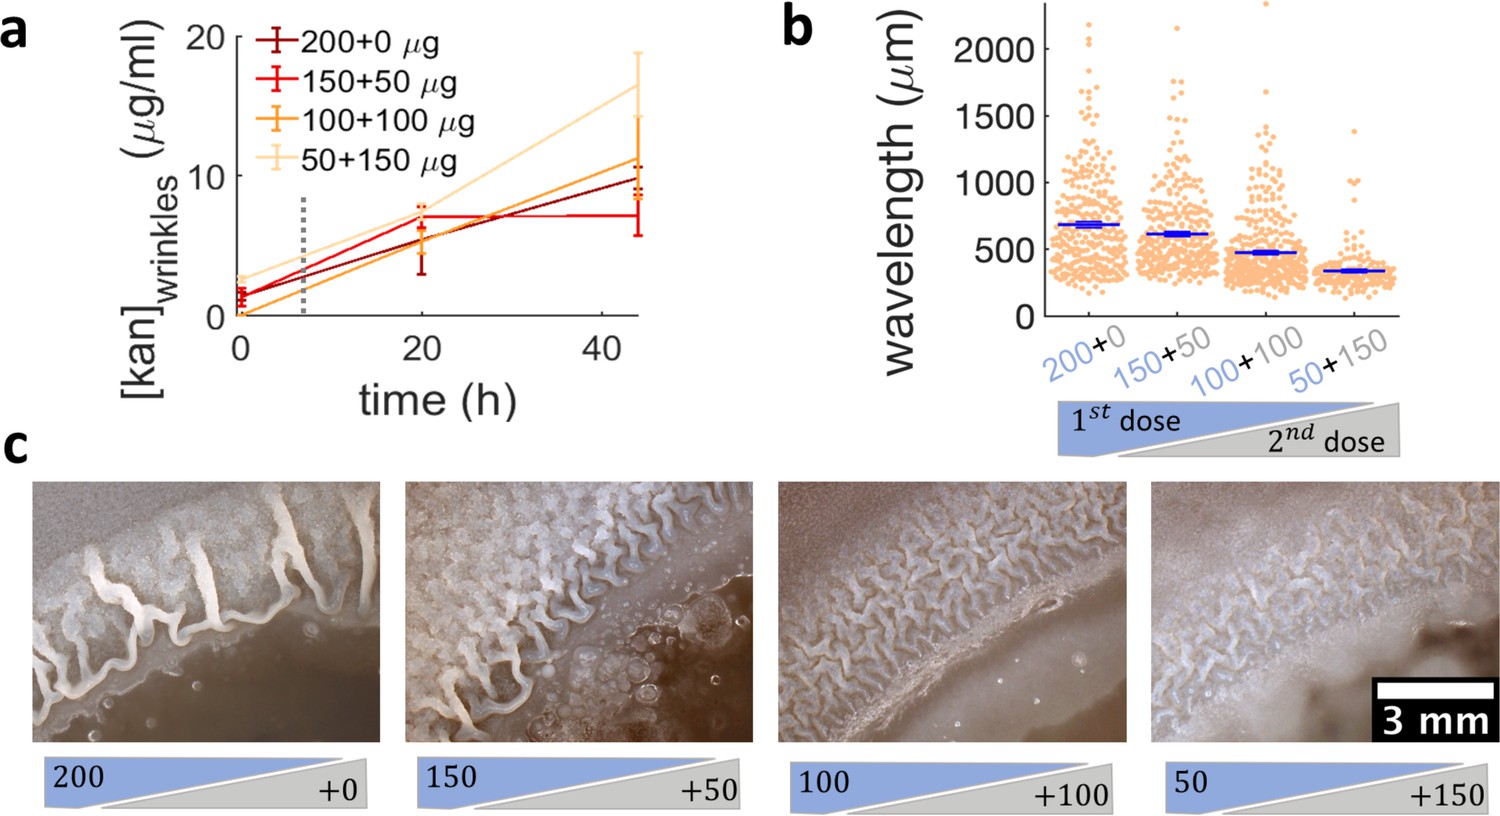
Administering the same amount of kanamycin in two sequential doses reduces wrinkle formation.
(a), (b), (c) Kanamycin was sequentially administered in two different doses to a disk while keeping the total amount at 200 µg. The first administration was added as in other experiments, while the second was added to the disk as a 4 µl drop when the islands were about to appear. (a) Concentration profile of kanamycin over time for the four concentrations of the sequential administration of antibiotic assay. The measurements were made using the modified Kirby-Bauer assay (see Materials and methods) at the distance from the kanamycin disk where the wrinkles are formed for the four different initial concentrations: 1.32 cm for 50 µg, 1.59 cm for 100 µg, 1.74 cm for 150 µg, and 1.85 cm for 200 µg. The time when the second dose of antibiotic is added is indicated with a dotted gray line (~7 hr after inoculation). (b) The wavelengths of wrinkles with respect to the doses of first (blue font) and second (gray font) administrations (µg). (c) Microscopy images of wrinkles induced by kanamycin. The first dose is in the blue shade and the second dose in the gray shade.
Figure 6—figure supplement 1
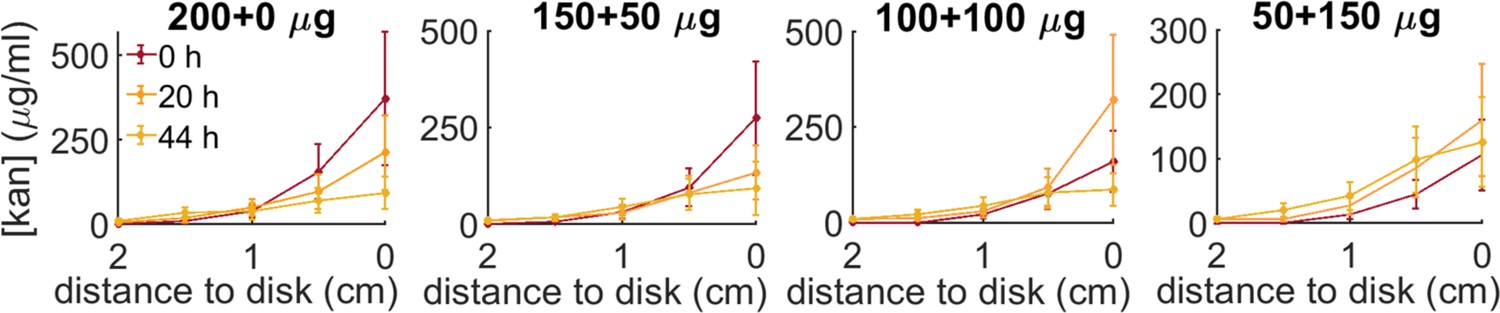
Kanamycin concentration profiles for the four administration protocols (200 µg-0µg; 150–50; 100–100; 50–150) at increasing distances from the kanamycin disk along the radius connecting the inoculation point to the antibiotic disk.
The profiles are measured at 0 hr, 20 hr, 44 hr, starting when the front propagation towards the kanamycin disk stopped.
Figure 6—figure supplement 2
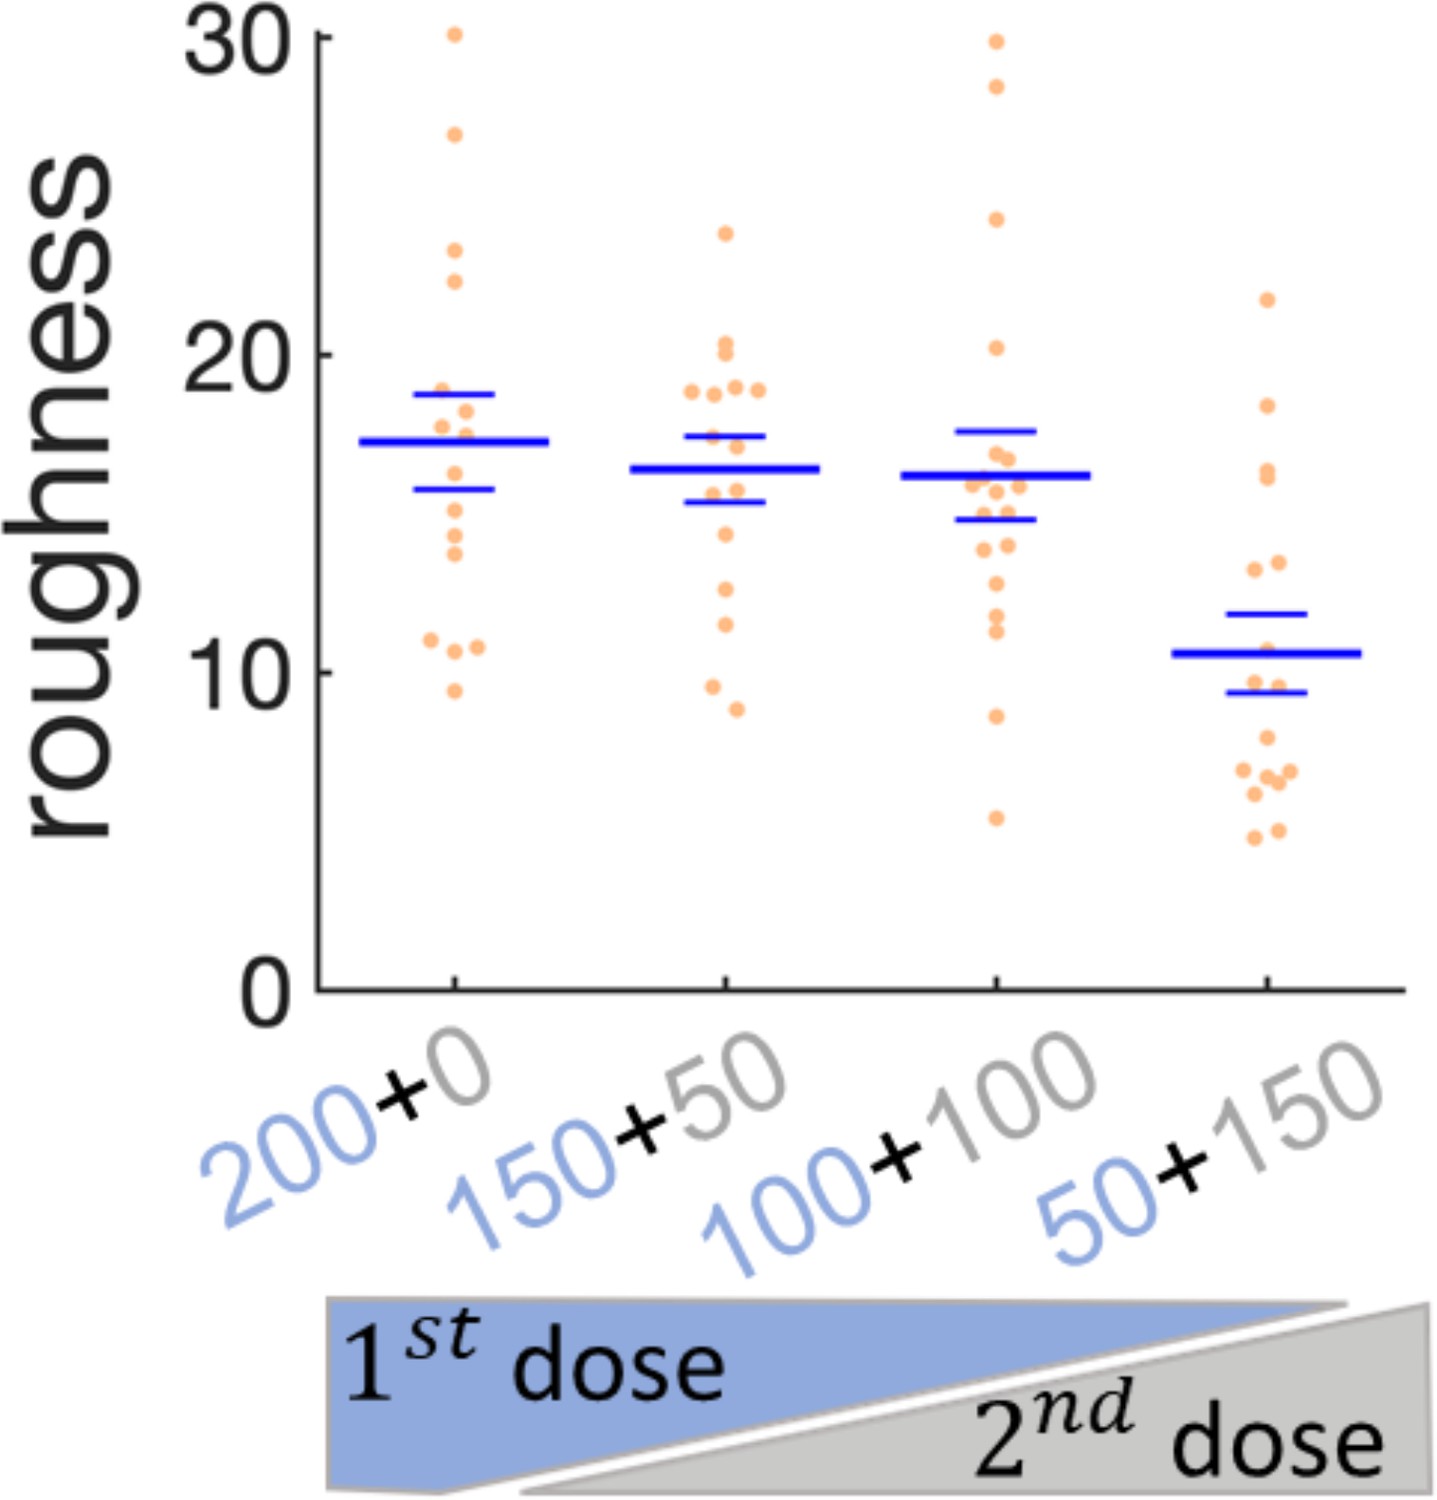
Effect of sequential administration of kanamycin in wrinkles’ roughness.
Scatter plot for the roughness of the wrinkles when the kanamycin dose is split in two times. The first dose of kanamycin is in blue and the second dose in gray. The large bars are the mean of the roughness and the small bars are the s.e.m.
Author response image 1
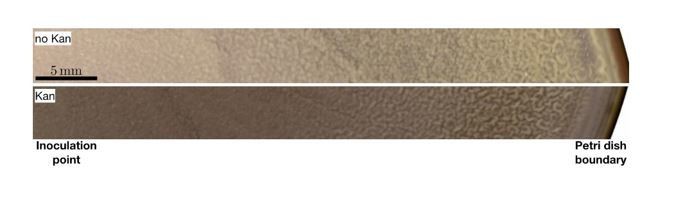
Radial transects of a 9 cm-diameter petri dish with a swarming B. subtilis culture in conditions corresponding to “no kanamycin” and “kanamycin”, as specified in the manuscript.
Videos
Video 1
Expansion of swarming bacteria in presence of a gradient of kanamycin.
Wild-type Bacillus subtilis was inoculated at the center of the plate. Eventually, bacteria at the swarming front halt due to the presence of the kanamycin-diffusive disk placed on a side of a 9-cm Petri Dish 24 hr prior to inoculation. After the front stops, the swarm is still dynamic since multiple waves of swarming bacteria come from the center of the plate.
Video 2
Swarming Bacillus subtilis Δeps deletion strain was inoculated at the center of the plate.
Eventually, bacteria at the swarming front halt due to the presence of the kanamycin diffusive disk placed on a side of a 9 cm Petri dish 24 hr before inoculation.
Video 3
Swarming bacteria during the jamming process visualized as darker cells in the field of view observed at ×60 magnification.
The speed plot shows the average speed in the field of view and the blue shade represents s.e.m. The vertical line in the graph indicates the frame of the time-lapse in which the average speed was calculated. It can be observed that the jam makes the overall speed to drop by half of the initial magnitude.
Video 4
Process of jams and islands formation under ×10 magnification.
The left panel shows swarming bacteria continuously jamming. The jams look like dark localized small regions in the field of view which continuously appear and disappear. The right panel shows the same scenario 10 min later, when the islands become more stable. Islands look like extended dark regions in the field of view which are highly dynamic and with highly fluctuating boundaries.
Video 5
Coexistence between a second layer of swarming bacteria (darker region in the field of view) and a surrounding monolayer of swarming cells under ×40 magnification.
The boundaries of the island continuously exchange cells with the monolayer surrounding it. Within the island, cell appear to meander across the layers.
Video 6
Formation of multilayers in a swarming plate with a kanamycin-diffusive disk.
The multilayer starts forming in the region near the disk where multiple islands appear. The islands become very elongated at the front and they grow in size until they merge. The nucleation and merging of islands were observed up to four layers before we lost the ability to recognize further transitions due to a flattening of the image contrast. In the opposite side of the plate, away from kanamycin, the islands appear and merge homogeneously in the whole region.
Video 7
Time-lapse of accumulation of bacteria over time when they are being continuously irradiated by UV light in a region that is as large as the field of view.
Eventually, bacteria accumulation gives rise to the formation of localized islands, which appear as dark regions in the field of view, finally leading to a confluent second layer.
Video 8
Process of island formation when the swarming front hits a physical barrier which is placed just on the right of the field of view.
Islands start forming in the region closer to the barrier and then propagate towards the opposite direction. After the initial island formation, we can see that the swarm is still dynamic and keep forming multiple layers through island formation and merging.
Tables
Key resources table
| Reagent type (species) or resource | Designation | Source or reference | Identifiers | Additional information |
|---|---|---|---|---|
| Strain, strain background (Bacillus subtilis) | NCIB3610 | PMID:20374491 | Gift from Süel lab | |
| Genetic reagent (Bacillus subtilis) | epsH:: tetR | PMID:11572999 | Gift from Kolter lab | |
| Genetic reagent (Bacillus subtilis) | phrC::neoR | PMID:23012477 | Gift from Süel lab | |
| Genetic reagent (Bacillus subtilis) | oppD::cmR | PMID:23012477 | Gift from Süel lab | |
| Genetic reagent (Bacillus subtilis) | PtapA-yfp, sacA::PyqxM-trsA216-yfp, cmR | PMID:26196509 | Gift from Süel lab | |
| Other | Mounted LED | Thorlabs | M405L4 | 405 nm, 1000 mW |
| Other | Aspheric Condenser Lenses | Thorlabs | ACL25416U-B | Ø1’, f = 16.0 mm |
| Other | 25 mm SPUTTERED EDGEPASS FILTER | Thorlabs | FELH0450 | Longpass 450 nm |
| Other | Retaining Ring | Thorlabs | CMRR | C-Mount (1.00’−32) |
| Other | Cage cube | Thorlabs | Cm1-dch | Dichroic Filter Mount |
| Other | Adapter | Thorlabs | Sm1a9 | External C-Mount Threads and Internal SM1 Threads |
| Other | Leica DMI Microscope Camera Port Adapter | Thorlabs | Sm1a50 | Internal SM1 Threads, External SM2 Threads |
| Other | Coupler, External Threads | Thorlabs | Sm1t2 | 0.5’ Long |
| Other | Adapter | Thorlabs | Sm1a10 | External SM1 Threads and Internal C-Mount Threads |
Additional files
Download links
A two-part list of links to download the article, or parts of the article, in various formats.
Downloads (link to download the article as PDF)
Open citations (links to open the citations from this article in various online reference manager services)
Cite this article (links to download the citations from this article in formats compatible with various reference manager tools)
Swarming bacteria undergo localized dynamic phase transition to form stress-induced biofilms
eLife 10:e62632.
https://doi.org/10.7554/eLife.62632


