Altered transcriptomic immune responses of maintenance hemodialysis patients to the COVID-19 mRNA vaccine
- Department of Medicine, University of Illinois at Chicago, United States
- Department of Bioengineering, University of Illinois at Chicago, United States
- Department of Microbiology and Immunology, University of Illinois at Chicago, United States
- Department of Medicine, Stanford University, United States
- Department of Medicine, University of Colorado Denver, United States
- Department of Biological Sciences, University of Illinois at Chicago, United States
Figures
Figure 1 with 3 supplements
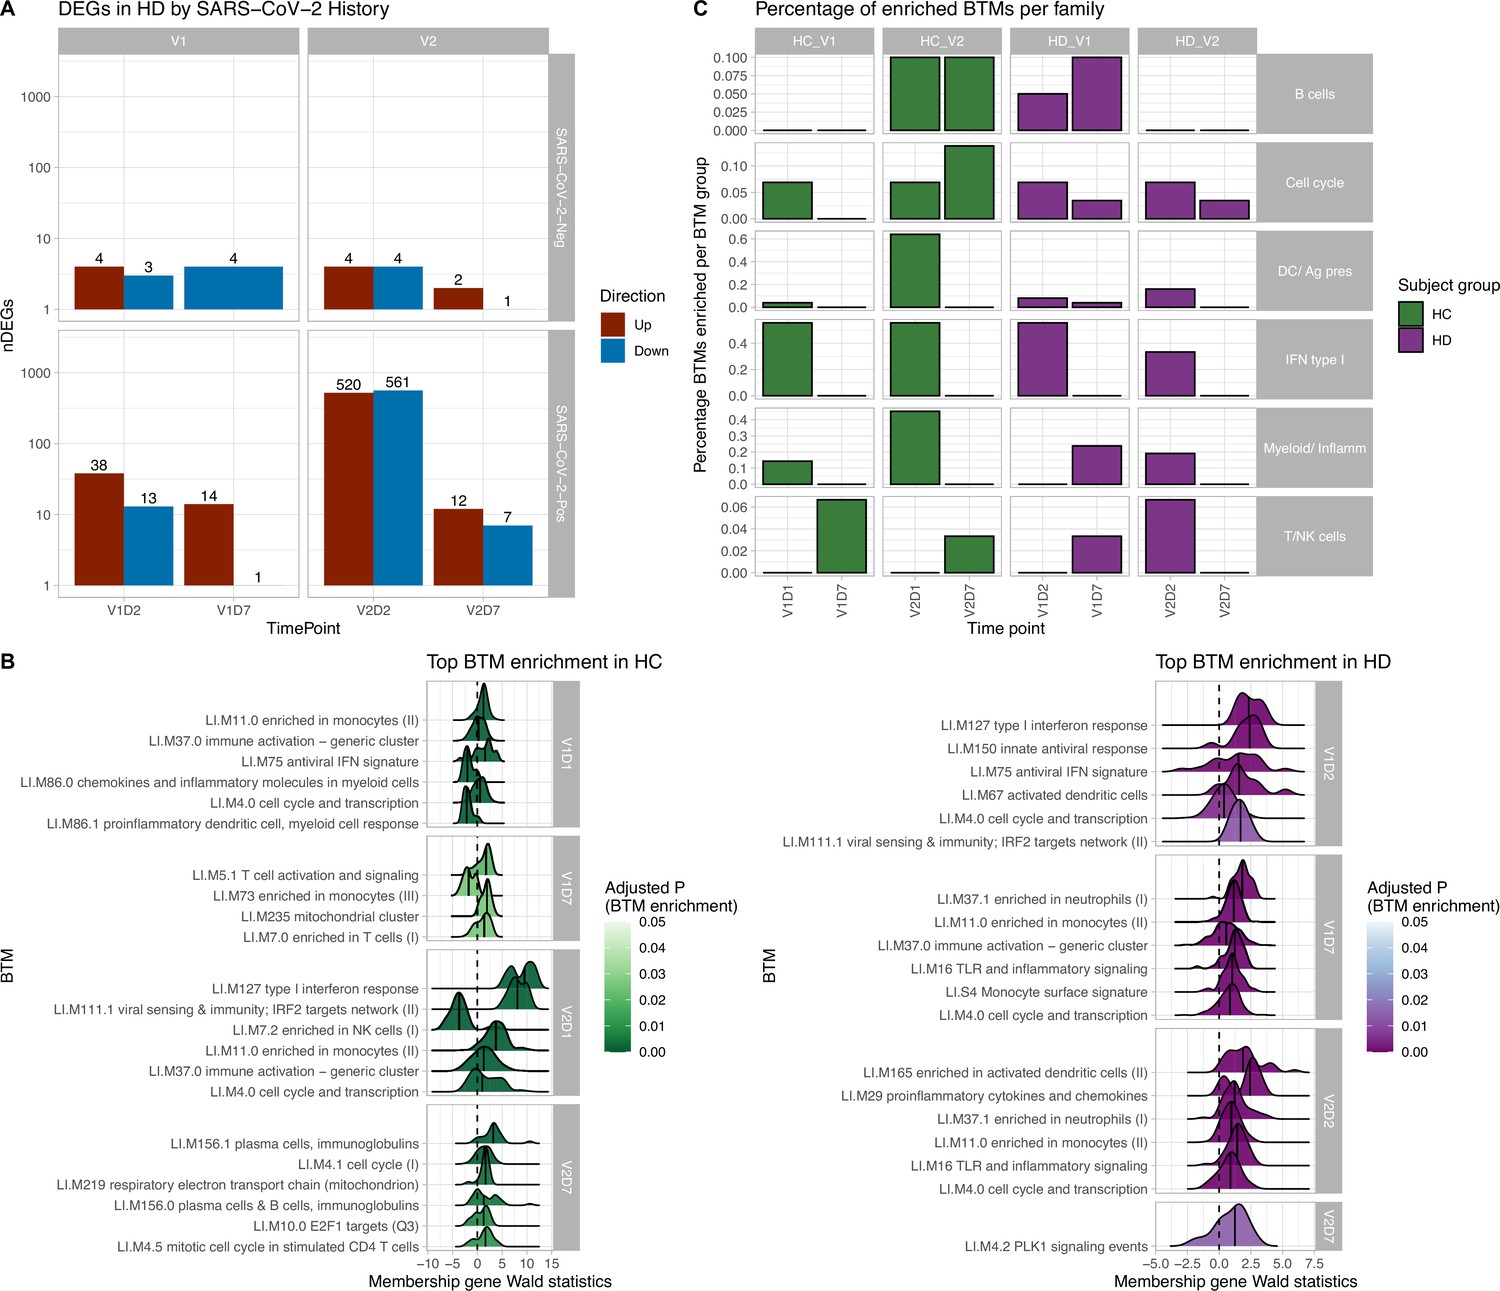
Results of differential gene expression and blood transcription module (BTM) analysis.
(A) Differentially expressed genes (DEGs) increased after second vaccination dose compared to first, and at early time points compared to day 7 (D7). DEGs are shown for maintenance hemodialysis (HD) with (n = 6) and without (n = 6) prior SARS-CoV-2 history. See Figure 1—figure supplement 1 for healthy control (HC) and HD data independent of SARS-CoV-2 history. The DESeq2 R package was used to identify genes that were differentially expressed at each time point after vaccination for each subject group (p<0.05, FDR-adjusted). (B) HC and HD with no SARS-CoV-2 history demonstrate distinct longitudinal enrichments of BTMs. Left: in HC, the most significantly enriched BTMs are shown (up to six) for day 1 (D1) and day 7 (D7) after each vaccination dose (V1, V2) (p<0.05, FDR-adjusted). Density plots for each BTM represent Wald statistics from DESeq2 analysis for each membership gene, thereby representing increased or decreased expression per gene at each time point compared to baseline (V1D0 or V2D0). Right: similarly in HD, the most significantly enriched BTMs for day 2 (D2) and day 7 (D7) are shown. (C) HD demonstrates diminished transitioning from innate to adaptive immune BTM enrichment after each vaccination dose. Percentages of BTMs in each BTM family with significant enrichment are shown at each time point after each vaccination dose (V1, V2) for day 1 (D1) and day 7 (D7) in HC, and day 2 (D2) and D7 for HD in subjects with no prior infection with SARS-CoV-2 (p<0.05, FDR-adjusted). Direction of enrichment was determined using the median Wald statistic from DESeq2 analysis for each BTM membership gene, thereby representing overall increased or decreased expression of membership genes at each time point compared to baseline (V1D0 or V2D0).
Figure 1—figure supplement 1
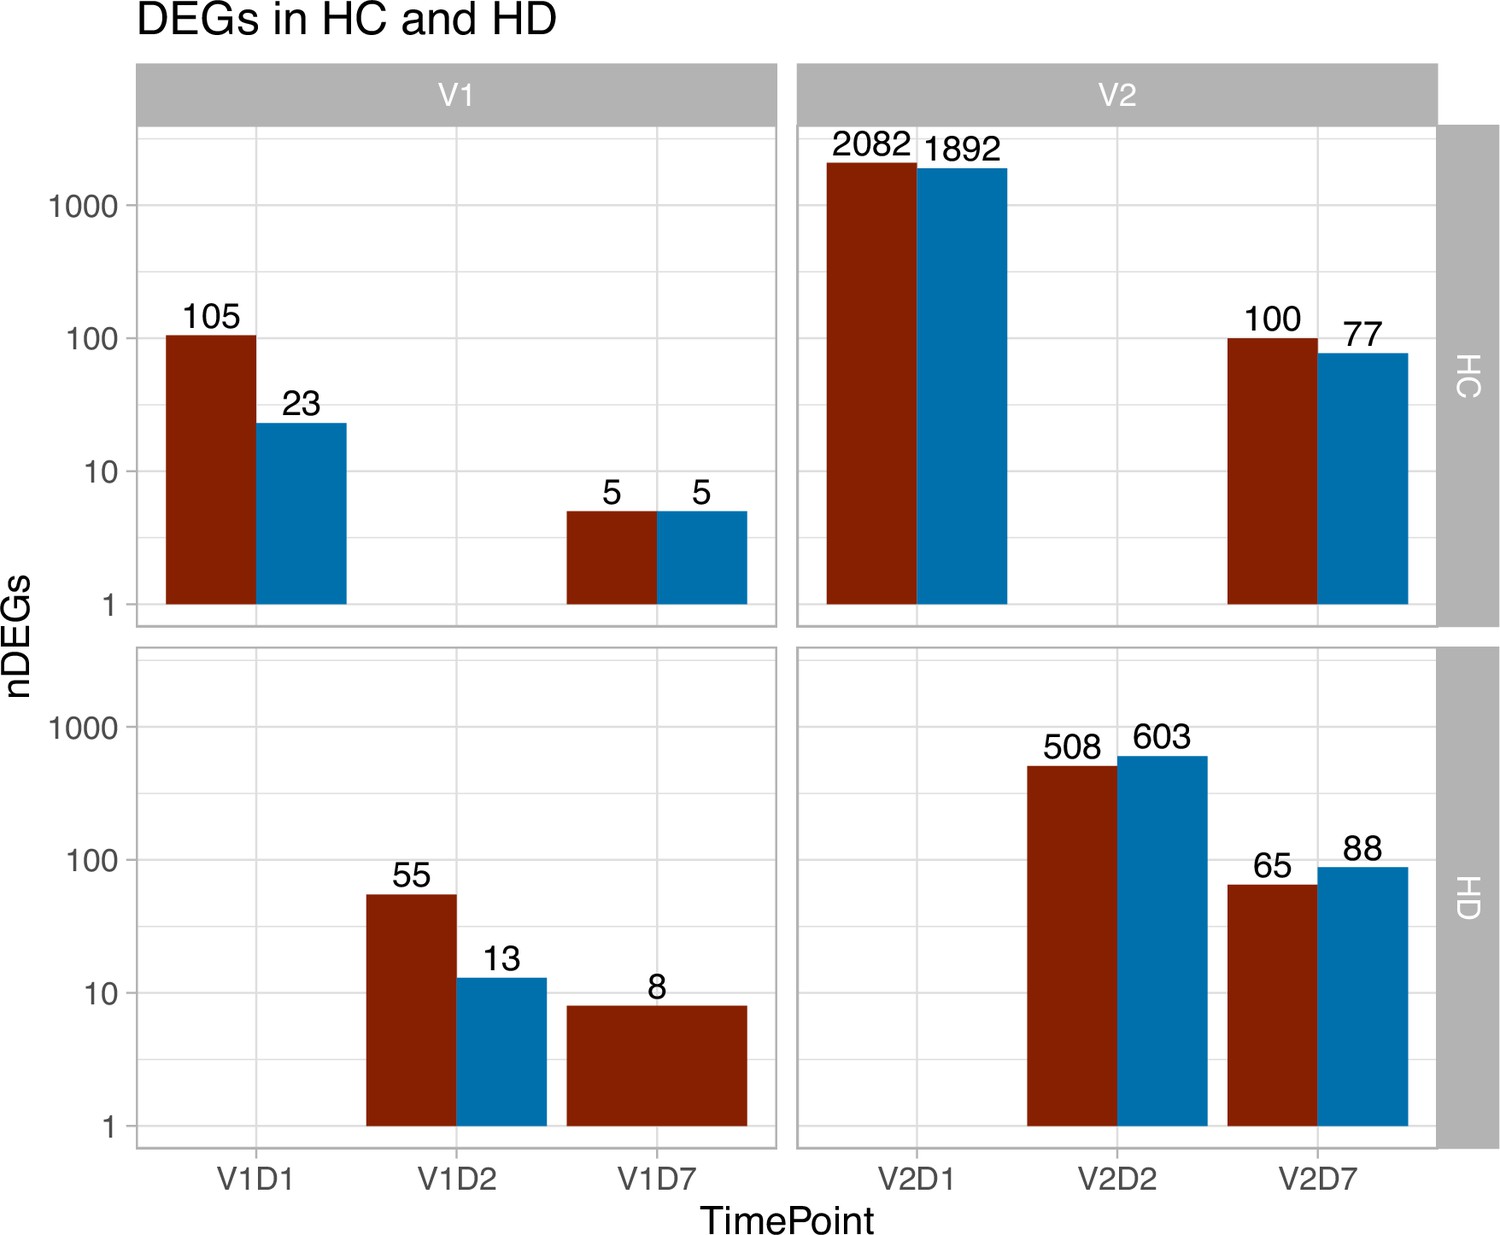
Differentially expressed genes (DEGs) increased after second vaccination dose compared to first, and at day 1 (D1, for healthy controls [HC]) and day 2 (D2, for maintenance hemodialysis [HD] compared to day 7 [D7]).
DEGs are shown for HC and HD regardless of SARS-CoV-2 history. Red color indicates upregulated DEGs and blue color indicates downregulated DEGs. The DESeq2 R package was used to identify genes that were differentially expressed at each time point after vaccination for each subject group (p<0.05, FDR-adjusted).
Figure 1—figure supplement 2

Hemodialysis (HD) patients without prior SARS-CoV-2 infection show increased myeloid activity at V1D7 and decreased metabolic activity at V2D7 compared to controls (HC).
The most differentially enriched blood transcription modules (BTMs) between HC and HD with no prior infection with SARS-CoV-2 are shown (p<0.05, FDR-adjusted) at V1D7 and at 1 wk after second vaccination dose (V2D7). Density plots for each BTM represent Wald statistics from DESeq2 analysis for each membership gene per BTM, with positive Wald statistics indicating increased expression in HC compared to HD.
Figure 1—figure supplement 3

Hemodialysis (HD) patients with prior SARS-CoV-2 infection show increased expression of innate and adaptive immune blood transcription modules (BTMs) post-vaccination.
The most significantly enriched BTMs are shown (up to six) for day 2 (D2) and day 7 (D7) after each vaccination dose (V1, V2) in HD with prior infection with SARS-CoV-2 (p<0.05, FDR-adjusted). Density plots for each BTM represent Wald statistics from DESeq2 analysis for each membership gene, thereby representing increased or decreased expression per gene at each time point compared to baseline (V1D0 or V2D0).
Figure 2
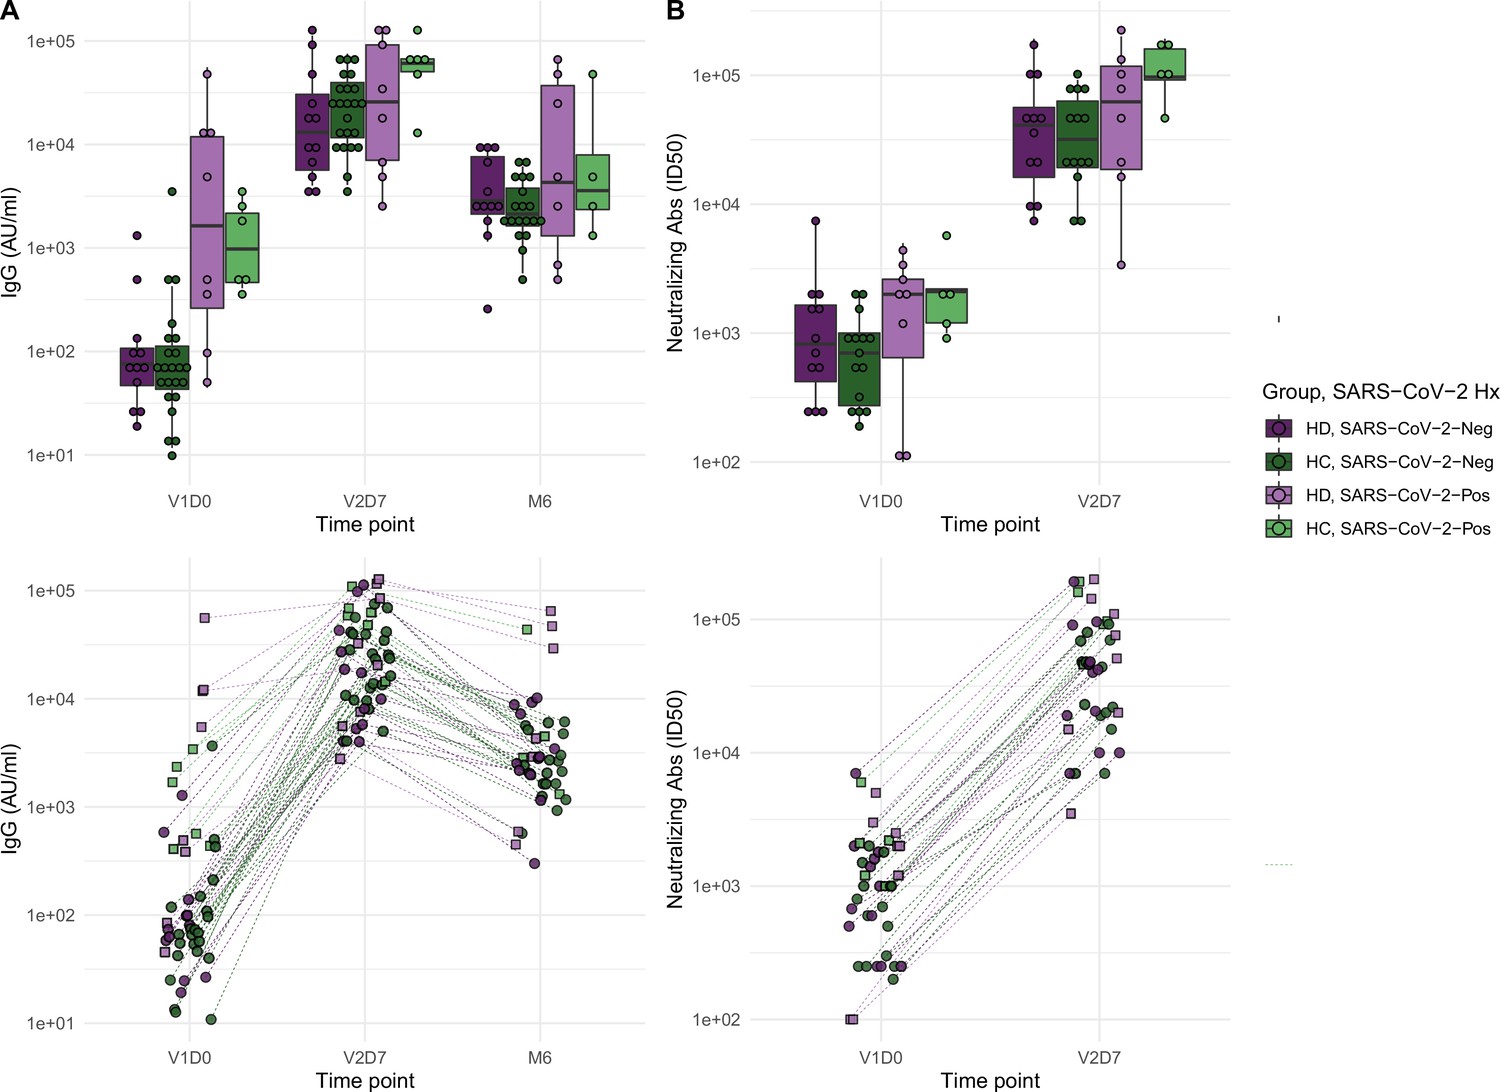
Antibodies significantly increasedin both healthy control (HC) and maintenance hemodialysis (HD) groups 1 wk after the second vaccination dose (p<0.001) and 6 mo after initial vaccination (p<0.001) with the BNT162b2 mRNA COVID-19 vaccine.
(A) Anti-spike IgG levels in HC and HD subjects with and without prior SARS-CoV-2 history before vaccination (V1D0), 1 wk after second vaccination dose (V2D7), and 6 mo after initial vaccination (M6). Higher anti-spike IgG at V2D7 was significantly predicted by higher pre-vaccination anti-spike IgG, being a member of HC, and younger age (p<0.01, p<0.05, p<0.05, respectively). Higher anti-spike IgG at M6 was significantly predicted by higher V2D7 anti-spike IgG (p<0.001). (B) Antibody neutralization activity (ID50) in controls and HD subjects with and without prior SARS-CoV-2 history at V1D0 and V2D7. Higher neutralization activity (ID50) at V2D7 was significantly predicted by higher pre-vaccination ID50, with no additional predictive value conferred by subject group.
Figure 3
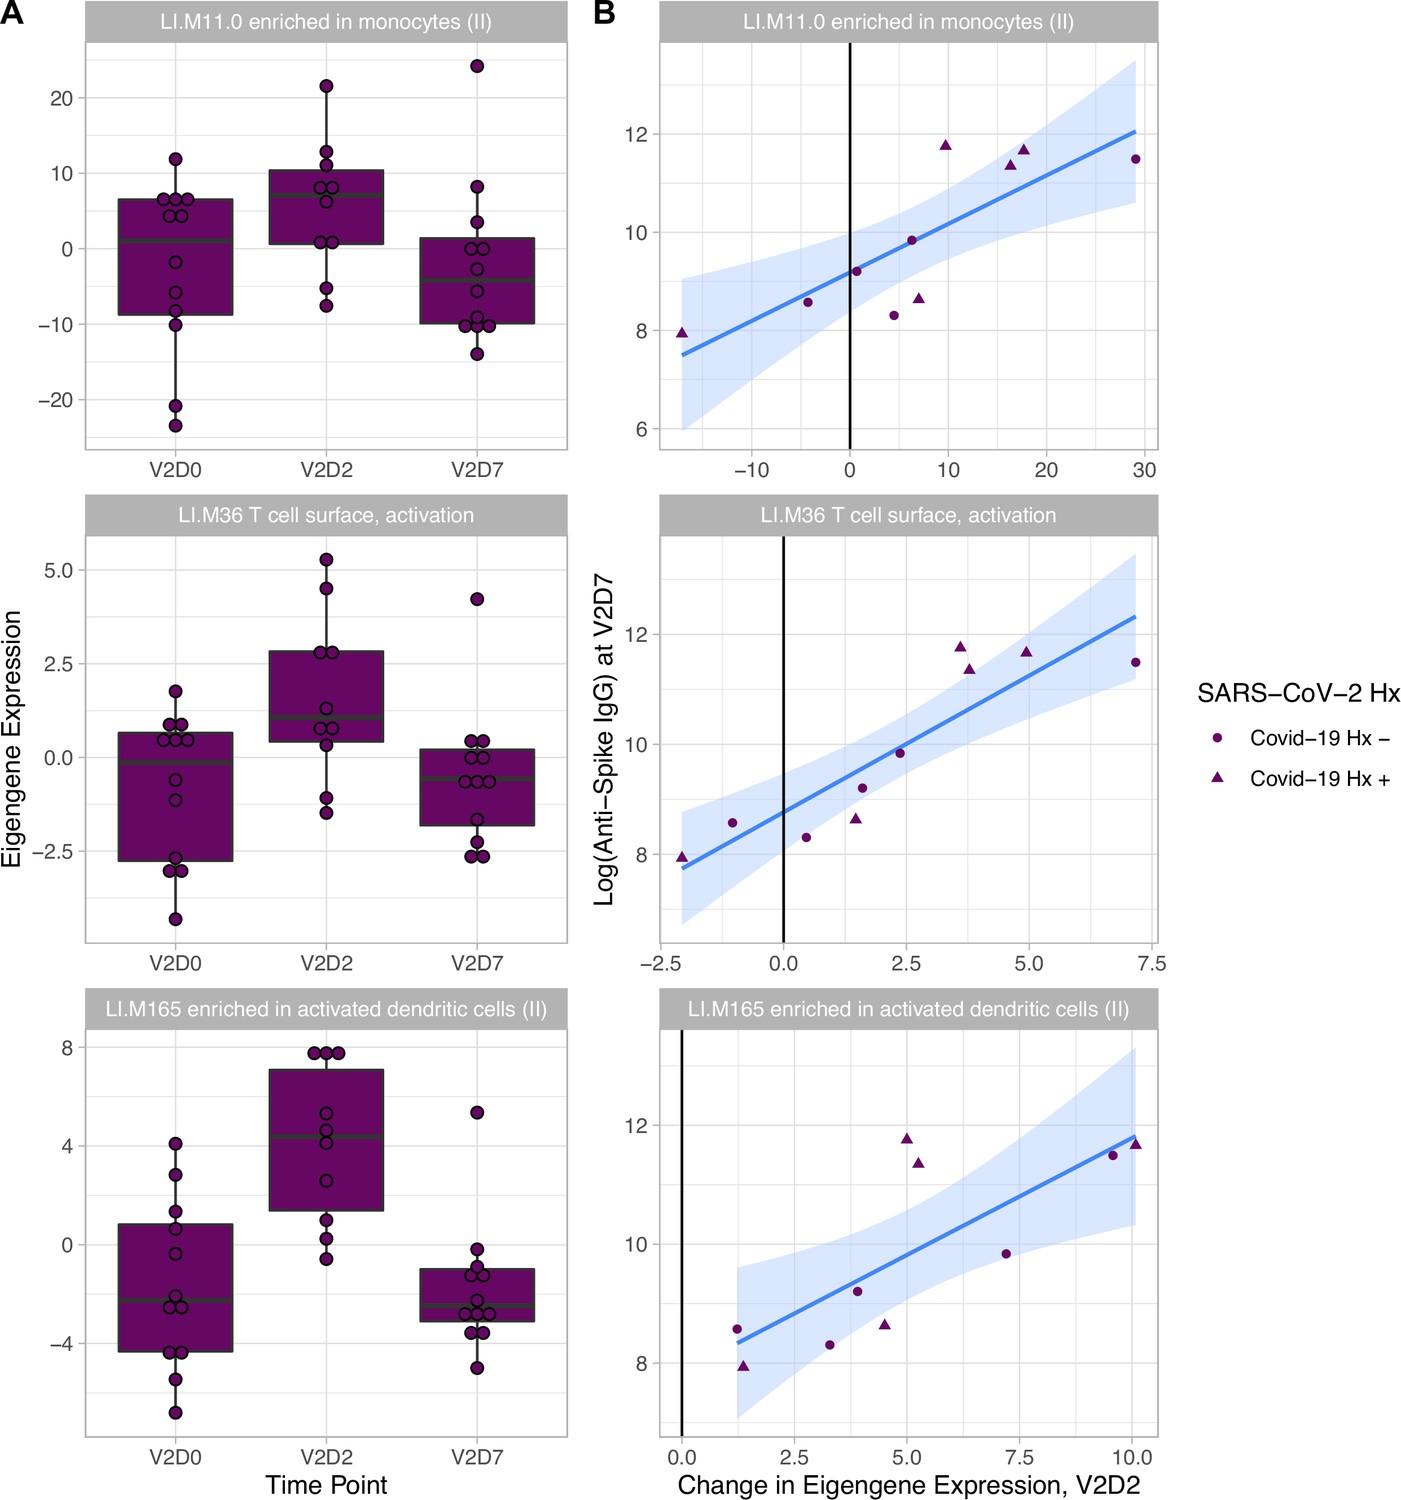
Increased expression of multiple blood transcription modules (BTMs) at V2D2 is predictive of higher anti-spike IgG at V2D7.
Of 30 enriched BTMs at V2D2, increased expression of 18 BTMs is predictive of increased anti-spike IgG at V2D7 (p<0.05, FDR-corrected), controlling for SARS-CoV-2 history. Predictive pathways include innate immune, antigen presentation, and T cell pathways. The eigengenes (A) and linear models (B) for three example BTMs are shown.
Figure 4
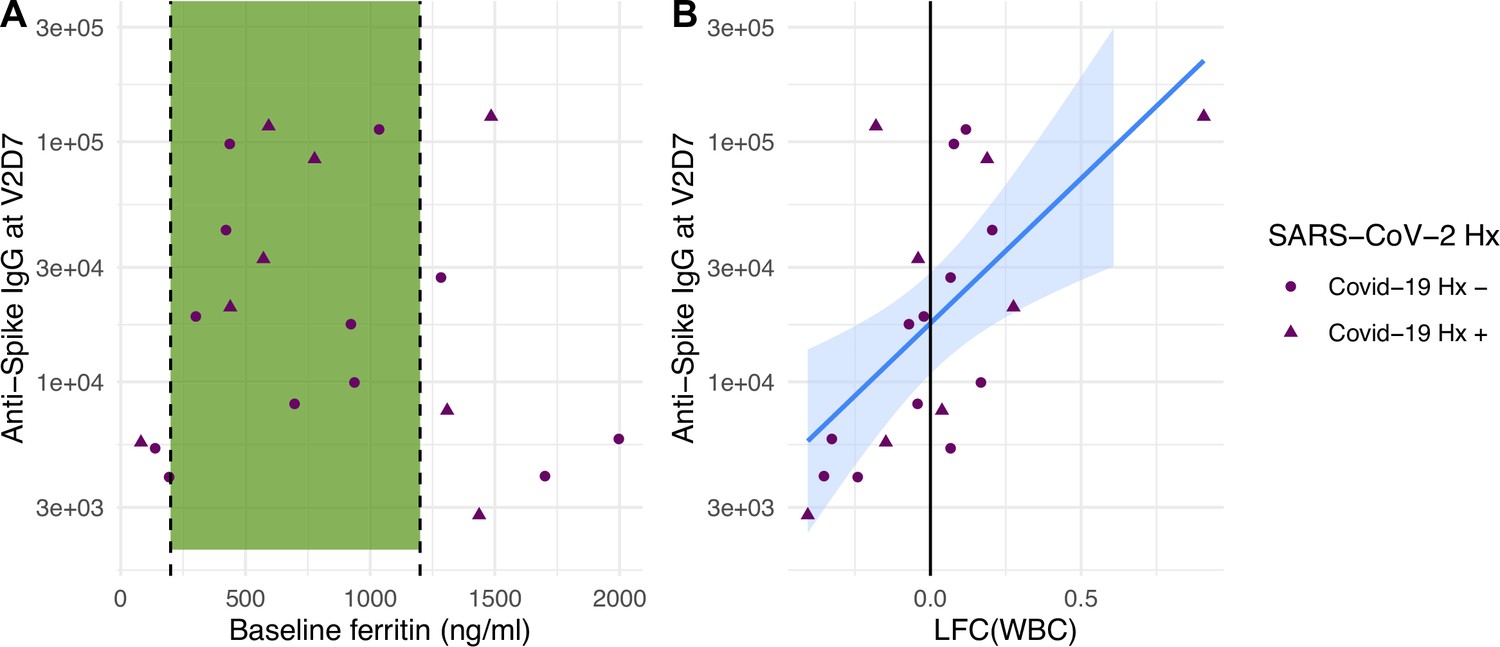
Baseline ferritin level and post-V1 white blood cell count (WBC) are clinical predictors of post-V2 antibody responses in maintenance hemodialysis (HD) patients.
(A) Ferritin levels associated with lowest all-cause mortality predict the development of higher anti-spike IgG after vaccination at V2D7 (p<0.01) and M6 (not shown, p<0.05) in maintenance HD patients. Dashed vertical lines indicate the intermediate range of ferritin (200–1200 ng/ml) associated with lowest all-cause mortality (Kalantar-Zadeh et al., 2005). (B) Increased WBC after first vaccination dose is predictive of anti-spike IgG titers after vaccination at V2D7 (p<0.01) and M6 (not shown, p<0.05) in maintenance HD patients. Points with negative log-fold change of white blood cell counts (LFC(WBC)) and positive LFC(WBC) represent a decrease and increase, respectively, in WBC from baseline labs.
Tables
Table 1
Demographic and clinical data for maintenance hemodialysis and control subjects.
| Hemodialysis | Control | p-value | |
|---|---|---|---|
| Total # of subjects | 20 | 20 | |
| Gender | |||
| Male | 11 | 10 | 1.0 |
| Female | 9 | 10 | 1.0 |
| Age (mean (sd)) | 54 (12) | 54 (13) | 0.98 |
| Race/ethnicity | |||
| Black/African American | 10 | 3 | 0.041 |
| Asian/Pacific Islander | 1 | 2 | 1.0 |
| White/Caucasian | 2 | 8 | 0.067 |
| Hispanic/Latinx | 7 | 6 | 1.0 |
| Other | 0 | 1 | 1.0 |
| BMI, kg/m2 (mean (sd)) | 27.8 (5.1) | 28.7 (6.4) | 0.61 |
| Medical history | |||
| Diabetes | 11 | 1 | 0.0012 |
| Hypertension | 18 | 4 | <0.001 |
| Other CV disease* | 9 | 0 | 0.0012 |
| Dyslipidemia | 10 | 0 | <0.001 |
| Autoimmune disease† | 3 | 0 | 0.23 |
| Immunosuppression‡ | 1 | 0 | 1.0 |
| Active malignancy§ | 1 | 0 | 1.0 |
| Positive COVID-19 history | 8 | 5 | 0.5 |
-
*
Includes coronary artery disease (CAD), congestive heart failure (CHF), atrial fibrillation (AF), peripheral vascular disease (PVD), and cerebral vascular accent (CVA).
-
†
Includes systemic lupus erythematosus (SLE), immune thrombocytopenic purpura (ITP), and microscopic polyangiitis (MPA).
-
‡
Hydroxychloroquine.
-
§
Defined as malignancy requiring treatment in the last 6 mo; one patient with papillary thyroid cancer requiring thyroidectomy, no systemic treatment required.
Table 2
Baseline clinical lab values for maintenance hemodialysis (HD) patients.
| Normal range | Mean (SD) | |
|---|---|---|
| Kidney/HD status | ||
| Urea reduction ratio | - | 0.74 (0.052) |
| Months on HD | - | 46 (44) |
| Iron | ||
| Ferritin (ng/ml) | 10–259 | 838 (550) * |
| % Transferrin saturation | 25–50 | 38 (13) |
| Albumin | 3.4–5 | 4.1 (0.40) |
| CBC | ||
| White blood cells (k/ul) | 3.9–12 | 6.0 (2.1) |
| Hgb (g/dl) | 13.2–18 | 10.5 (1.5) * |
| Lymphocytes (k/ul) | 1.3–4.2 | 1.5 (0.7) |
| Neutrophils (k/ul) | 1.3–7.5 | 3.7 (1.5) |
| Monocytes (k/ul) | 0.4–1 | 0.5 (0.2) |
| Eosinophils (k/ul) | 0.2–0.5 | 0.2 (0.2) |
-
*
Indicates value outside of normal range.
Additional files
-
Supplementary file 1
Significantly enriched blood transcription modules at day 1 in healthy controls (HC) following the first vaccination dose (V1D1).
- https://cdn.elifesciences.org/articles/83641/elife-83641-supp1-v1.csv
-
Supplementary file 2
Significantly enriched blood transcription modules at day 7 in healthy controls (HC) following the first vaccination dose (V1D7).
- https://cdn.elifesciences.org/articles/83641/elife-83641-supp2-v1.csv
-
Supplementary file 3
Significantly enriched blood transcription modules at day 1 in healthy controls (HC) following the second vaccination dose (V2D1).
- https://cdn.elifesciences.org/articles/83641/elife-83641-supp3-v1.csv
-
Supplementary file 4
Significantly enriched blood transcription modules at day 7 in healthy controls (HC) following the second vaccination dose (V2D7).
- https://cdn.elifesciences.org/articles/83641/elife-83641-supp4-v1.csv
-
Supplementary file 5
Significantly enriched blood transcription modules at day 2 in hemodialysis subjects (HD) following the first vaccination dose (V1D2).
- https://cdn.elifesciences.org/articles/83641/elife-83641-supp5-v1.csv
-
Supplementary file 6
Significantly enriched blood transcription modules at day 7 in hemodialysis subjects (HD) following the first vaccination dose (V1D7).
- https://cdn.elifesciences.org/articles/83641/elife-83641-supp6-v1.csv
-
Supplementary file 7
Significantly enriched blood transcription modules at day 2 in hemodialysis subjects (HD) following the second vaccination dose (V2D2).
- https://cdn.elifesciences.org/articles/83641/elife-83641-supp7-v1.csv
-
MDAR checklist
- https://cdn.elifesciences.org/articles/83641/elife-83641-mdarchecklist1-v1.docx
Download links
A two-part list of links to download the article, or parts of the article, in various formats.
Downloads (link to download the article as PDF)
Open citations (links to open the citations from this article in various online reference manager services)
Cite this article (links to download the citations from this article in formats compatible with various reference manager tools)
Altered transcriptomic immune responses of maintenance hemodialysis patients to the COVID-19 mRNA vaccine
eLife 13:e83641.
https://doi.org/10.7554/eLife.83641


