Intra- and interspecific diversity in a tropical plant clade alter herbivory and ecosystem resilience
- Program in Ecology, Evolution, and Conservation Biology, Department of Biology, University of Nevada, United States
- Department of Scientific Services, Gorongosa National Park, Mozambique
- Hitchcock Center for Chemical Ecology, University of Nevada, United States
- Lab. de Biodiversidade, Departamento de Biodiversidade, Evolução e Meio Ambiente, Instituto de Ciências Exatas e Biológicas, Universidade Federal de Ouro Preto, Brazil
- Departamento de Entomología, Museo de Historia Natural, Universidad Nacional Mayor de San Marcos, Peru
- Department of Fundamental Chemistry, Institute of Chemistry, University of São Paulo, Brazil
- Department of Ecology, Universidade Federal de Goiás, Brazil
- Department of Biology, University of Nevada, United States
- Yanayacu Biological Station, Ecuador
- Department of Biological Sciences, Wright State University, United States
- Department of Biological Sciences, University of Cincinnati, United States
- Department of Biology, Mesa State College, United States
Figures
Figure 1 with 3 supplements
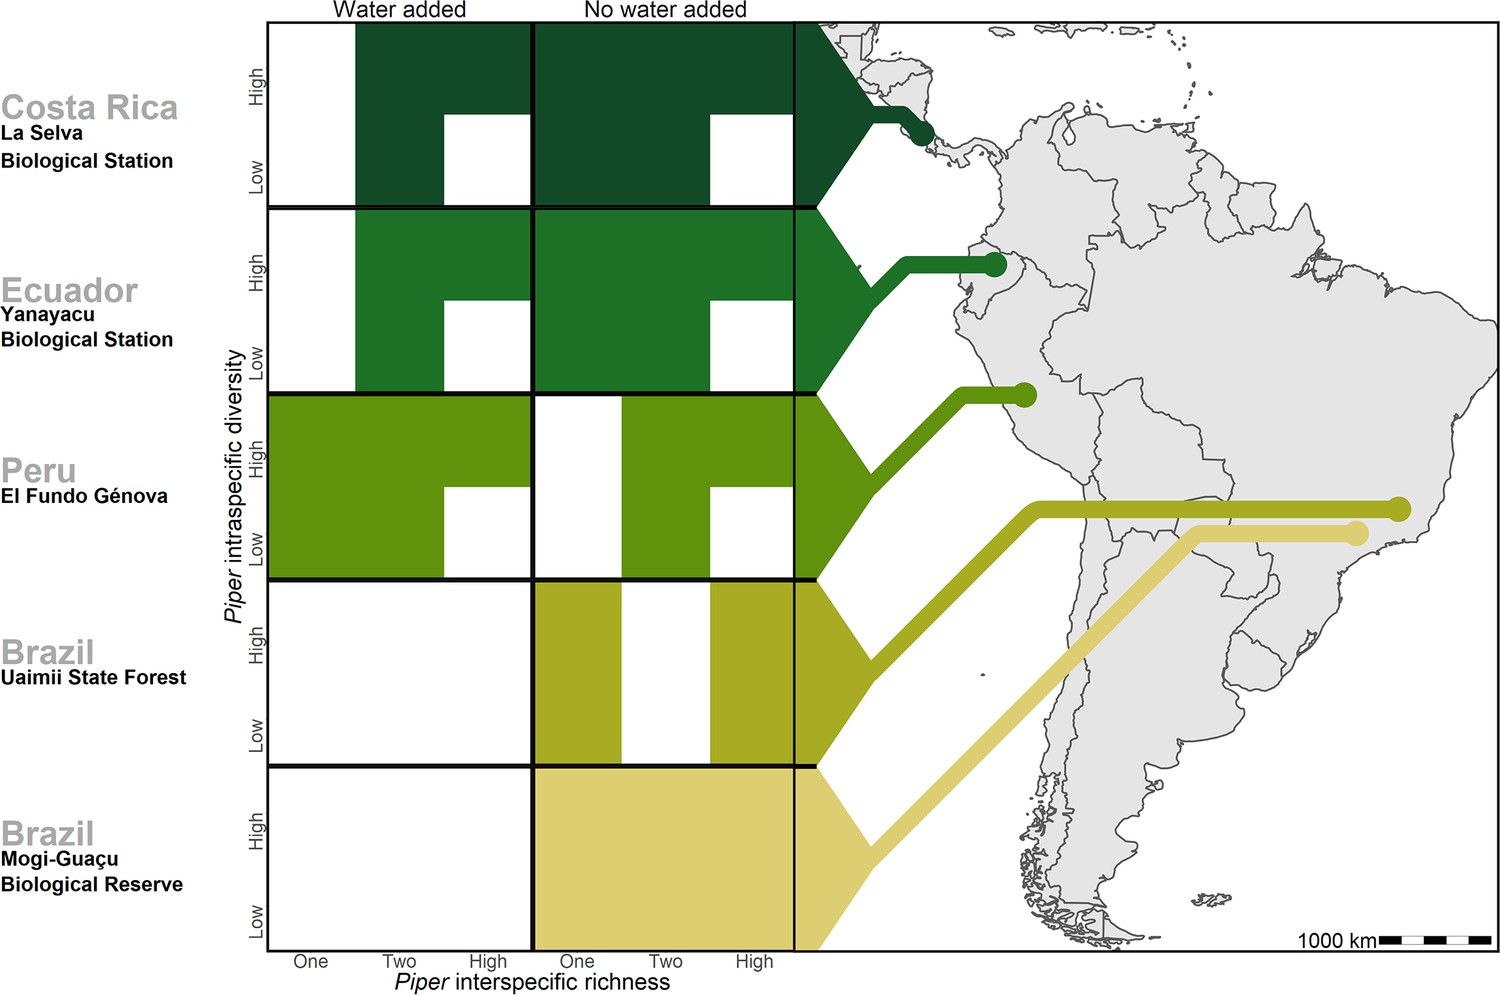
Treatments of intraspecific richness, interspecific richness, and water addition used in each of the five study sites.
White tiles represent treatment combinations which were not tested in a given site.
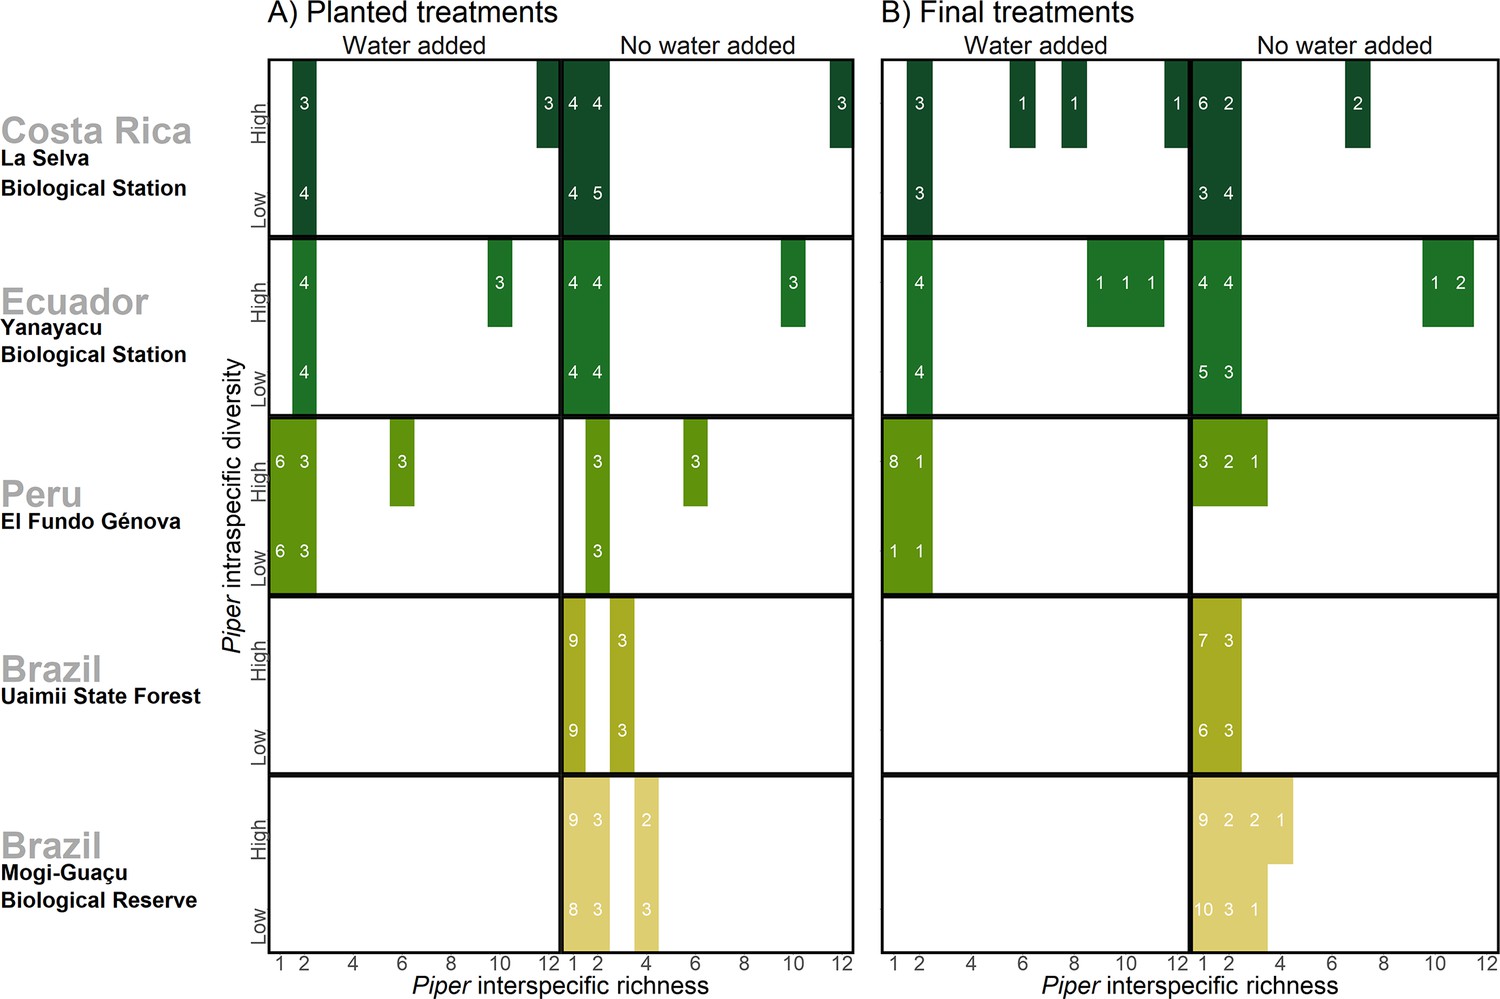
Figure 1—figure supplement 1
Treatments and number of plots used across sites.
(A) Treatments of intraspecific richness, interspecific richness, and water addition at the beginning of the experimental period at each of the five study sites, and (B) final treatments at the end of the experimental period in each site. White numerals indicate number of plots used. Changes in Piper species richness and the loss of some treatment combinations were due to Piper mortality over the course of the experimental period.
Figure 1—figure supplement 2

Overall herbivory, plant mortality, and insect richness at five study sites.
(A) Percent herbivory, percentage of leaves with any damage, herbivorous insect richness, and percent mortality of Piper in Costa Rica (CR), Ecuador (EC), Peru (PE), Uaimii (UI), and Mogi-Guaçu (MG), across treatments. (B) Proportion of herbivorous insect taxa observed at each site measured by feeding damage patterns. Proportion of herbivory attributed to each taxon at five study sites. Colored regions represent the percentage of each leaf consumed by each taxon at each site. White tiles represent sites where no leaf damage by that insect taxon was observed.
Figure 1—figure supplement 3
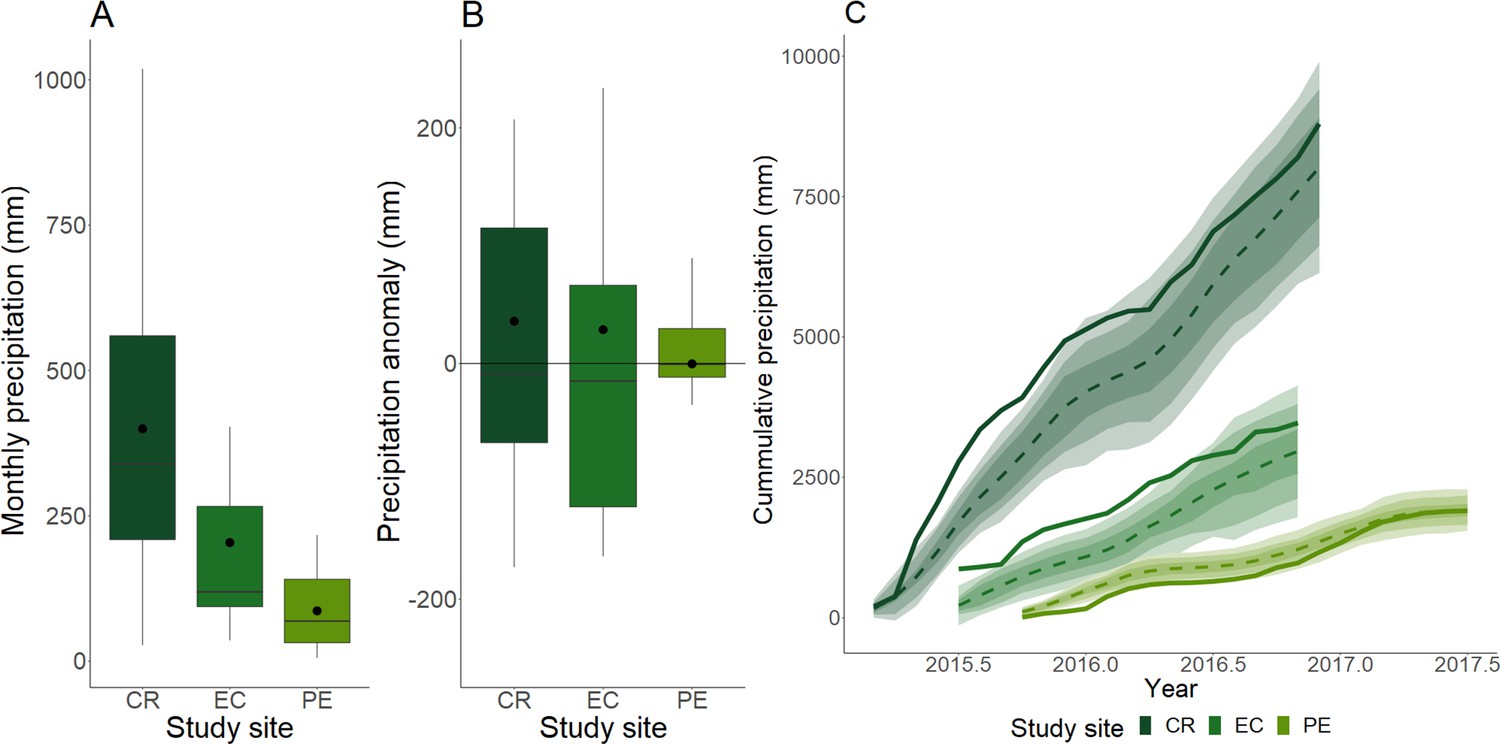
Precipitation levels at study sites where the water addition treatment was applied.
(A) Monthly precipitation over the experimental period at Costa Rica (CR), Ecuador (EC), and Peru (PE). (B) Difference in monthly precipitation from climate normals at the three sites across the experimental periods for those sites. Bars indicate median values, black points indicate mean values. (C) Cumulative precipitation over the course of the experimental period. Dotted lines indicate average cumulative precipitation, shaded regions indicate 95%, 80%, and 50% quantiles. Climate normals are based on monthly precipitation for a period from 1958 to 1998.
Figure 2 with 2 supplements
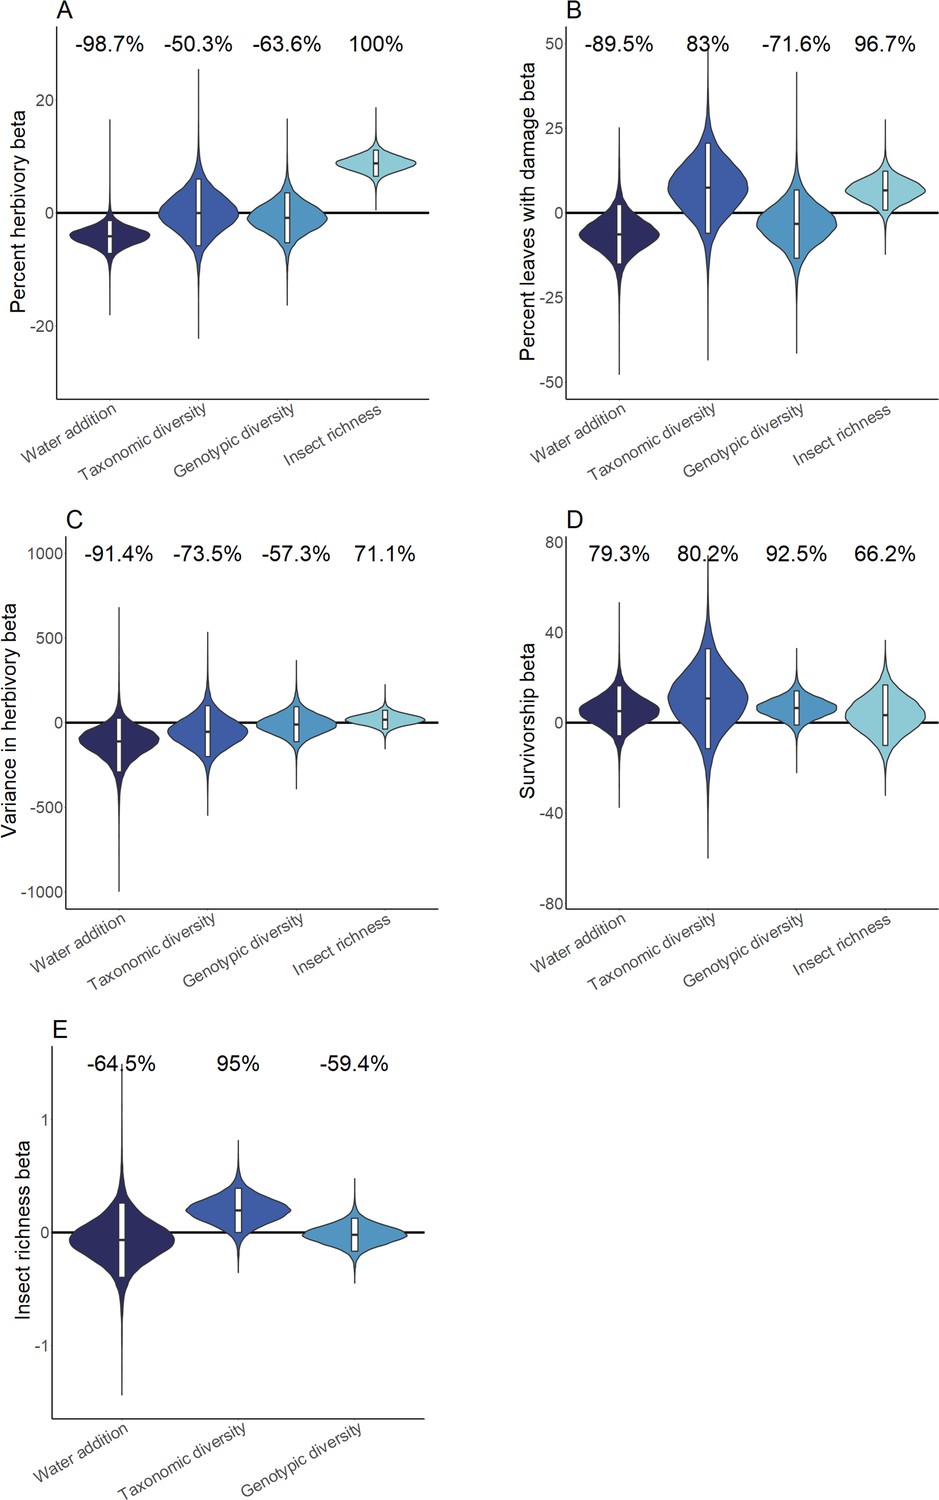
Hierarchical Bayesian model parameter estimates for the effects of water availability, as well as intraspecific and interspecific Piper richness on measures of herbivory (A-C), Piper survivorship (D), and herbivorous insect richness (E).
Violins represent the cross-site posterior parameter distribution for each relationship in site-level hierarchical Bayesian models. Black lines represent the median posterior estimate and white bars represent 95% credible intervals. Percentages above violins indicate the probability of an effect being positive or negative (as indicated by a negative probability) in response to an increase of the independent variable. Distributions for water addition compare watered and control plots; distributions for interspecific richness compare Piper species richness standardized as the proportion of the maximum richness used at a site; distributions for intraspecific richness compare low and high intraspecific richness treatments; distributions for insect richness compare responses per insect taxon present on an individual leaf.
Figure 2—figure supplement 1
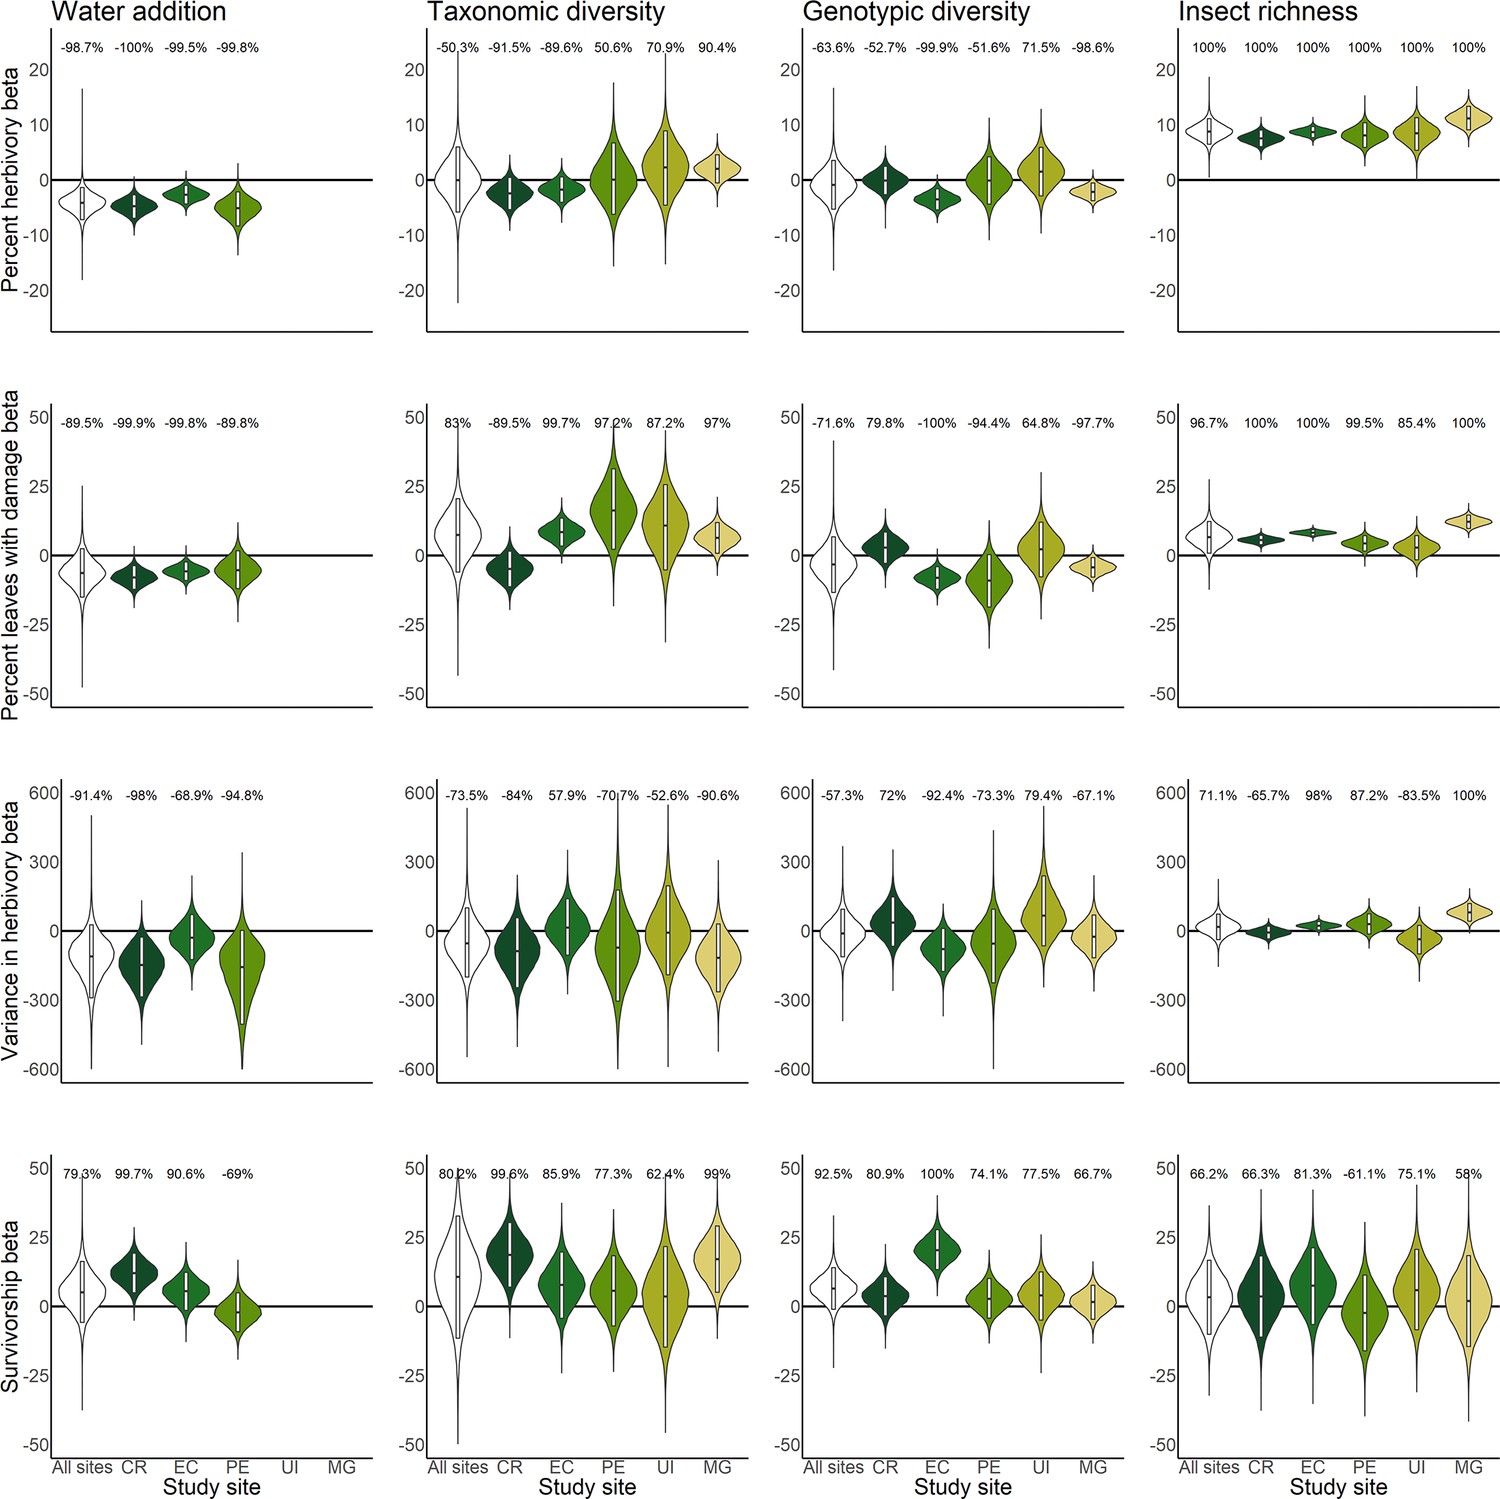
Hierarchical Bayesian model (HBM) parameter estimates of percent herbivory, percentage of leaves with damage, variance in herbivory, and percent Piper survival against levels of water addition, Piper intraspecific richness, Piper interspecific richness, and insect richness at each site.
Violins represent the posterior parameter distribution for each relationship across sites and within sites in Costa Rica (CR), Ecuador (EC), Peru (PE), Uaimii (UI), and Mogi-Guaçu (MG). Black lines represent the median posterior estimate while white bars represent 95% credibility intervals. Percentages above violins indicate the probability of an effect being entirely positive or entirely negative in response to an increase of the manipulated variable. Distributions for water addition compare unwatered control and watered plots; distributions for interspecific richness compare Piper species richness and are standardized as a percentage of the high richness treatment level; distributions for intraspecific richness compare low and high intraspecific richness plots; distributions for insect richness compare responses per insect taxon present at the leaf level.
Figure 2—figure supplement 2
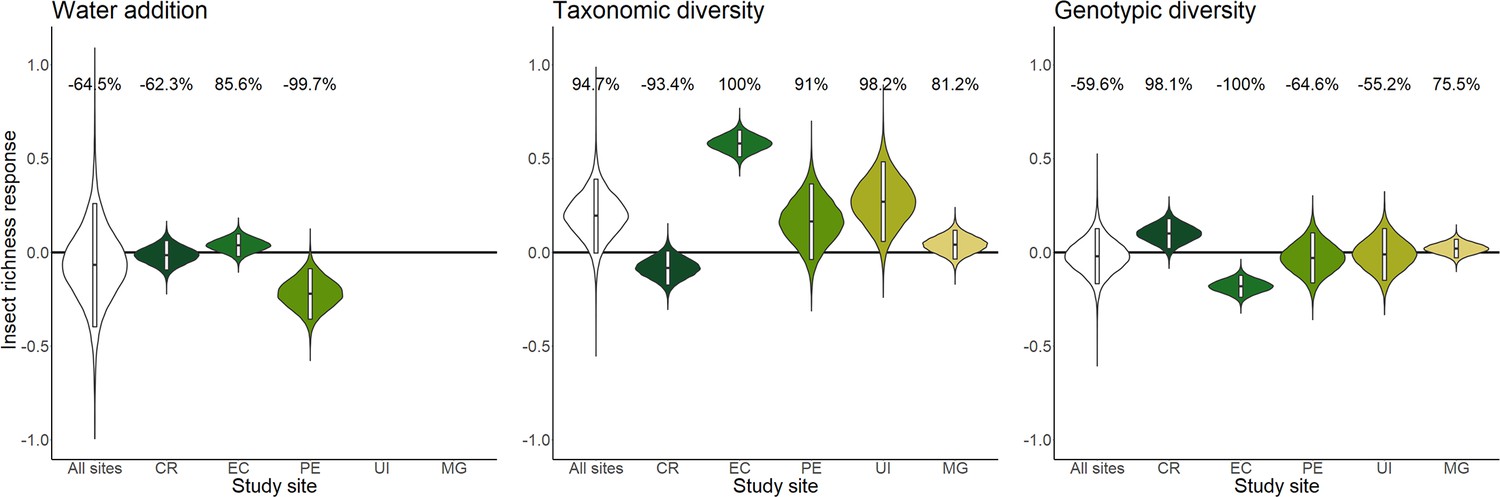
Hierarchical Bayesian model (HBM) posterior parameter estimates of insect richness compared to levels of water addition, Piper intraspecific richness, and Piper interspecific richness.
Violins represent the posterior parameter distribution for each relationship across sites and within sites at Costa Rica (CR), Ecuador (EC), Peru (PE), Uaimii (UI), and Mogi-Guaçu (MG). Black lines represent the median posterior estimate while white bars represent 95% credibility intervals. Percentages above violins indicate the probability of an effect being entirely positive or entirely negative in response to an increase of the manipulated variable. Distributions for water addition compare the unwatered control and watered plots; distributions for interspecific richness compare Piper species richness and are standardized as a percentage of the high richness treatment level; distributions for intraspecific richness compare low and high intraspecific richness plots.
Figure 3 with 2 supplements
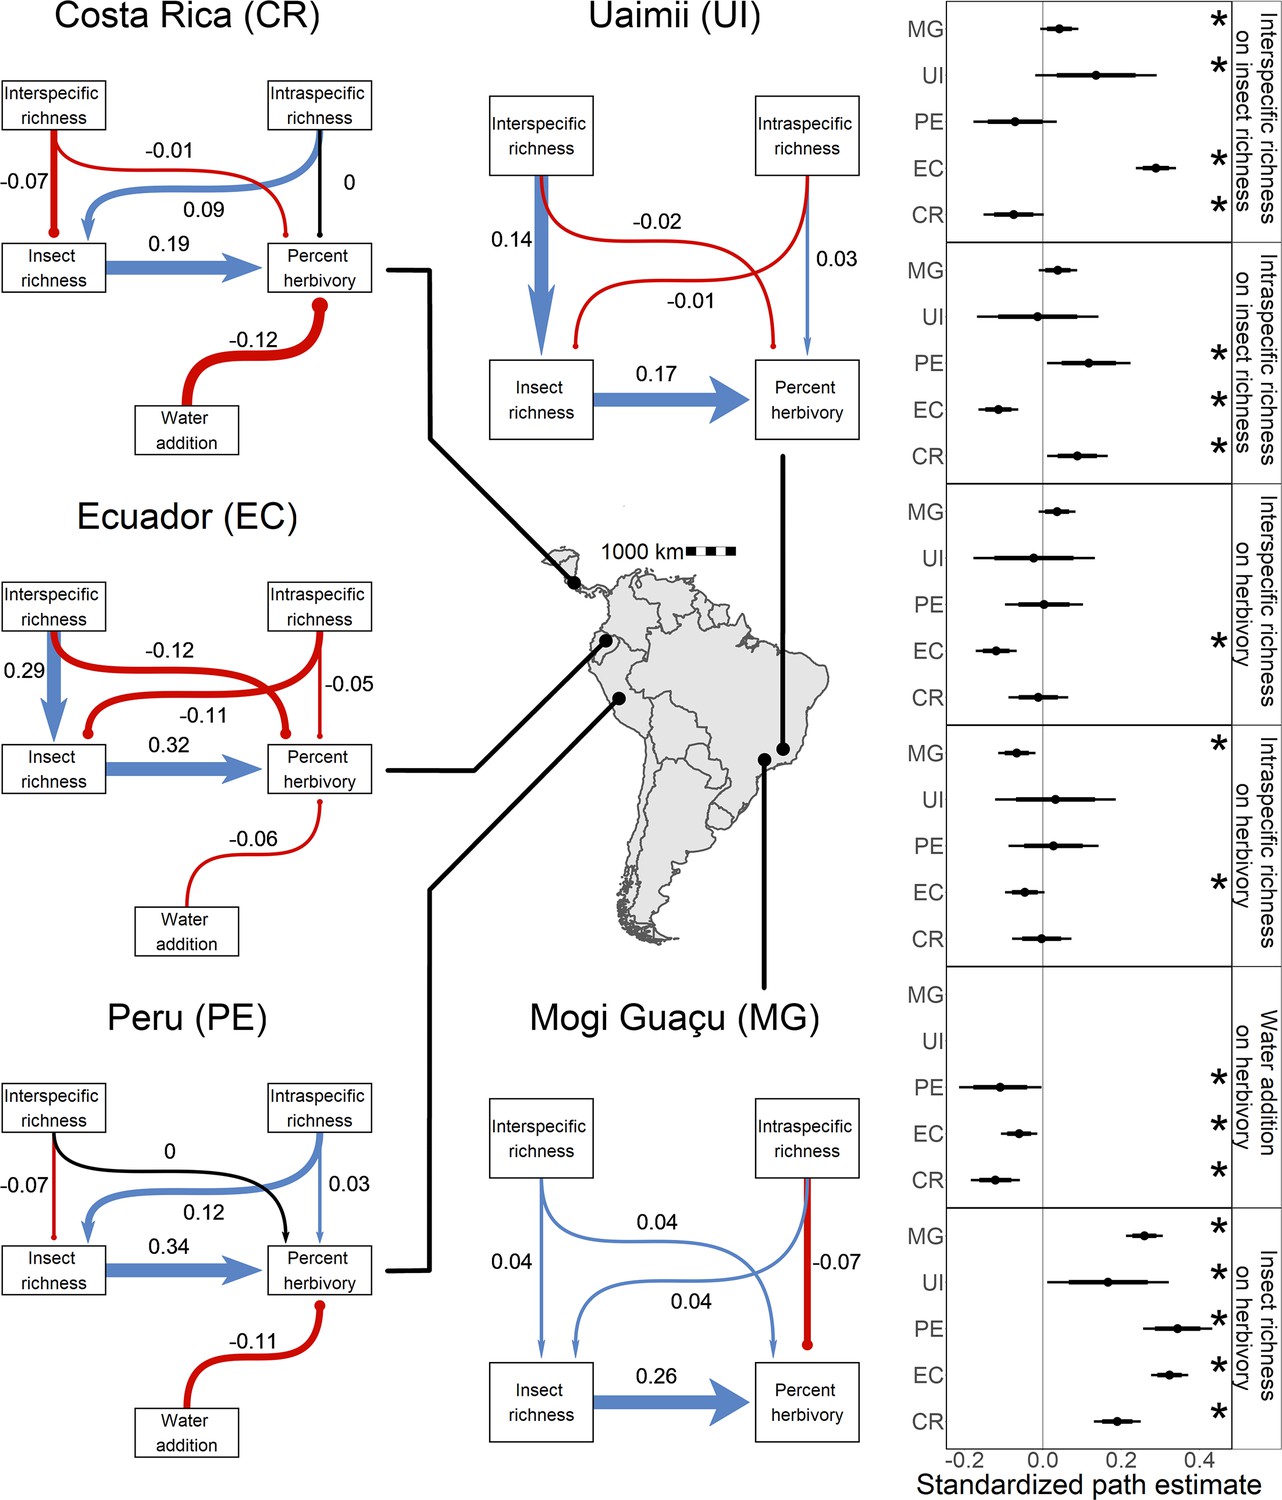
Direct and indirect effects of plant diversity and water availability on insect herbivores at five study sites.
Bayesian structural equation models comparing effects of different drivers of herbivorous insect richness and herbivory at five sites. Standardized path coefficients are means of the posterior distribution for the effects estimated at each causal path. Positive relationships are indicated in blue with triangular heads, and negative relationships are indicated in red with circular heads. Black arrows indicate path coefficients of zero magnitude. Dot plots summarize the standardized mean of the posterior distribution for each causal path with 95% and 80% credible intervals. Asterisks indicate causal paths where the probability of an effect being positive or negative is >95%.
Figure 3—figure supplement 1
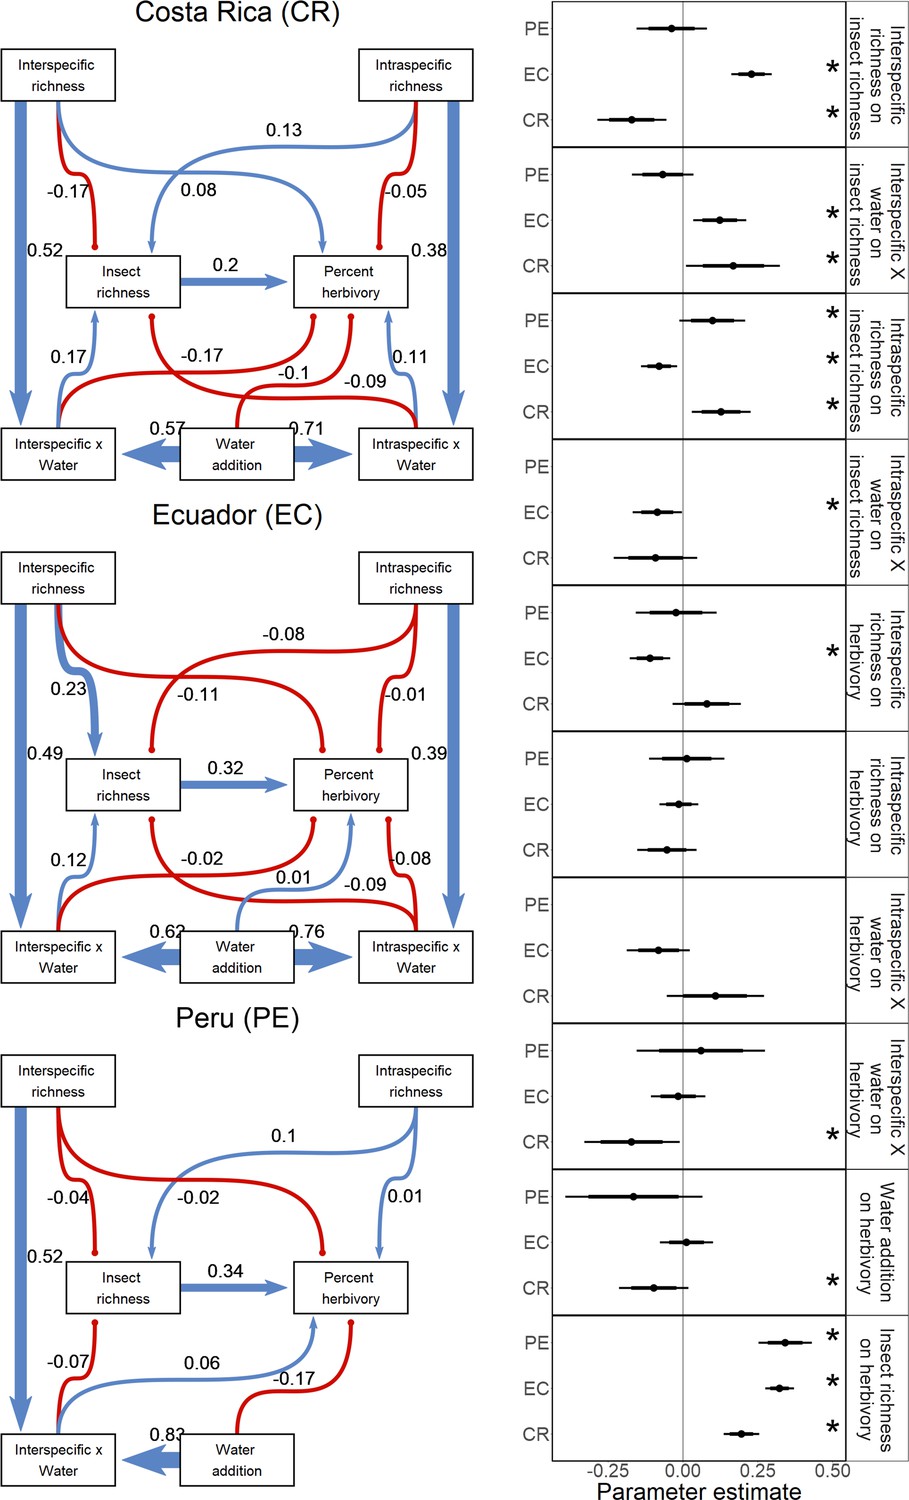
Bayesian structural equation models for drivers of insect richness, herbivory, and Piper survival at three sites, including interactions between intraspecific and interspecific richness, and water addition.
Path coefficients indicate the standardized mean of the posterior distribution for each causal path. Positive relationships are indicated in blue with triangular heads, and negative relationships are indicated in red with circular heads. Dot plots indicate the standardized mean of the posterior distribution for each causal path in A with 95% and 80% credibility intervals. Asterisks indicate causal paths where the probability of an effect being entirely positive or entirely negative is >95%.
Figure 3—figure supplement 2
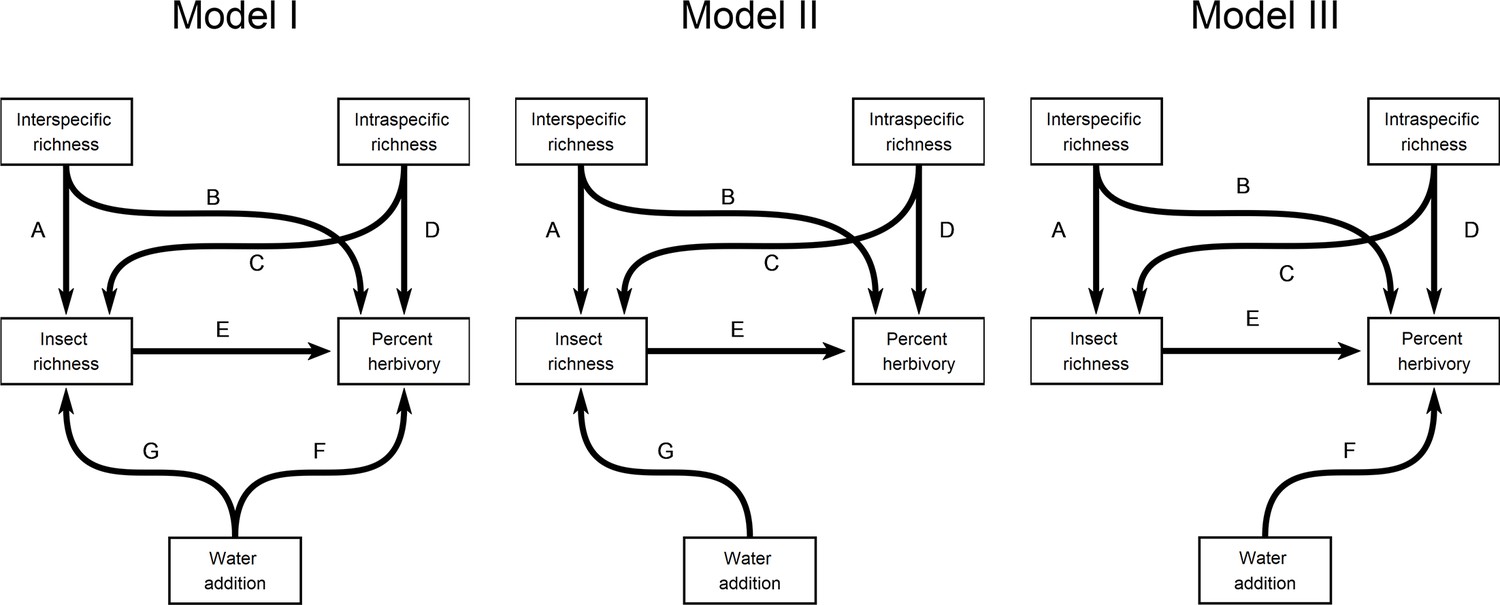
Three causal models tested across sites.
Models I-III were tested in Costa Rica, Ecuador, and Peru. A model without water addition was tested in Mogi and Uiamii. Model II was selected as the best performing model at all sites where the water addition treatment was applied.
Figure 4 with 1 supplement
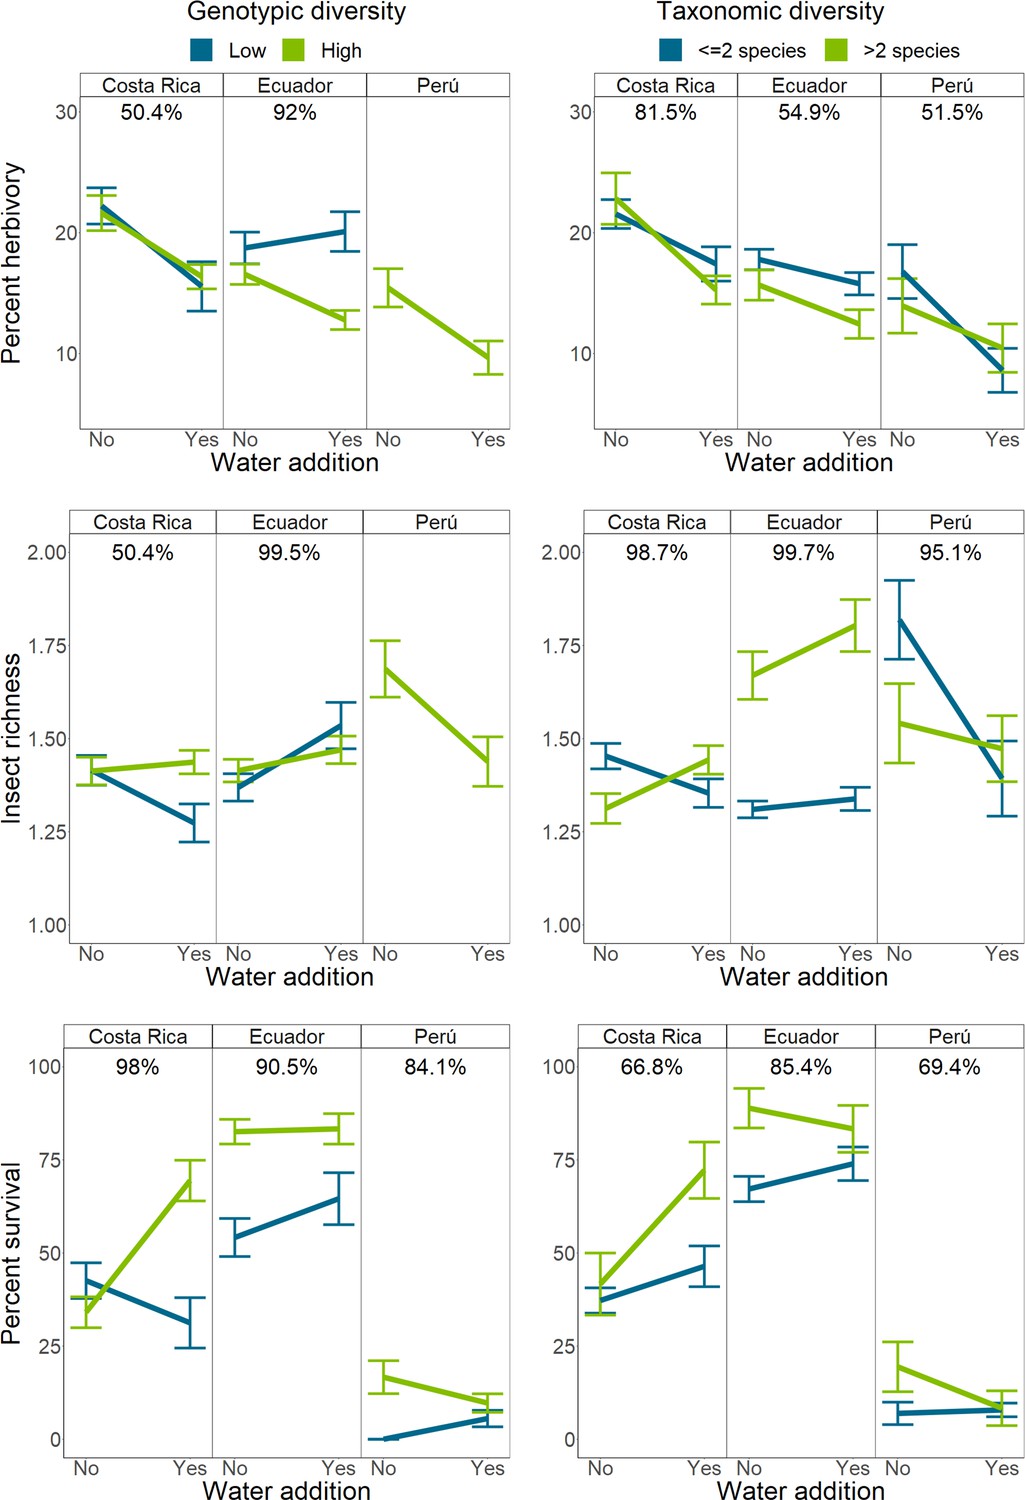
Interactions between intraspecific or interspecific richness and water availability on herbivory, herbivorous insect richness, and Piper survival.
Bars indicate mean response and standard error of the mean. Percentages above each sub-figure indicate the probability that the two slopes are different as calculated using site-level hierarchical Bayesian models. Due to high mortality in Peru, interactions between water and intraspecific richness could not be compared for any responses except mortality. Single and two species richness plots have been combined for visualization purposes only.
Figure 4—figure supplement 1

Percent Piper survival over time in five sites, compared to levels of intraspecific richness and water addition.
Tables
Table 1
Path models and explanatory hypotheses.
Causal path labels refer to Figure 3—figure supplement 2.
| Hypothesis | Causal paths | Sites tested |
|---|---|---|
| Bottom-up diversity: Host plant diversity impacts insect richness through multiple mechanisms, such as reducing host density, masking or amplifying host signals, or altering the proportion of specialist herbivores (Agrawal et al., 2006; Barbosa et al., 2009; Root, 1973) | All models; paths A, C | All sites |
| Neighborhood effects: Plant diversity directly affects herbivory through mechanisms which do not alter herbivore diversity (Agrawal et al., 2006; Barbosa et al., 2009) | All models; paths B, D | All sites |
| Water affects herbivore diversity: Changes in water availability induce changes to plant nutrition and defenses which can benefit or harm different herbivore taxa, leading to changes in herbivore diversity (Gely et al., 2020; Lenhart et al., 2015) | Models I, II; path G | Costa Rica, Ecuador, Peru |
| Water affects herbivory: Water addition directly affects plant physiology, altering both the nutritive quality of plant tissue and the ability of plants to combat herbivores and leading to changes in herbivory (White, 1974) | Models I, III; path F | Costa Rica, Ecuador, Peru |
Additional files
-
Supplementary file 1
Mean parameter estimates and probability of direction (PD) for the effects of increases in intraspecific diversity, interspecific richness, water availability, and insect richness on measures of herbivory, plant mortality, and insect richness.
- https://cdn.elifesciences.org/articles/86988/elife-86988-supp1-v1.docx
-
Supplementary file 2
Study site characteristics and experimental details.
*Climate data from La Selva Biological station are for the experimental period (2015–2018) and were provided by the Organization for Tropical Studies. Data from El Fundo Génova are based on nearby San Ramón (https://en.climate-data.org/south-america/peru/junin/san-ramon-28556/). Data from Ecuador were provided by Yanayacu Biological Station. Data for Mogi-Guaçu Biological Reserve are from January 2017 to December 2019 and are from the Centro Integrado de Informações Agrometeorológicas of São Paulo. Data for Uaimii State Forest are from the Plano de Manejo FLOE Uaimii, Instituto Estadual de Florestas of Minas Gerais
- https://cdn.elifesciences.org/articles/86988/elife-86988-supp2-v1.docx
-
Supplementary file 3
Species of Piper used at each study location.
* indicates morphospecies.
- https://cdn.elifesciences.org/articles/86988/elife-86988-supp3-v1.docx
-
MDAR checklist
- https://cdn.elifesciences.org/articles/86988/elife-86988-mdarchecklist1-v1.pdf
Download links
A two-part list of links to download the article, or parts of the article, in various formats.
Downloads (link to download the article as PDF)
Open citations (links to open the citations from this article in various online reference manager services)
Cite this article (links to download the citations from this article in formats compatible with various reference manager tools)
Intra- and interspecific diversity in a tropical plant clade alter herbivory and ecosystem resilience
eLife 12:RP86988.
https://doi.org/10.7554/eLife.86988.3


