Yeast cell responses and survival during periodic osmotic stress are controlled by glucose availability
- Laboratoire Matière et Systèmes Complexes, UMR 7057 CNRS & Université Paris Diderot, 10 rue Alice Domon et Léonie Duquet, France
- Laboratoire de Biologie et Modélisation de la Cellule, Ecole Normale Supérieure de Lyon, CNRS, UMR 5239, Inserm, U1293, Université Claude Bernard Lyon 1, 46 allée d'Italie F-69364, France
- Laboratoire Physico Chimie Curie, UMR168, Institut Curie, 16 rue Pierre et Marie Curie, 75005, France
Figures
Figure 1 with 1 supplement
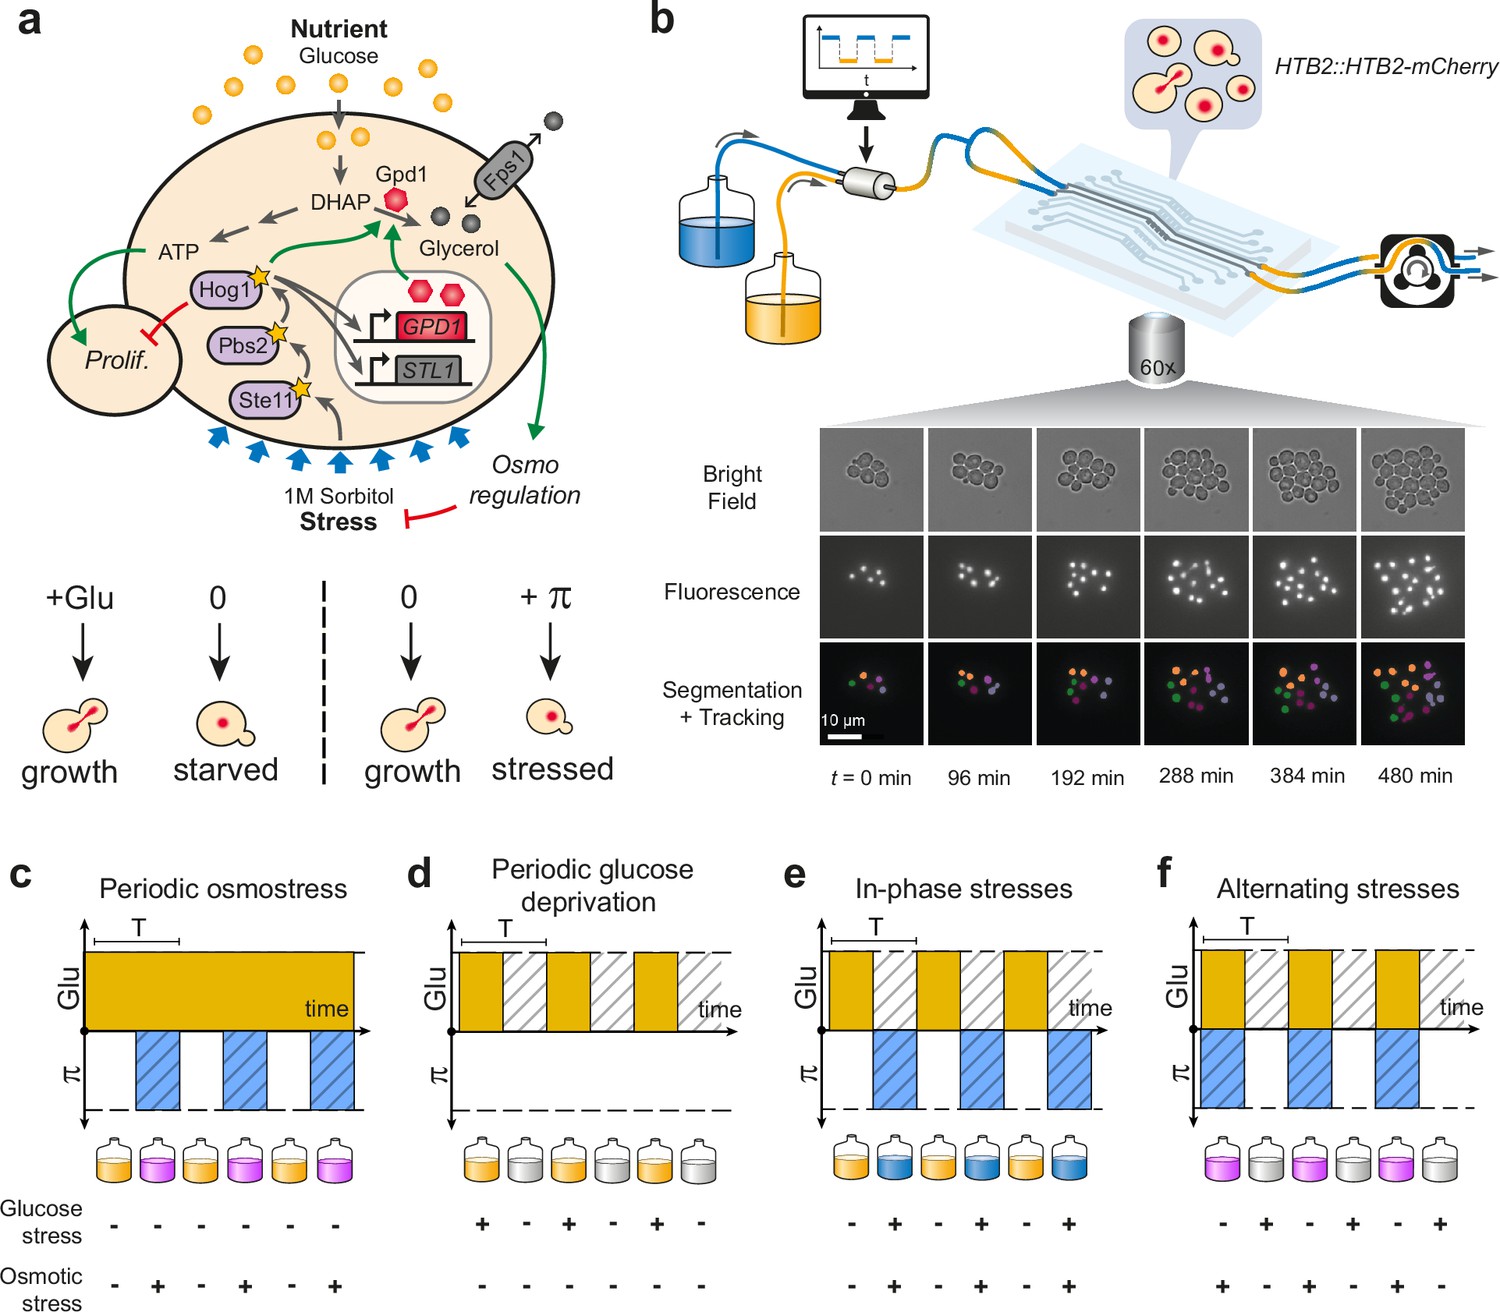
Live imaging of yeast cells grown in periodically fluctuating environments.
(a) Overview of the hyperosmotic stress response in yeast. Both glucose deprivation and osmotic stress lead to cell cycle arrest—through different molecular mechanisms. Yeast cells maintain osmotic equilibrium by regulating the intracellular concentration of glycerol. Glycerol synthesis is regulated by the activity of the HOG MAP kinase cascade that acts both in the cytoplasm (fast response) and on the transcription of target genes in the nucleus (long-term response). For simplicity, we only represented on the figure genes and proteins involved in this study. (b) Sketch of the microfluidic setup used to generate a time-varying environment and achieve time-lapse imaging of yeast cells. Bright-field and fluorescence images are captured every 6 min at 25 positions for 12‒24 hr depending on the experiment. Nuclei expressing HTB2-mCherry fusion protein are segmented and tracked over time to compute the cell division rate as a function of time. Scale bar represents 10 μm. (c–f) The four periodically varying environments used in this study. (c) Periodic osmotic stress: cells are periodically exposed to hyperosmotic stress (1 M sorbitol) in a constant glucose environment (2% or 0.1%). (d) Periodic glucose deprivation: environment alternates between presence and absence of glucose. (e) In-phase stresses (IPS): periodic exposure to glucose in absence of hyperosmotic stress followed by glucose depletion with hyperosmotic stress (1 M sorbitol). (f) Alternating stress (AS): periodic exposure to glucose with hyperosmotic stress (1 M sorbitol), followed by glucose depletion without hyperosmotic stress. (c–f). Hatching represents stress; blue indicates presence of sorbitol; orange, presence of glucose.
Figure 1—figure supplement 1
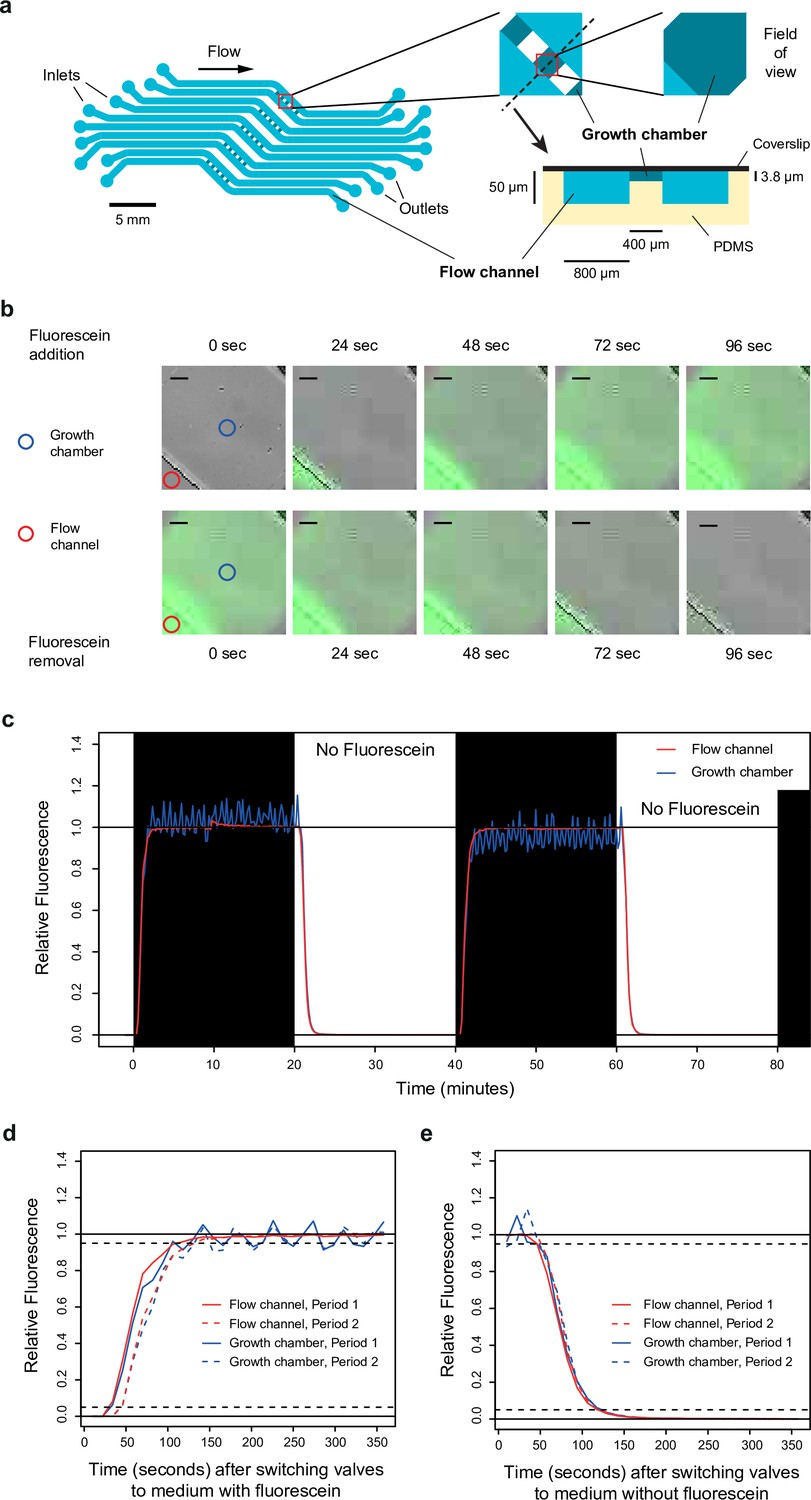
Dynamics of media switching inside the microfluidic chip.
(a) Design of the microfluidic device used in this study. Cells are trapped in five sets of five growth chambers (400×400×3.8 µm3 each) located in the center of the polydimethylsiloxane (PDMS) chip. Each set of five growth chambers is connected to two flow channels to allow rapid diffusion of the medium inside the chambers. The dynamics and composition of media can be independently controlled for each set. The pattern of the microfluidic device (at scale) is shown on the left, with a close-up caption of a growth chamber shown on the top right. A transverse view (out of scale) along the black dotted line is shown on the bottom right. (b) Images showing fluorescence dynamics in a growth chamber after fluorescein (50 nM) is added (top row) or removed (bottom row) from the medium. Blue and red circles show the two positions where fluorescence was quantified in (c–e). Scale bars represent 50 µm. (c) Quantification of fluorescence dynamics during periodic switches between SC medium with and without fluorescein. (d) Relative fluorescence measured during 350 s after switching the valve from medium without fluorescein to medium with fluorescein. (e) Relative fluorescence measured during 350 s after switching the valve from medium with fluorescein to medium without fluorescein. Data shown in (d) and (e) are also shown in (c) (same experiment). (c–e) Fluorescence was quantified both in the flow channel (red line) and in the middle of the growth chamber (blue line). Fluorescence is expressed on a relative scale (see Materials and methods) to focus the comparison on the temporal dynamics instead of the absolute fluorescence level (the fluorescence intensity is much lower in the growth chamber because it is thinner than the flow channel). Acquisition of bright-field and fluorescence images was performed once every 12 s.
-
Figure 1—figure supplement 1—source data 1
Source data for Figure 1—figure supplement 1.
- https://cdn.elifesciences.org/articles/88750/elife-88750-fig1-figsupp1-data1-v1.zip
Figure 2 with 3 supplements
The frequencies of osmostress and glucose availability impact cell division rates in opposite ways.
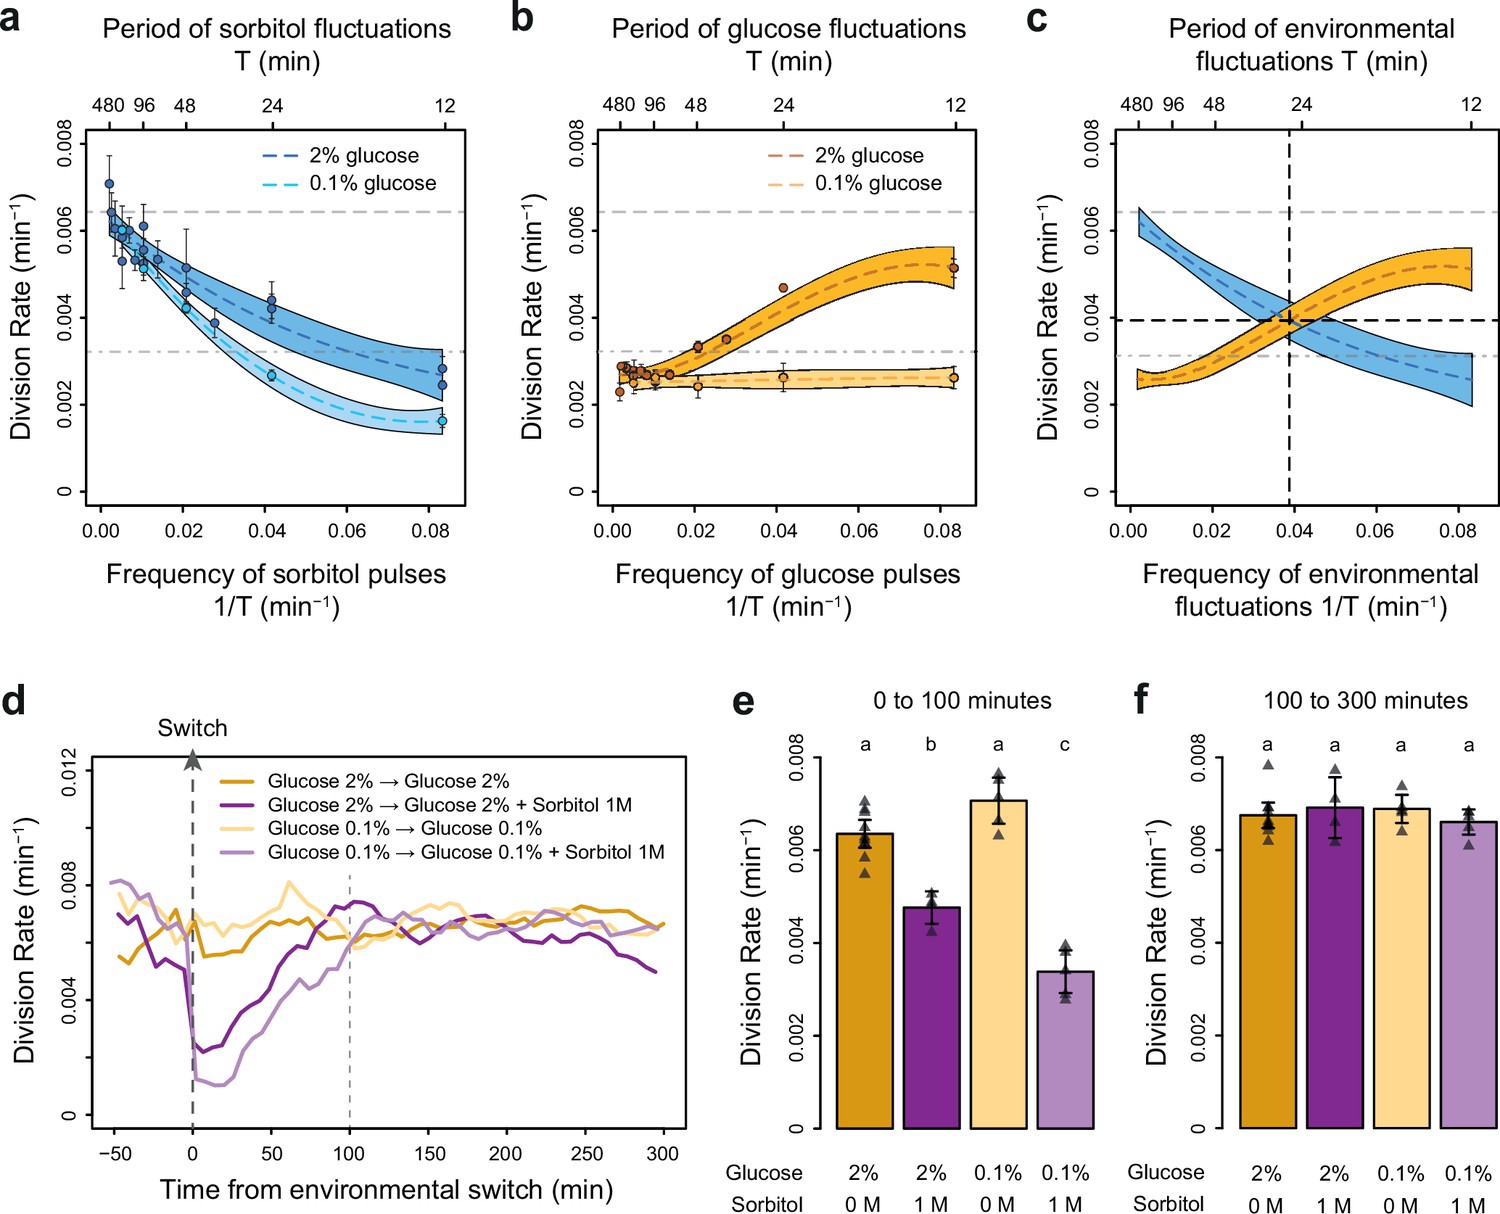
(a, b) Impact of the frequency of periodic osmotic stress (a) and glucose deprivation (b) on the average division rate. Each dot shows the mean division rate measured in 2 to 5 different growth chambers of the microfluidic chip. Error bars are 95% confidence intervals of the mean. Colored dotted lines are Loess regressions obtained using a smoothing parameter of 0.66. Colored areas represent 95% confidence intervals of the regression estimates. Gray dashed lines show the average division rate in the absence of sorbitol (no osmotic stress) in 2% glucose (top line) and dash-dotted lines show half this average division rate (bottom line). (c) Overlay of the Loess regressions shown in (a) and (b) at 2% glucose. The frequency and division rate at which the two regression curves intersect are highlighted by vertical and horizontal black dotted lines. (d) Temporal dynamics of the division rate of cells exposed to sustained hyperosmotic stress (purple lines, 1 M sorbitol added at t=0 min) or to standard conditions (orange lines) with 2% glucose (darker lines) or 0.1% glucose (lighter lines). Each curve represents the ‘instantaneous’ division rate calculated every 6 min across sliding windows of 36 min (see Materials and methods) and averaged for cells imaged at 2 to 10 positions in the microfluidic chip. (e, f) Cell division rates measured (e) from 0 to 100 min and (f) from 100 to 300 min after the addition of 1 M sorbitol. Triangles represent the average division rate measured in different growth chambers of the microfluidic chips. Error bars are 95% confidence intervals of the mean division rate among growth chambers. The initial number of cells analyzed among replicates ranged from 75 to 372 in (a), from 58 to 342 in (b), and from 220 to 776 in (d–f).
-
Figure 2—source data 1
Source data for Figure 2.
- https://cdn.elifesciences.org/articles/88750/elife-88750-fig2-data1-v1.zip
Figure 2—figure supplement 1

Impact of a single hyperosmotic shock on cell division rate.
(a–d) Temporal dynamics of division rate as shown in Figure 2d but with confidence intervals and individual data points. Colored lines are the same as in Figure 2d. Colored areas represent 95% confidence intervals of the average division rate. Colored dots show the average division rate measured every 6 min (not averaged across sliding windows) among all growth chambers exposed to the same medium. Horizontal dotted lines show the average division rate measured between 100 and 300 min after medium switching (i.e. after adaptation to the new medium) in the absence (orange) or presence (purple) of osmotic stress. Vertical dotted lines show time t=0 when the medium was changed in the microfluidic chip. (b, d) Gray areas represent the cost in cell divisions of one sustained hyperosmotic shock (1 M sorbitol) in (b) 2% glucose or (d) 0.1% glucose. The initial number of cells analyzed among replicates ranged from 220 to 776.
-
Figure 2—figure supplement 1—source data 1
Source data for Figure 2—figure supplement 1.
- https://cdn.elifesciences.org/articles/88750/elife-88750-fig2-figsupp1-data1-v1.zip
Figure 2—figure supplement 2
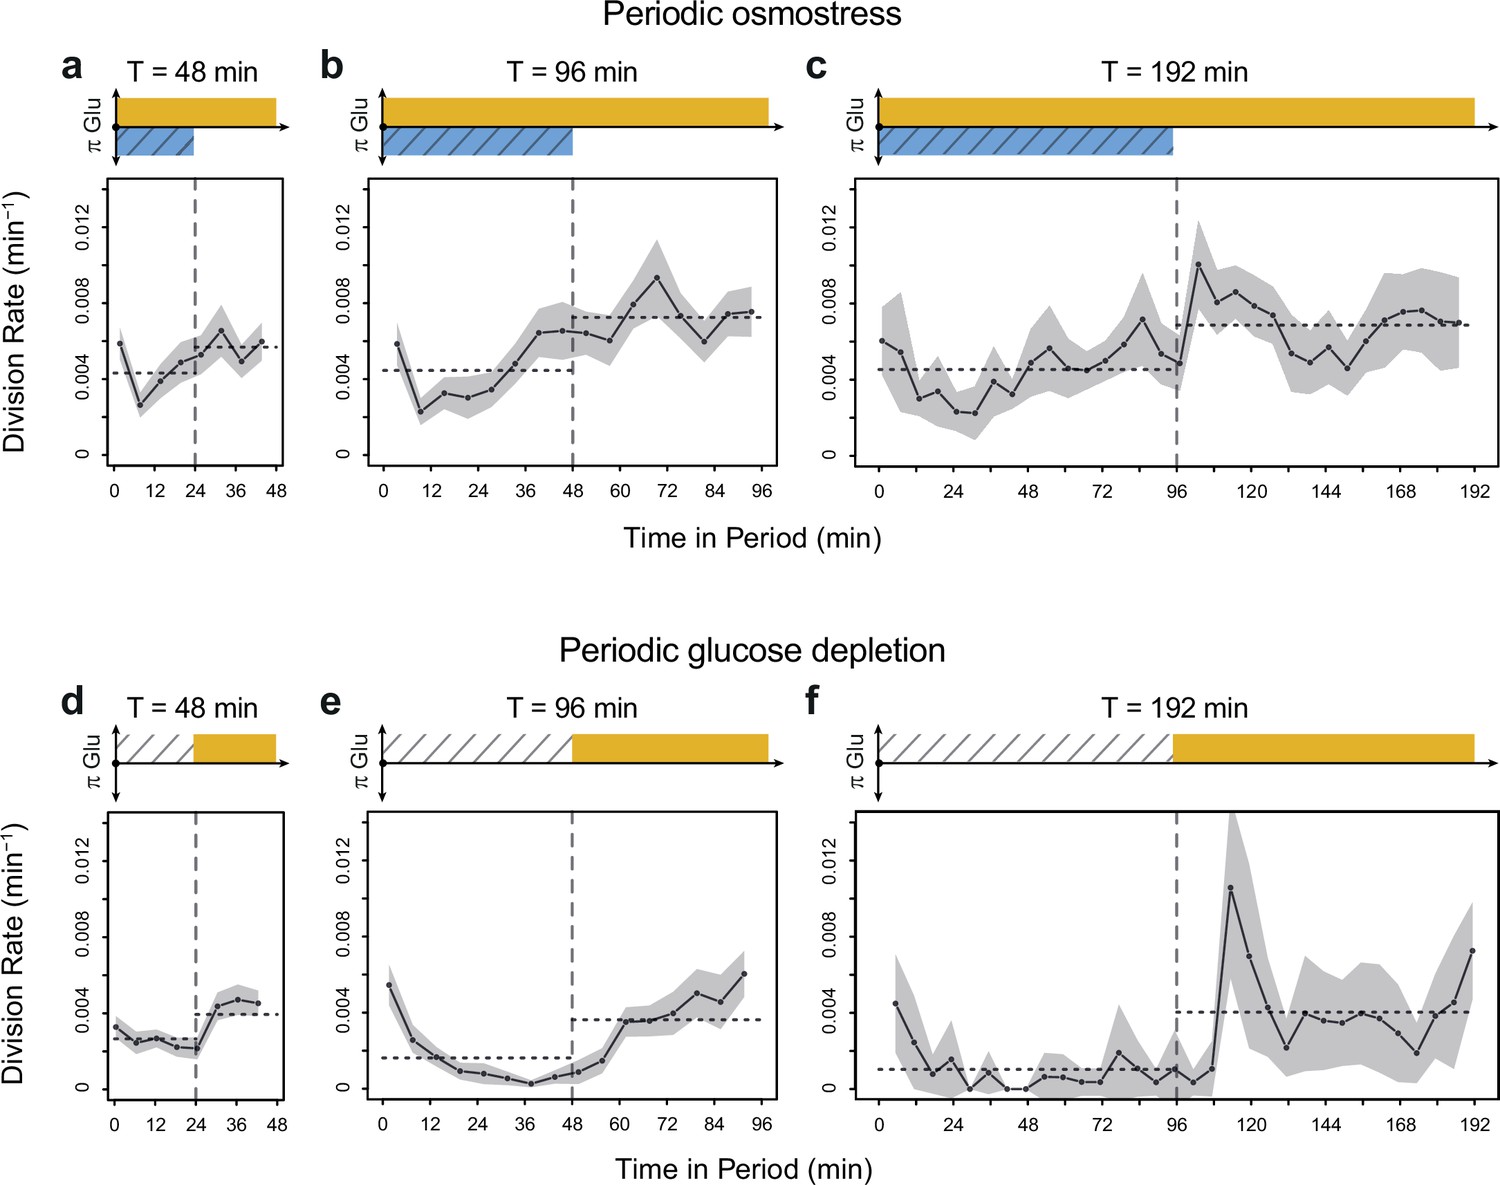
Temporal dynamics of division rate under periodic osmotic stress and under periodic glucose depletion.
In each plot, division rates measured over several consecutive periods of environmental fluctuations are averaged in a single period: each dot shows the average division rate during a 6 min window centered on that dot for all fields of view sharing the same condition and for all periods in the experiment (average of 9 to 70 measurements per dot). (a–c) Temporal dynamics of division rate during fluctuations of osmotic stress (1 M sorbitol) with periods of 48 min (a), 96 min (b), and 192 min (c). (d–f) Temporal dynamics of division rate during glucose fluctuations (from 2% glucose to 0% glucose) with periods of 48 min (d), 96 min (e), and 192 min (f). Gray areas are 95% confidence intervals of the mean division rate. Horizontal dotted lines show the mean division rate for all data collected in each half-period. The colored bars represent the periodic fluctuations of glucose (orange) and/or sorbitol (blue); hatching represents stress.
-
Figure 2—figure supplement 2—source data 1
Source data for Figure 2—figure supplement 2.
- https://cdn.elifesciences.org/articles/88750/elife-88750-fig2-figsupp2-data1-v1.zip
Figure 2—figure supplement 3

Division rates of HOG pathway mutants under constant and periodic osmotic stress.
(a) Division rates of the wild-type strain and of seven deletion mutants in four steady conditions. Bars show the mean division rate measured among growth chambers sharing the same environmental condition. Error bars are 95% confidence intervals of the mean. Dark dots show the average division rate for each field of view. Colors represent the different environmental conditions indicated at the bottom. (b, c) Temporal dynamics of division rate of (b) pbs2Δ mutant cells and (c) hog1Δ mutant cells under sustained hyperosmotic stress (purple line, 1 M sorbitol added at t=0 min) or in standard condition with 2% glucose (orange line). Each curve represents the ‘instantaneous’ division rate calculated every 6 min across sliding windows of 36 min (see Materials and methods) and averaged for cells imaged at several positions in the microfluidic chip. Colored areas represent 95% confidence intervals of the average division rate. Colored dots show the average division rate measured every 6 min (not averaged across sliding windows) among all growth chambers exposed to the same medium. Horizontal dotted lines show the average division rate measured between 100 and 300 min after medium switching (i.e. after adaptation to the new medium) in the absence of osmotic stress. Vertical dotted lines show the time t=0 when the medium was changed in the microfluidic chip. (d–f) Relationship between the frequency of osmotic stress and division rate for (d) hog1Δ, (e) ste11Δ, and (f) pbs2Δ mutant cells. Data collected for each mutant strain are shown in blue, while data collected for the wild-type strain (yPH_132) are shown in gray as reference. Each dot shows the mean division rate measured among 4 to 13 different growth chambers exposed to the same condition. Error bars are 95% confidence intervals of the mean. Dotted lines are Loess regressions obtained with a smoothing parameter of 0.66. Filled areas represent 95% confidence intervals of the regression estimates. The initial number of cells analyzed among replicates ranged from 77 to 1753 in (a), from 75 to 386 in (d), from 75 to 539 in (e), and from 53 to 386 in (f).
-
Figure 2—figure supplement 3—source data 1
Source data for Figure 2—figure supplement 3.
- https://cdn.elifesciences.org/articles/88750/elife-88750-fig2-figsupp3-data1-v1.zip
Figure 3 with 1 supplement
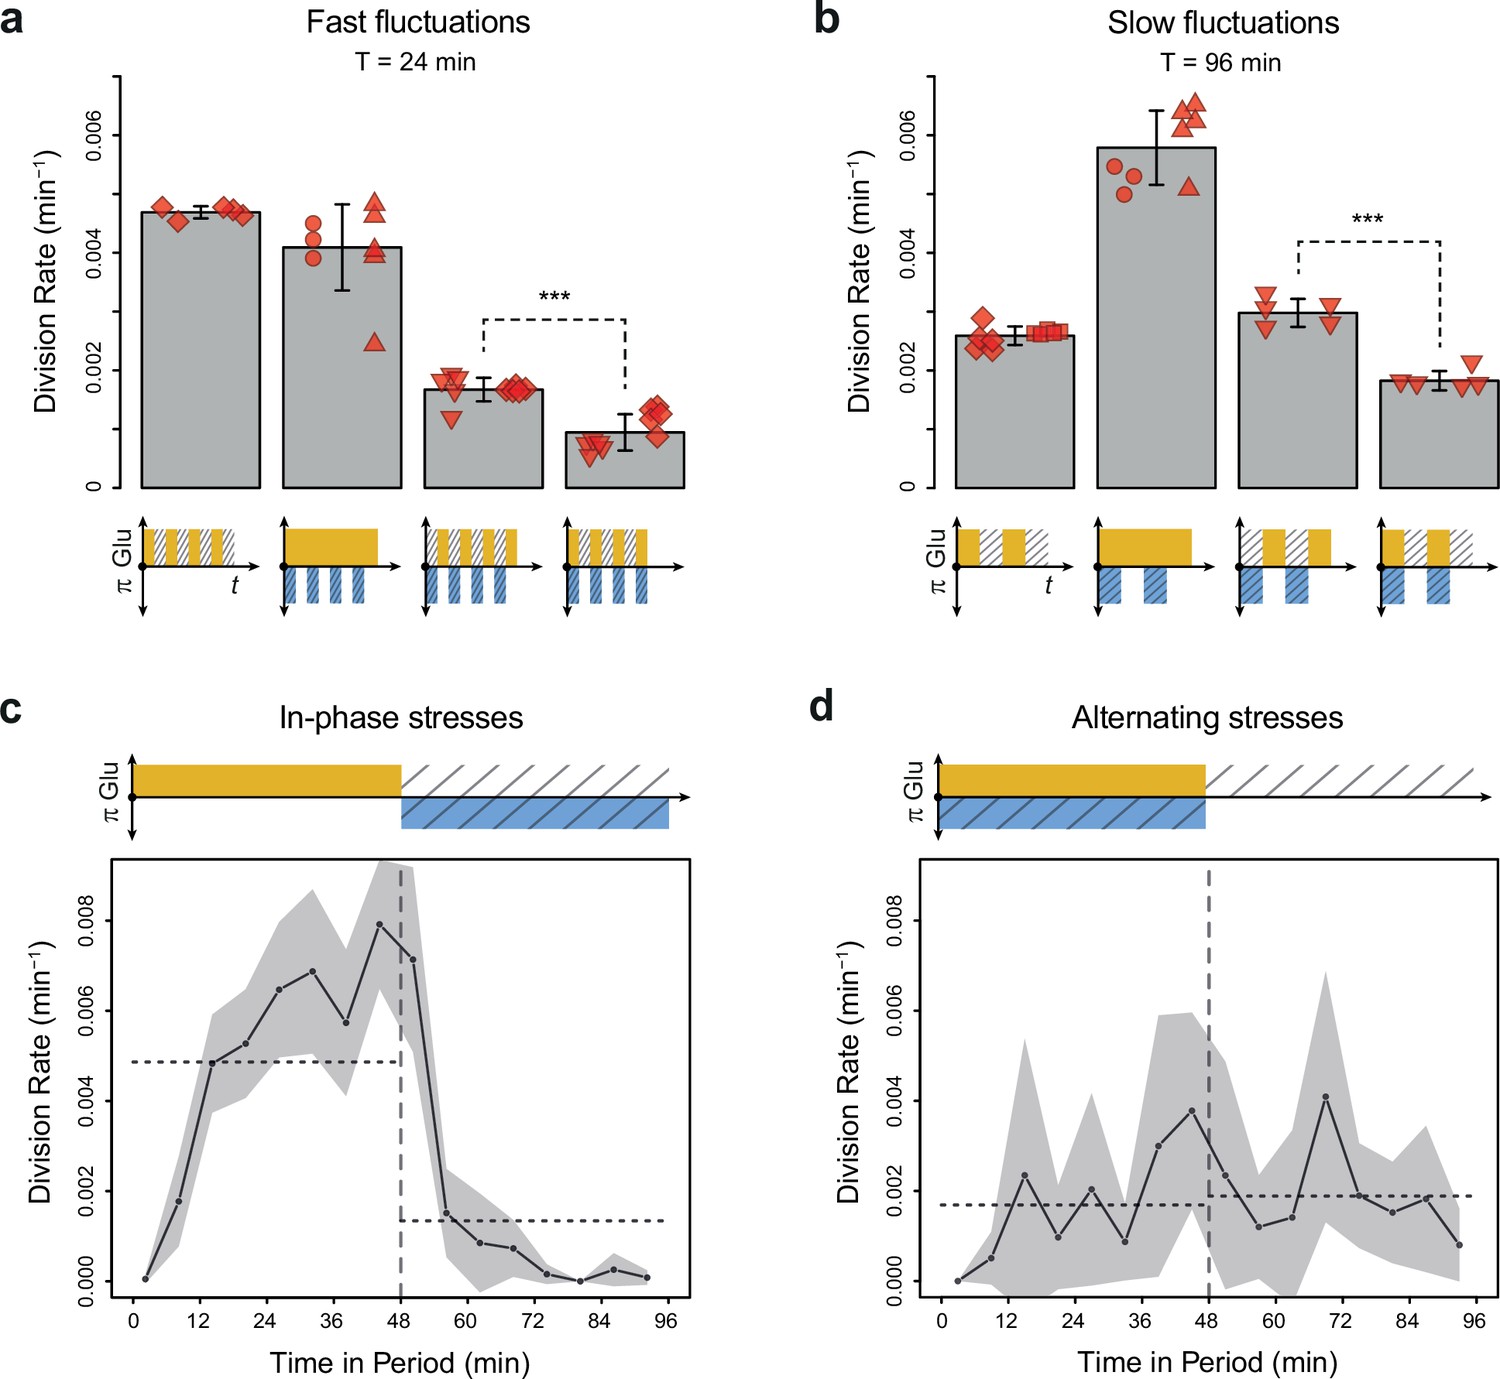
Cell division rate depends on the phasing of hyperosmotic stress and glucose availability.
(a, b) Division rates measured in four fluctuating conditions with a period of 24 min and a glucose concentration of 2% (20 g/L). The four conditions are periodic glucose deprivation, periodic osmostress, in-phase stresses (IPS), and alternating stresses (AS). Bars represent mean division rates among different growth chambers. Error bars are 95% confidence intervals of the mean. Red symbols show the average division rate in each growth chamber, with different symbols representing experiments performed on different days with different microfluidic chips. Mean division rates were compared between IPS and AS conditions using t-tests (***p<0.001). (c, d) Temporal dynamics of division rate during a period of 96 min in (c) IPS and (d) AS conditions for wild-type cells. Each dot shows the average division rate during a 6 min window centered on that dot for all fields of view sharing the same condition and for all periods in the experiment (average of 16 to 30 measurements per dot). Gray areas are 95% confidence intervals of the mean division rate. Horizontal dotted lines show the mean division rate for all data collected in each half-period. The colored bars represent the periodic fluctuations in glucose (orange) and/or sorbitol (blue); hatching represents stress. (a–d) Cells were grown under fluctuations of 2% glucose and 1 M sorbitol. The initial number of cells analyzed among replicates ranged from 124 to 318 in (a) and from 94 to 342 in (b–d).
-
Figure 3—source data 1
Source data for Figure 3.
- https://cdn.elifesciences.org/articles/88750/elife-88750-fig3-data1-v1.zip
Figure 3—figure supplement 1

Division rates under regimes of in-phase stresses (IPS) and alternating stresses (AS) with different fluctuation periods and glucose concentrations.
(a) Accumulation of new cells as a function of time under IPS condition (periodic growth in medium with 2% glucose for 12 min, followed by medium without glucose and with 1 M sorbitol for 12 min). (b) Accumulation of new cells as a function of time under AS condition (periodic growth in medium with 2% glucose and 1 M sorbitol for 12 min, followed by medium without glucose or sorbitol for 12 min). (a, b) Dots show the cumulative number of new cells over the total number of cells in one field of view as a function of time. The average cell division rate was calculated at the slope of the regression line (red line). Vertical colored bars show the timing of media switches (orange: 2% glucose and no sorbitol; blue: no glucose+1 M sorbitol; purple: 2% glucose+1 M sorbitol; white: no glucose and no sorbitol). (c, d) Mean cell division rate under fluctuations of 1 M sorbitol and/or 0.1% glucose with a period of (c) 24 min or (d) 96 min. The four conditions are periodic glucose deprivation, periodic osmostress, IPS, and AS. Bars represent the mean division rate among different growth chambers. Error bars are 95% confidence intervals of the mean. Red symbols show the mean division rate for each growth chamber (field of view), with different symbols representing data from experiments performed on different days with different microfluidic chips. t-Tests were performed to compare the mean division rate between IPS and AS conditions (**0.001≤p<0.01; ***p<0.001). Colored graphs are used to represent the periodic fluctuations of glucose (orange) and/or sorbitol (blue) in the medium; hatching represents stress. The initial number of cells analyzed among replicates ranged from 149 to 306 in (c) and from 83 to 136 in (d).
-
Figure 3—figure supplement 1—source data 1
Source data for Figure 3—figure supplement 1.
- https://cdn.elifesciences.org/articles/88750/elife-88750-fig3-figsupp1-data1-v1.zip
Figure 4 with 2 supplements
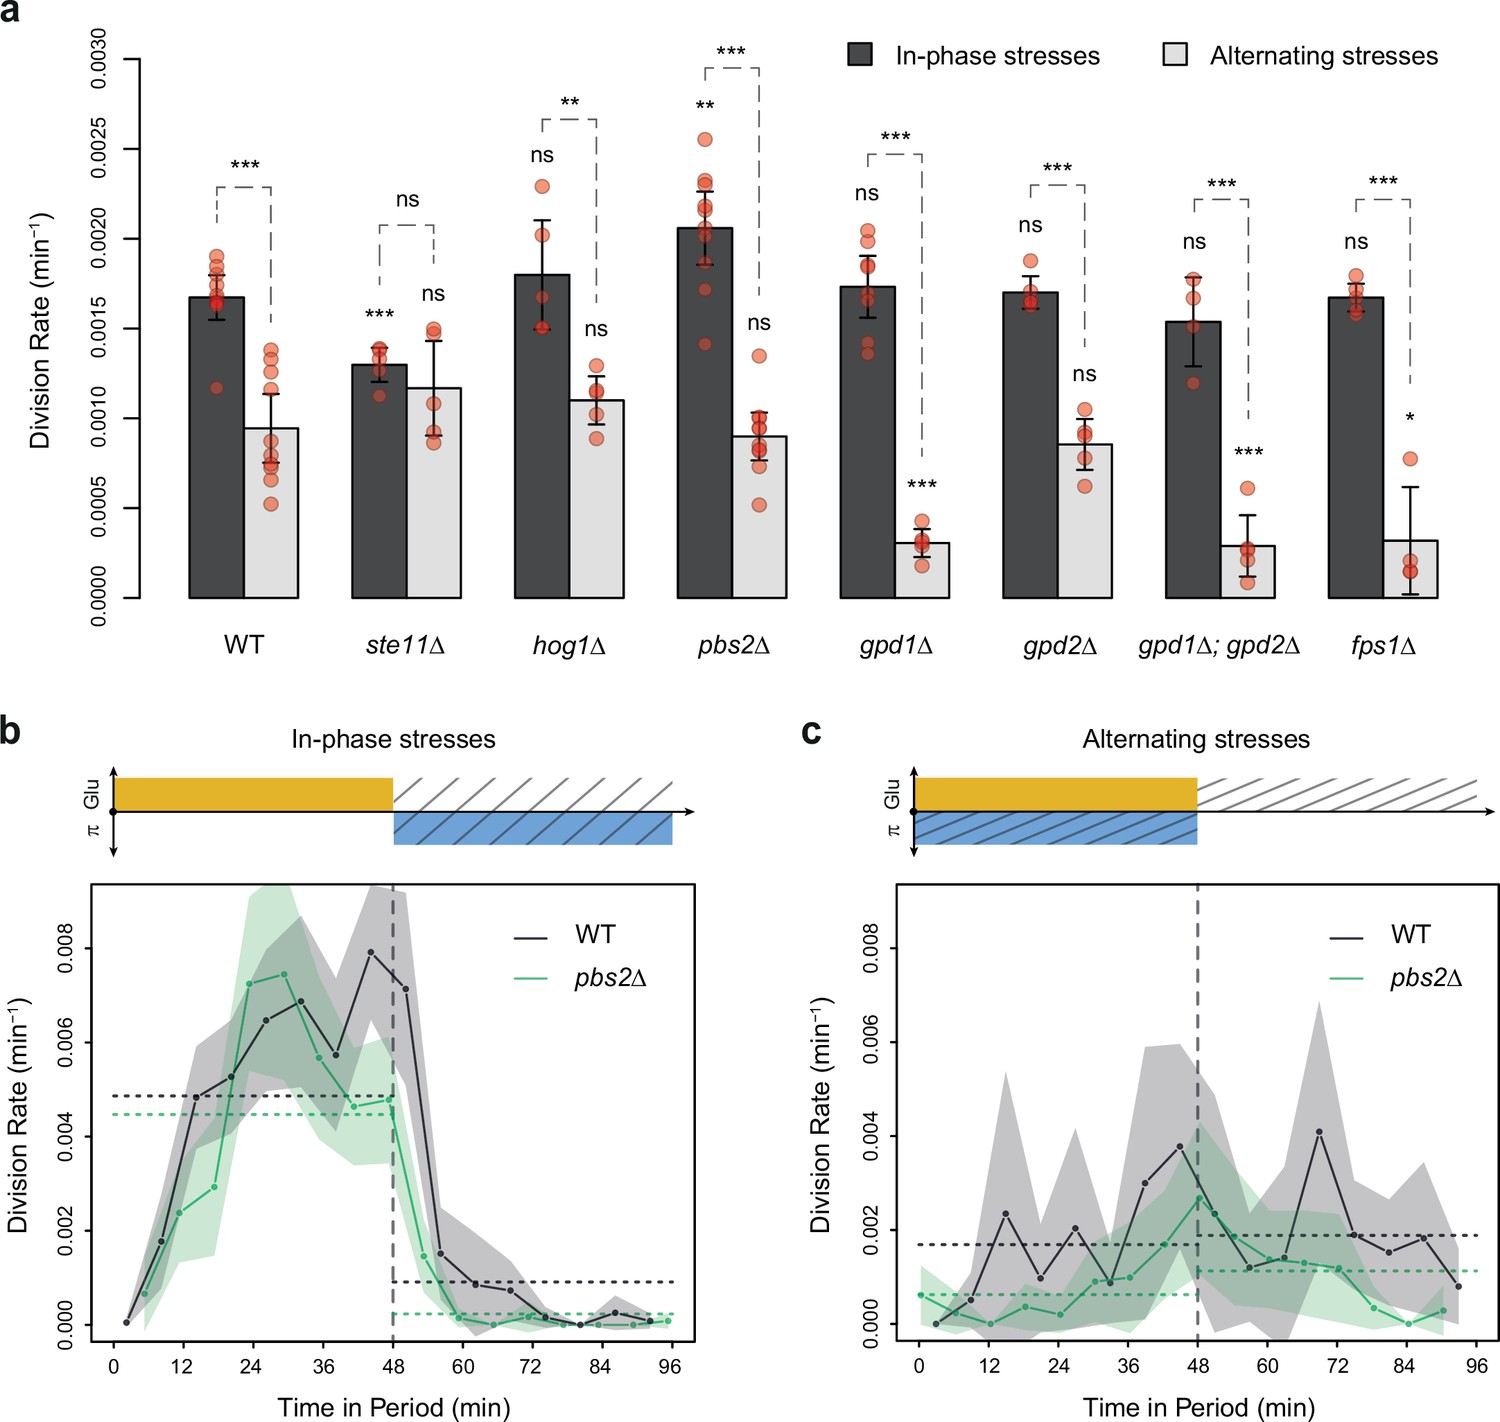
HOG pathway mutants grow faster under in-phase stresses (IPS) than under alternating stresses (AS).
(a) Division rates measured during growth in IPS and AS conditions with 2% glucose and a fluctuation period of 24 min. Bars show the mean division rate measured in different growth chambers of the microfluidic chip. Error bars are 95% confidence intervals of the mean. Red symbols show the average division rate in each growth chamber. Results of t-tests comparing the wild-type and mutant strains under the same condition are indicated above each bar; results comparing the same strain under different conditions are shown above each pair of bars (ns: p>0.05; *0.01<p<0.05; **0.001<p<0.01; ***p<0.001). (b, c) Temporal dynamics of division rate during a period of 96 min in (b) IPS and (c) AS conditions for wild-type (black) and pbs2Δ mutant (green) cells. Each dot shows the division rate during a 6 min window centered on that dot and averaged for all fields of view sharing the same condition and all periods in the experiment (average of 16 to 30 measurements per dot). Gray and green areas are 95% confidence intervals of the mean division rate. Horizontal dotted lines show the mean division rate for all data collected in each half-period. The colored bars represent the periodic fluctuations in glucose (orange) and/or sorbitol (blue); hatching represents stress. The initial number of cells analyzed among replicates ranged from 97 to 467 in (a) and from 124 to 145 in (b, c).
-
Figure 4—source data 1
Source data for Figure 4.
- https://cdn.elifesciences.org/articles/88750/elife-88750-fig4-data1-v1.zip
Figure 4—figure supplement 1

Division rates of HOG pathway mutants during in-phase stresses (IPS) and alternating stresses (AS) with different fluctuation periods and glucose concentrations.
(a–c) Division rate of deletion mutants during growth in IPS and AS conditions with (a) a period of 24 min and 0.1% glucose, (b) a period of 96 min and 2% glucose, and (c) a period of 96 min and 0.1% glucose. Bars show the mean division rate among growth chambers sharing the same environmental conditions. Error bars are 95% confidence intervals of the mean. Red symbols show the average division rate for each growth chamber. Results of t-tests comparing the wild-type and mutant strains under the same conditions are indicated above each bar; results comparing the same strain under different conditions are shown above each pair of bars (ns: p>0.05; *0.01<p<0.05; **0.001<p<0.01; ***p<0.001). (d, e) Temporal dynamics of division rate during a period of 96 min in (b) IPS and (c) AS conditions for wild-type (black) and ste11Δ mutant (green) cells. Each dot shows the division rate during a 6 min window centered on that dot and averaged for all fields of view sharing the same condition and all periods in the experiment (average of 16 to 30 measurements per dot). Gray and green areas are 95% confidence intervals of the mean division rate. Horizontal dotted lines show the mean division rate for all data collected in each half-period. The colored bars represent the periodic fluctuations in glucose (orange) and/or sorbitol (blue); hatching represents stress. The initial number of cells analyzed among replicates ranged from 22 to 411 in (a), from 94 to 626 in (b), and from 67 to 206 in (c).
-
Figure 4—figure supplement 1—source data 1
Source data for Figure 4—figure supplement 1.
- https://cdn.elifesciences.org/articles/88750/elife-88750-fig4-figsupp1-data1-v1.zip
Figure 4—figure supplement 2
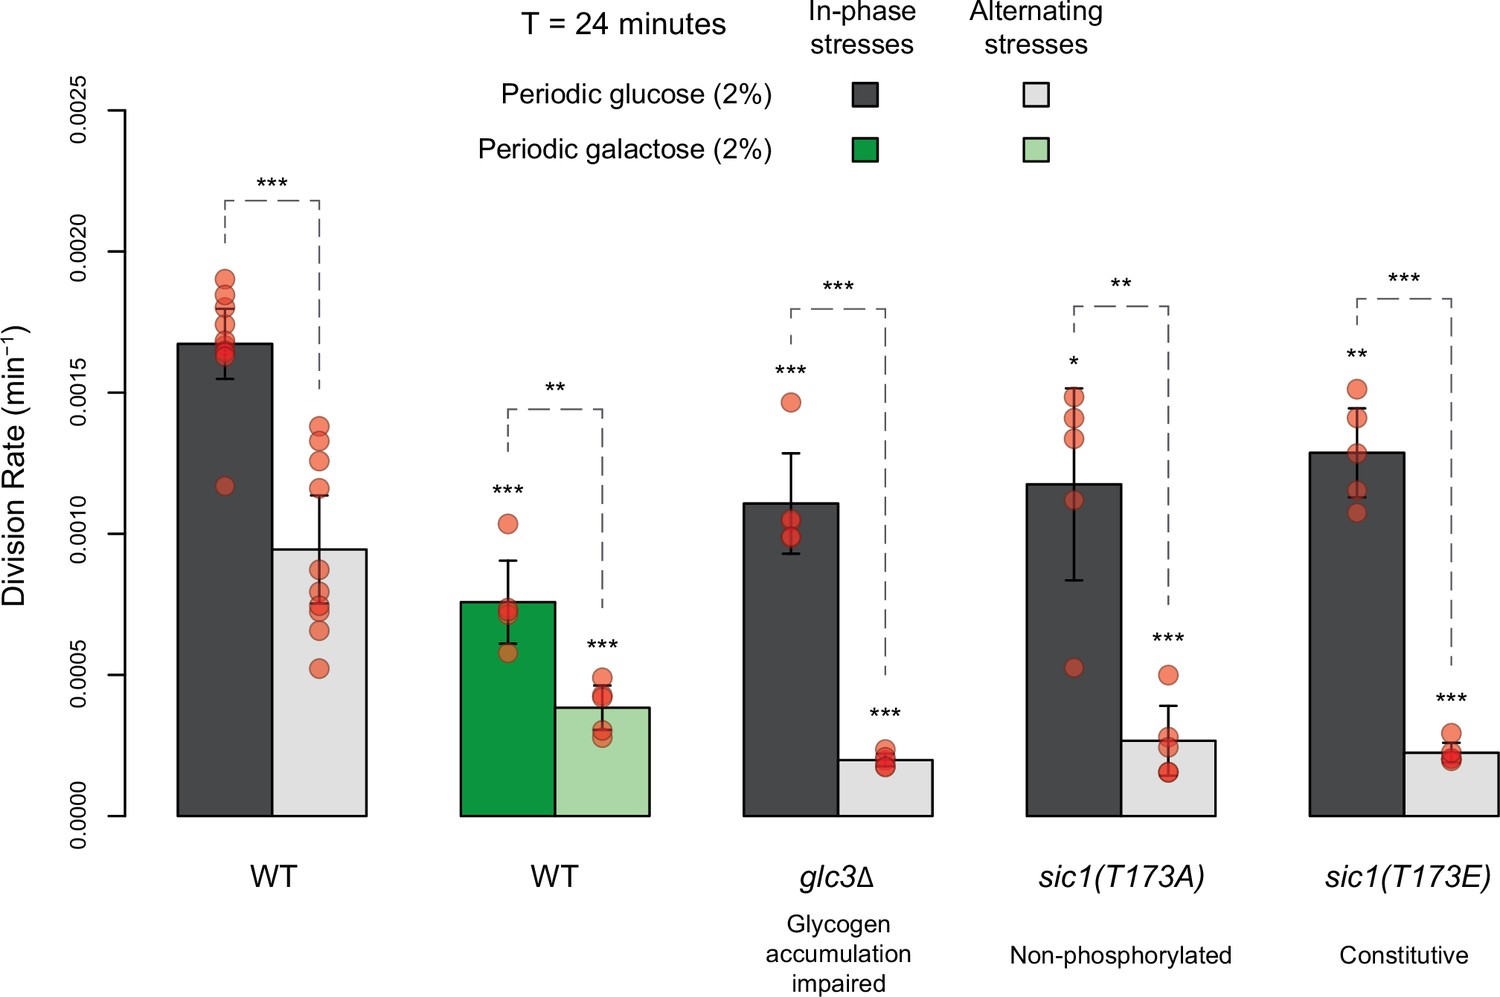
Comparing division rates during in-phase stresses and alternating stresses of wild-type cells exposed to periodic glucose (gray) or periodic galactose (green) and of mutant cells with impaired glycogen accumulation (glc3 deletion) or impaired cell cycle arrest in response to hyperosmotic stress (sic1 alleles).
The period of environmental fluctuations is 24 min in all conditions. Bars show the mean division rate among growth chambers sharing the same environmental conditions. Error bars are 95% confidence intervals of the mean. Red symbols show the average division rate for each growth chamber. Results of t-tests comparing the wild-type and mutant strains under the same conditions are indicated above each bar; results comparing the same strain under different conditions are shown above each pair of bars (ns: p>0.05; **0.001<p<0.01; ***p<0.001). The initial number of cells analyzed among replicates ranged from 14 to 120.
-
Figure 4—figure supplement 2—source data 1
Source data for Figure 4—figure supplement 2.
- https://cdn.elifesciences.org/articles/88750/elife-88750-fig4-figsupp2-data1-v1.zip
Figure 5 with 2 supplements
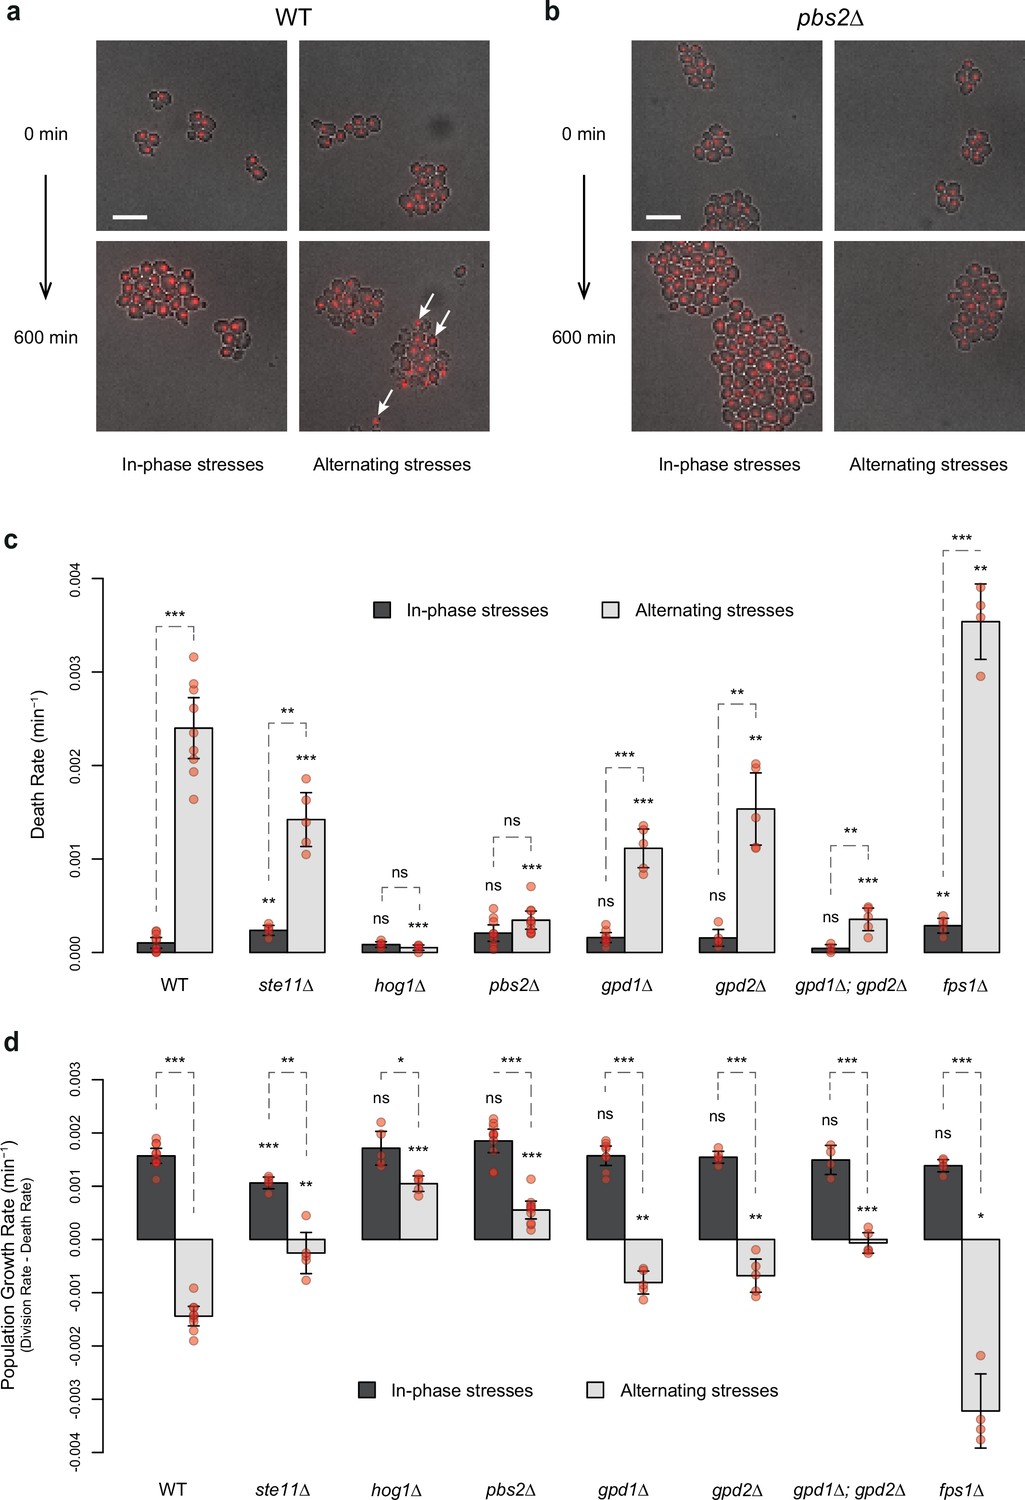
HOG pathway mutants exhibit a lower death rate and an increased population growth rate under in-phase stresses (IPS).
(a, b) Images of wild-type (a) and pbs2Δ mutant (b) cells before (t=0 min) and after (t=600 min) growth in IPS (left) and alternating stress (AS) (right) conditions. Fluorescence and bright-field images were merged to visualize nuclei marked with HTB2-mCherry. White arrows indicate nuclei of representative dead cells. Scale bars represent 10 µm. (c, d) Death rates (c) and population growth rates (d) of the reference strain and seven deletion mutants under IPS and AS conditions. Population growth rates were calculated as the difference between division rates (Figure 4b) and death rates (c). Bars show mean rates measured in different growth chambers. Error bars are 95% confidence intervals of the mean. Red symbols show the average rate for each field of view. Results of t-tests comparing the wild-type and mutant strains under the same conditions are indicated above each bar; results comparing the same strain under different conditions are shown above each pair of bars (ns p>0.05; *0.01<p<0.05; **0.001<p<0.01; ***p<0.001). The initial number of cells analyzed among replicates ranged from 97 to 467 in (c, d). (a–d) Cells were grown under fluctuations of 2% glucose and 1 M sorbitol at a period of 24 min.
-
Figure 5—source data 1
Source data for Figure 5.
- https://cdn.elifesciences.org/articles/88750/elife-88750-fig5-data1-v1.zip
Figure 5—figure supplement 1
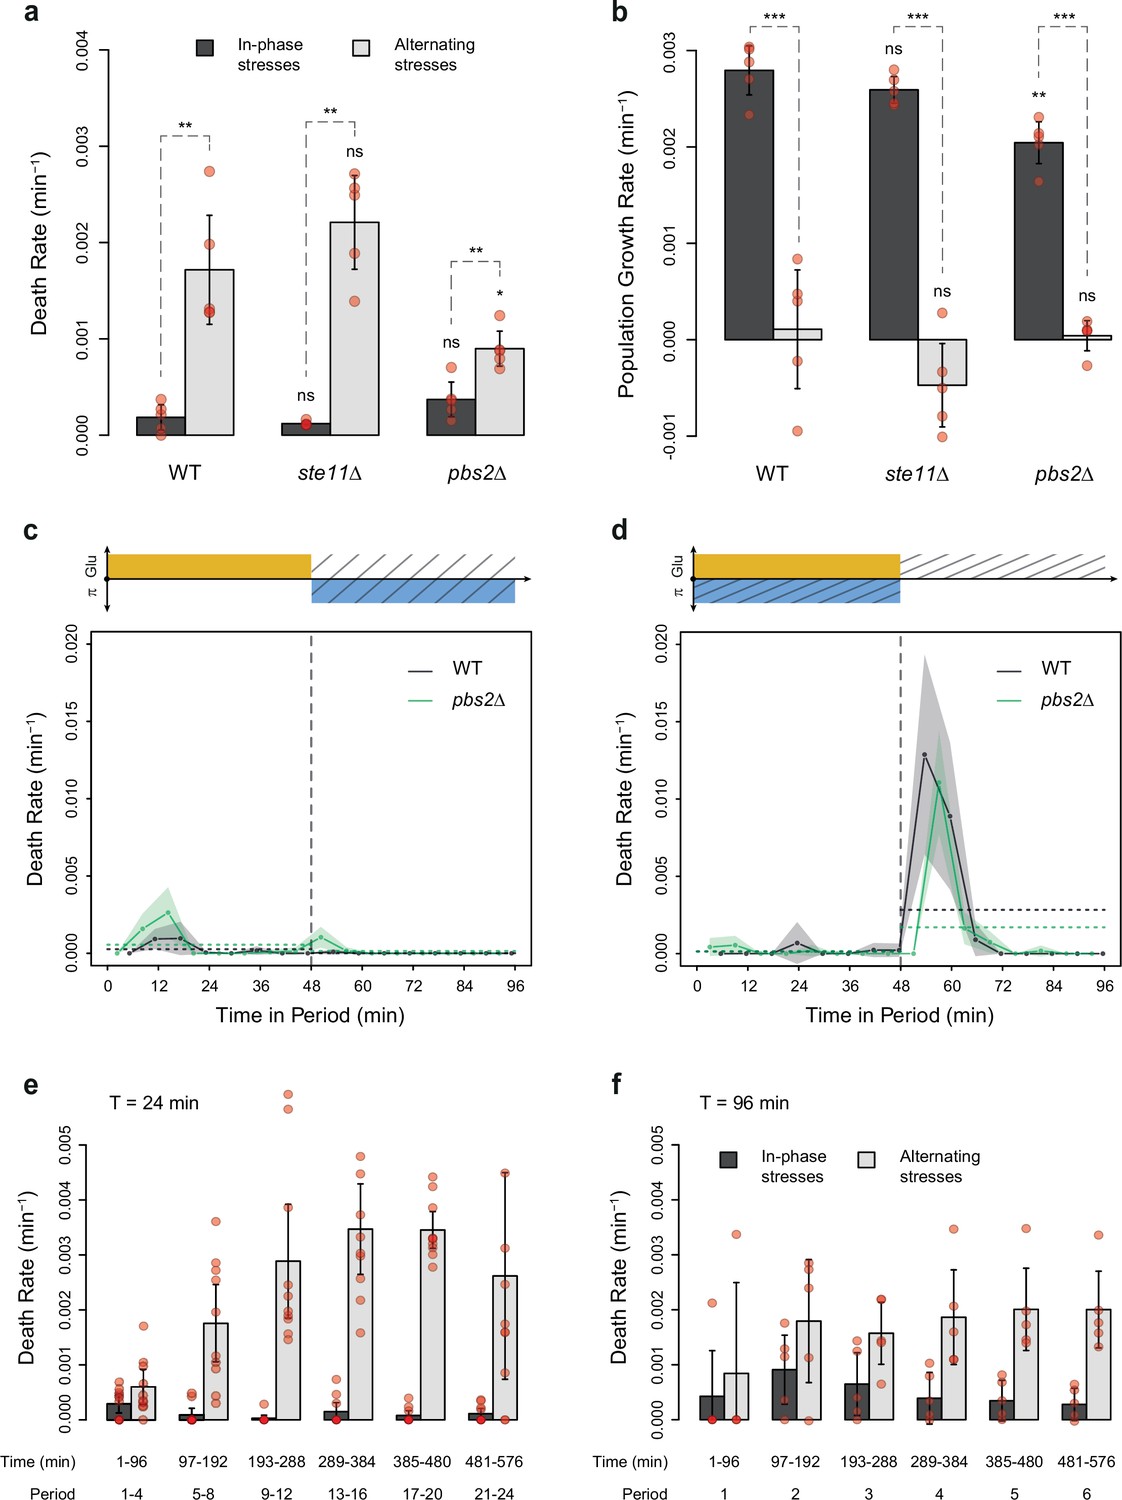
Dynamics of cell death and population growth rates under combined stresses and alternating stresses (AS).
(a) Death rates and (b) population growth rates (calculated as the difference between the division rate and death rate) in in-phase stress (IPS) (dark gray) and AS (light gray) conditions with a period of 96 min and 2% glucose. (a, b) Bars show the mean values measured among different growth chambers sharing the same environmental condition. Error bars are 95% confidence intervals of the mean. Red symbols show the average death rate or population growth rate for each growth chamber. Results of t-tests comparing the wild-type and mutant strains under the same conditions are indicated above each bar; results comparing the same strain under different conditions are shown above each pair of bars (ns, p>0.05; **0.001<p<0.01; ***p<0.001). (c, d) Temporal dynamics of death rate averaged across all 96 min periods of growth in (c) IPS and (d) AS conditions for wild-type (black) and pbs2Δ mutant (green) cells. Each dot shows the death rate during a window of 6 min centered on that dot and averaged across all fields of view sharing the same conditions and among all periods in the experiment (average of 18 to 30 measurements per dot). Gray and green areas are 95% confidence intervals of the mean division rate. Horizontal dotted lines show the mean death rate among all data collected in each half-period (i.e. in each medium since the medium is changed at the start and the middle of each period [vertical dotted line]). Colored graphs are used to represent the periodic fluctuations of glucose (orange) and/or sorbitol (blue) in the medium; hatching represents stress. (e, f) Average death rates measured at six intervals of time in IPS (dark gray) and AS (light gray) conditions at a period of (e) 24 min or (f) 96 min. Bars show the mean death rate measured in different growth chambers sharing the same conditions. Error bars are 95% confidence intervals of the mean. Red symbols show the average death rate for each field of view and time interval.
-
Figure 5—figure supplement 1—source data 1
Source data for Figure 5—figure supplement 1.
- https://cdn.elifesciences.org/articles/88750/elife-88750-fig5-figsupp1-data1-v1.zip
Figure 5—figure supplement 2
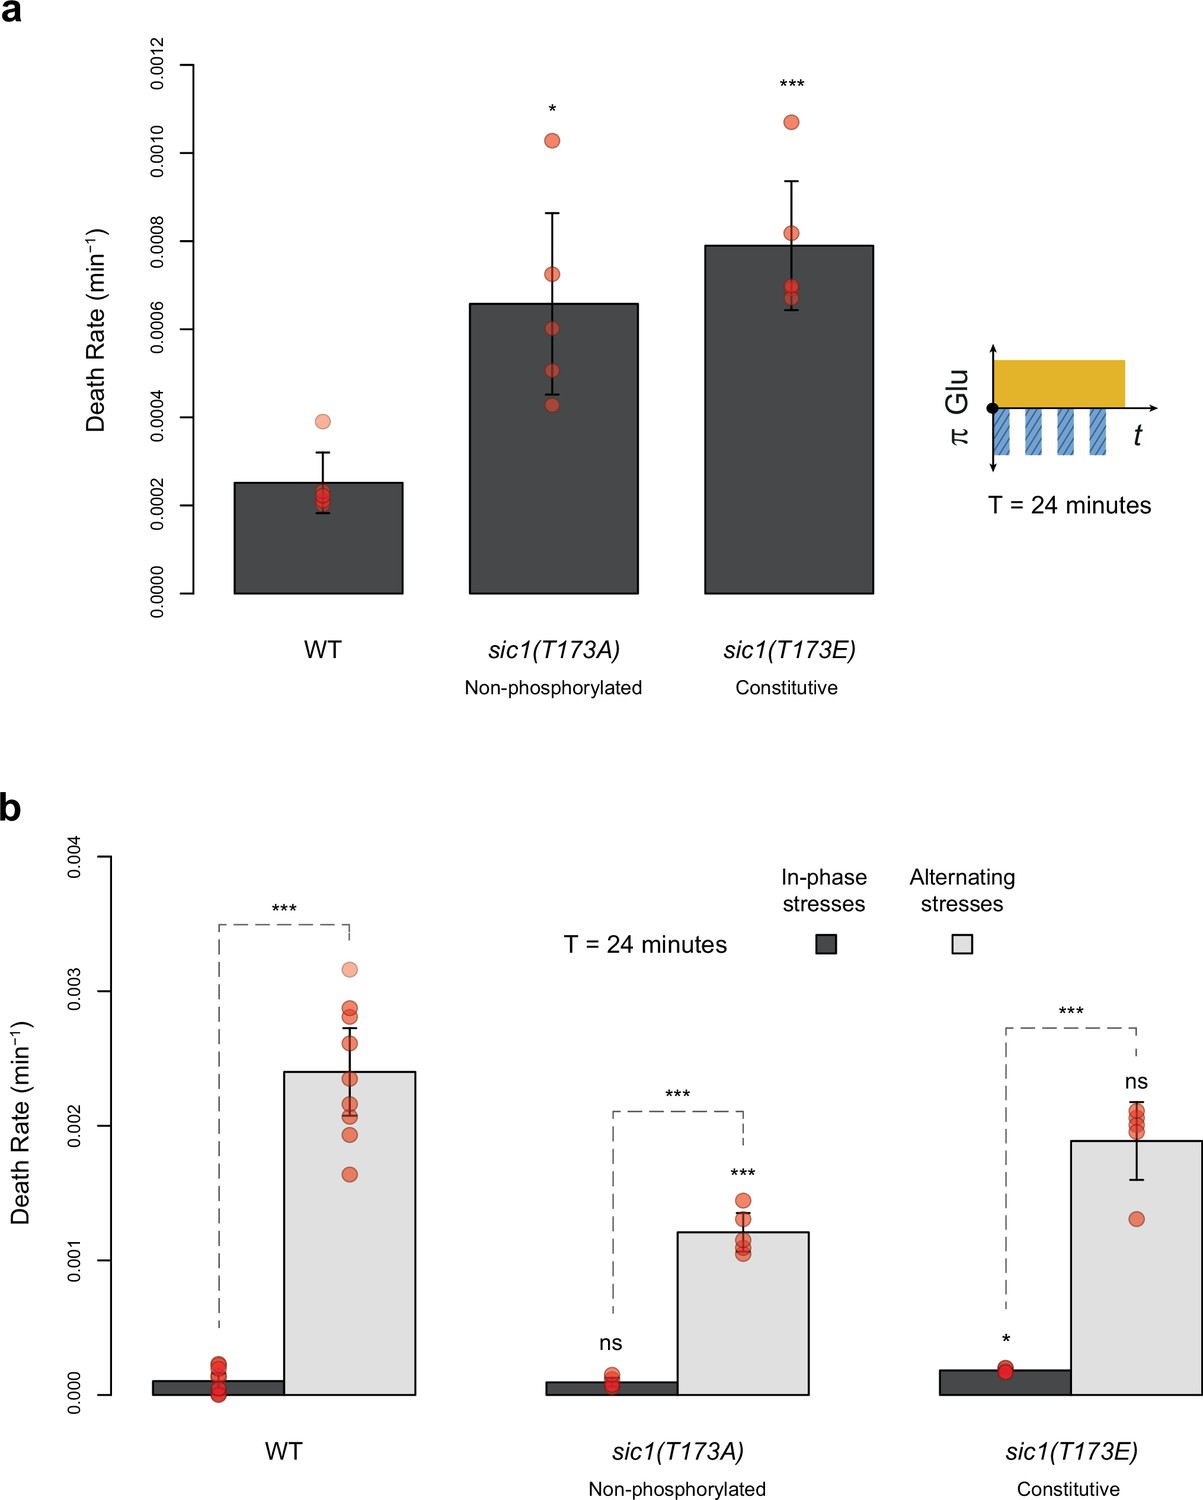
Death rates of wild-type and sic1 mutant cells under periodic fluctuations of hyperosmotic stress with or without fluctuations of glucose availability.
(a) Death rates in constant 2% glucose with repeated addition and removal of 1 M sorbitol at a period of 24 min. (b) Death rates in in-phase stress (IPS) (dark gray) and alternating stress (AS) (light gray) conditions with a period of 24 min and 2% glucose. (a, b) Bars show the mean death rates measured among different growth chambers sharing the same environmental condition. Error bars are 95% confidence intervals of the mean. Red symbols show the average death rate for each growth chamber. Results of t-tests comparing the wild-type and mutant strains under the same conditions are indicated above bars (ns, p>0.05; *0.01<p<0.05; **0.001<p<0.01; ***p<0.001). The initial number of cells analyzed among replicates ranged from 14 to 120.
-
Figure 5—figure supplement 2—source data 1
Source data for Figure 5—figure supplement 2.
- https://cdn.elifesciences.org/articles/88750/elife-88750-fig5-figsupp2-data1-v1.zip
Figure 6 with 1 supplement
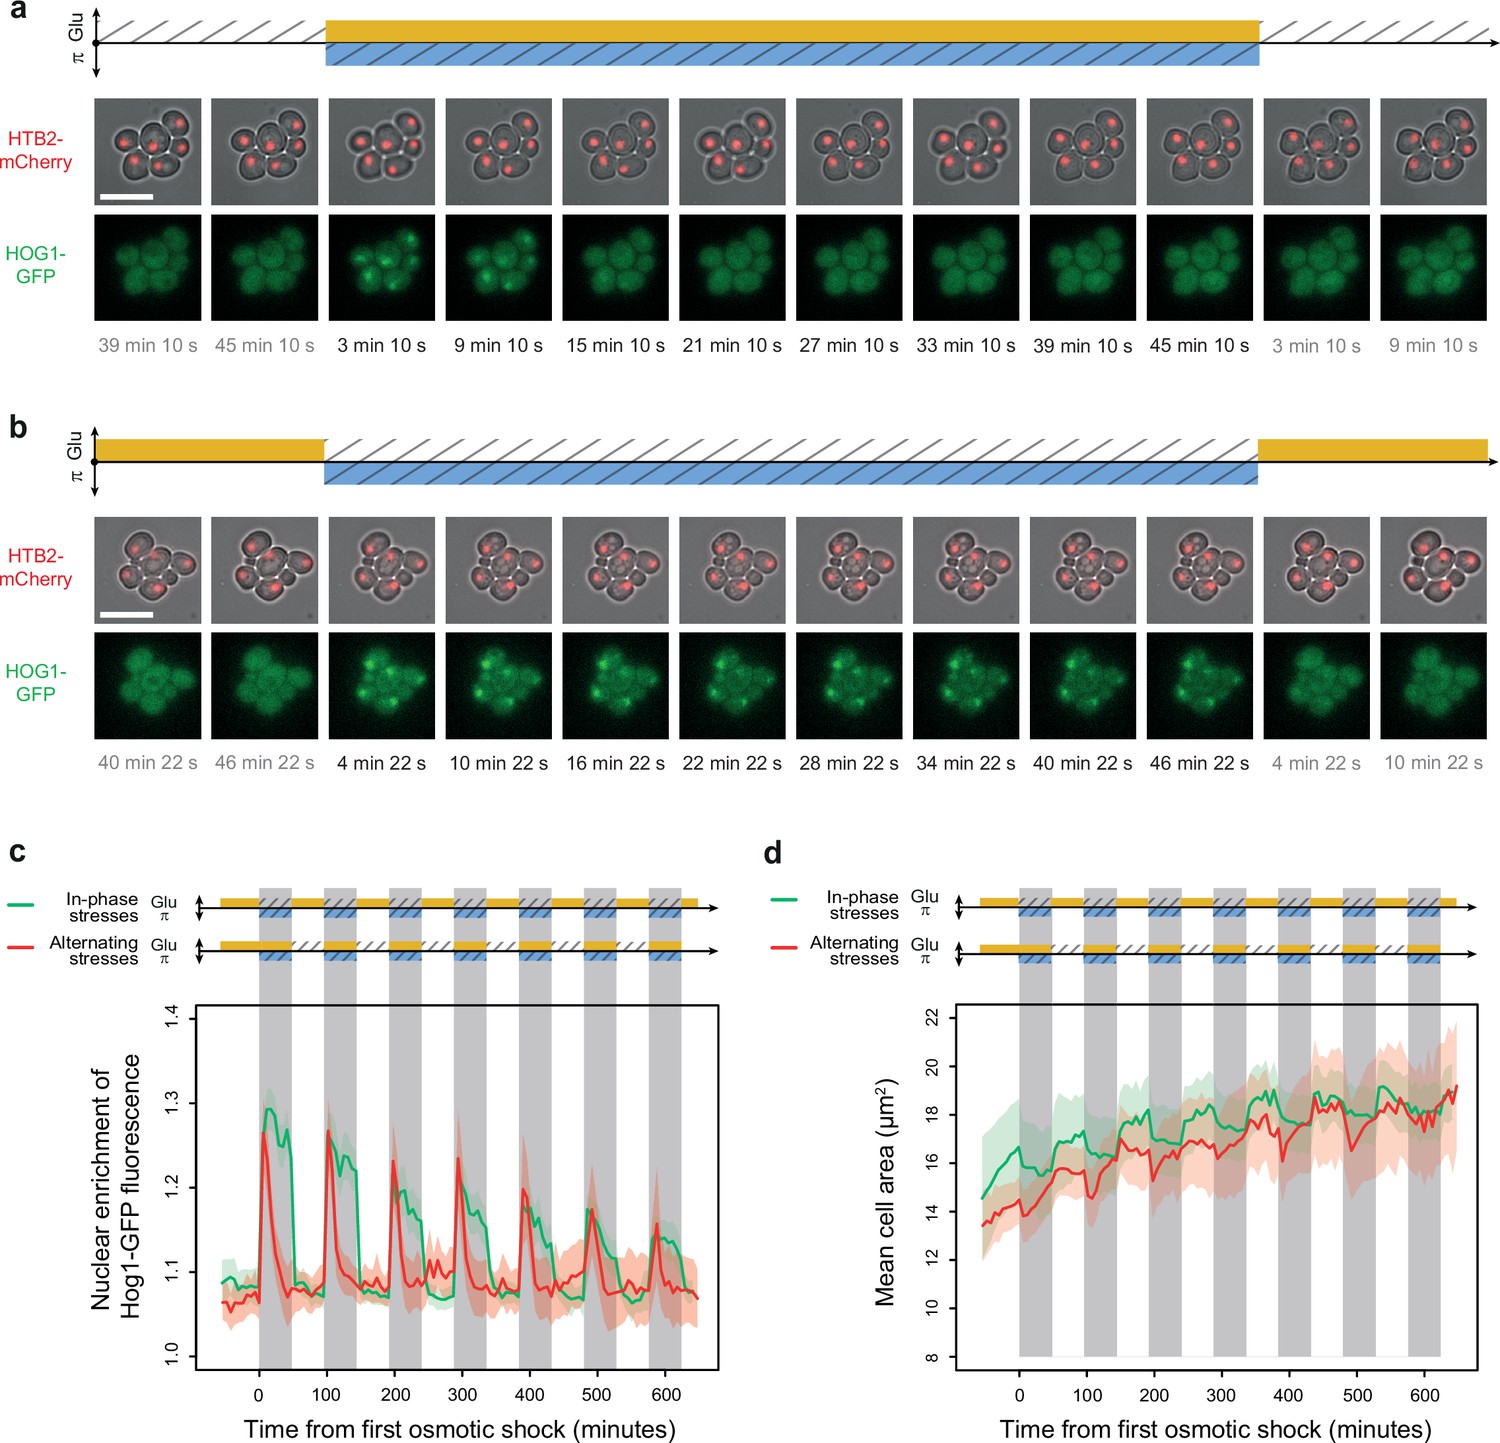
Osmoregulation is delayed after hyperosmotic stress under in-phase stresses (IPS) but not under alternating stresses (AS).
(a, b) Time-lapse images of cells expressing Htb2-mCherry and Hog1-GFP under AS (a) and IPS conditions (b) for periods of 96 min, showing cellular localization of Hog1p during the second osmotic shock in each experiment. Top: fluorescence and bright-field images merged to visualize cell nuclei tagged with histone HTB2-mCherry. Bottom: fluorescence images showing Hog1-GFP localization. The time since the last environmental change is indicated below each image. Scale bars represent 10 µm. (c) Temporal dynamics of the enrichment of Hog1-GFP fluorescence in cell nuclei under IPS (red curve) and AS (green curve) conditions. Colored areas indicate 95% confidence intervals. (d) Temporal dynamics of cell size (area) in IPS (green) and AS (red) conditions for the same cells as in panel (c). Each curve shows the mean area measured among cells. Colored areas indicate 95% confidence intervals of the mean. (c, d) Each curve shows the mean nuclear enrichment or mean cell size for 11–25 cells in one or two fields of view. The colored graphs represent the periodic fluctuations of glucose (orange) and/or sorbitol (blue); hatching represents stress; gray indicates exposure to 1 M sorbitol. (a–d) Cells were grown under fluctuations of 2% glucose and 1 M sorbitol at a period of 96 min.
-
Figure 6—source data 1
Source data for Figure 6.
- https://cdn.elifesciences.org/articles/88750/elife-88750-fig6-data1-v1.zip
Figure 6—figure supplement 1
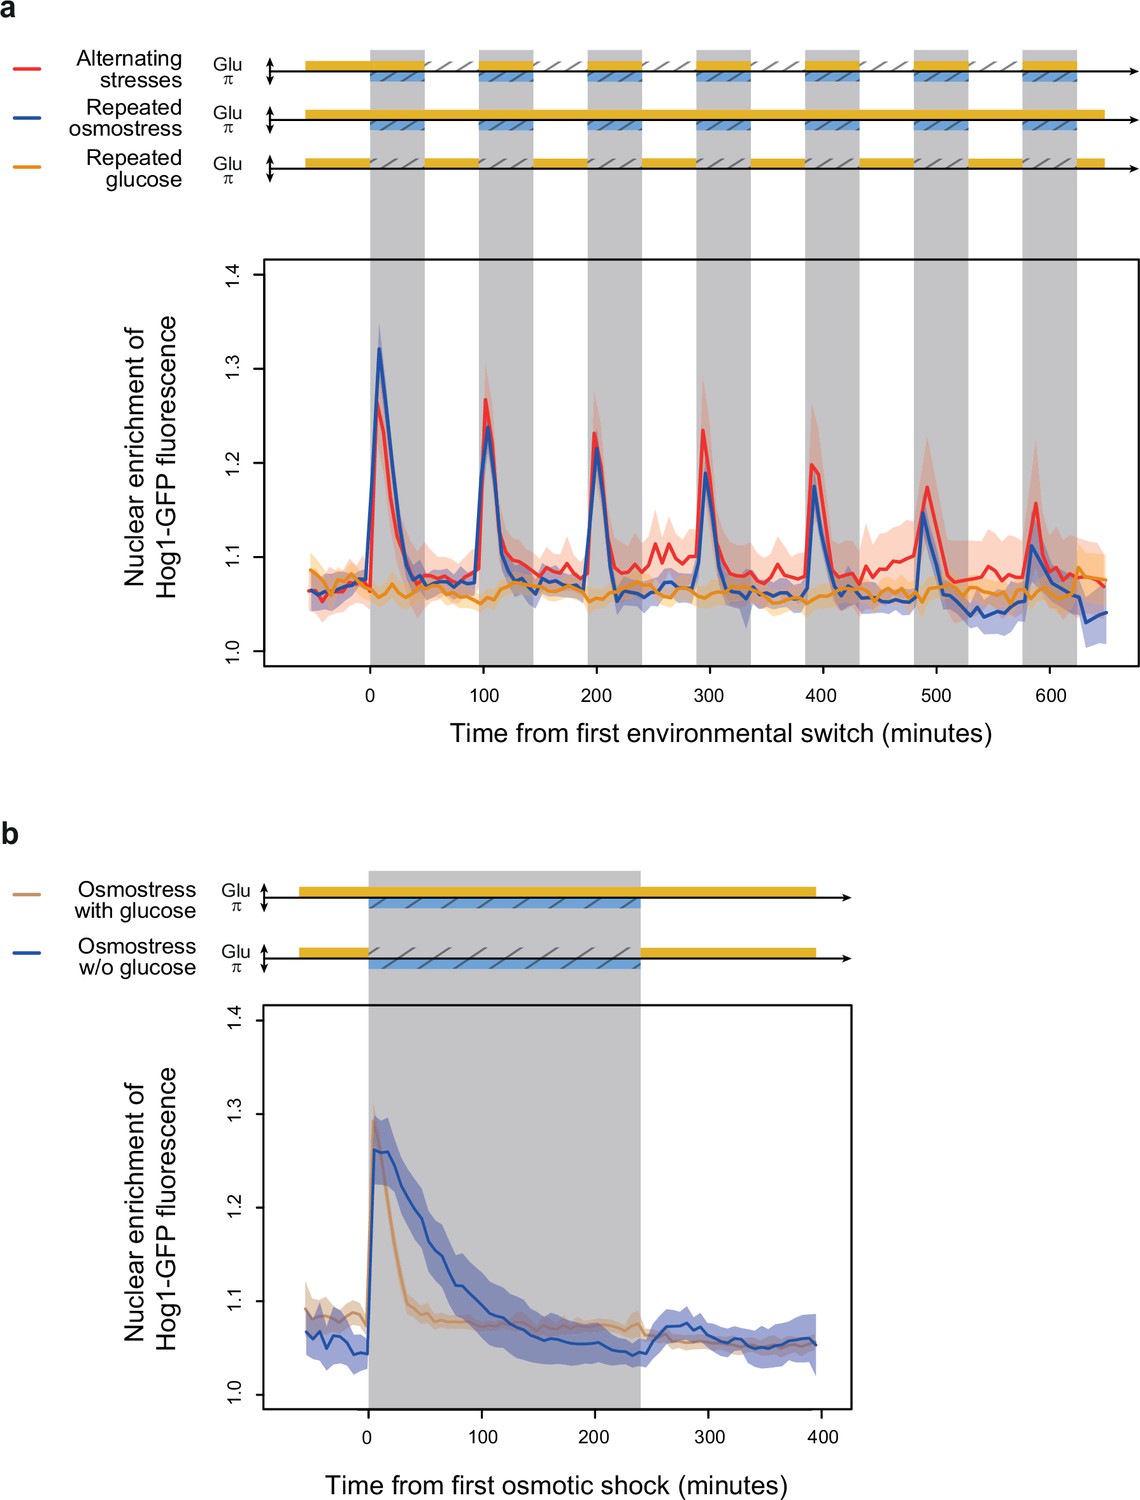
Temporal dynamics of Hog1-GFP location under different regimes of environmental fluctuations.
(a, b) Nuclear enrichment of Hog1-GFP fluorescence over time under (a) alternating stresses (red), periodic osmotic stress in constant glucose (blue), and periodic glucose fluctuations in absence of osmotic stress or (b) a single osmotic shock in presence (brown) or absence (blue) of 2% glucose. Each curve shows the mean nuclear enrichment of GFP fluorescence measured for 11‒97 cells from one to seven fields of view. Colored areas indicate 95% confidence intervals of the mean. The colored graphs represent the periodic fluctuations of 2% glucose (orange) and/or 1 M sorbitol (blue) in the medium; hatching represents stress.
-
Figure 6—figure supplement 1—source data 1
Source data for Figure 6—figure supplement 1.
- https://cdn.elifesciences.org/articles/88750/elife-88750-fig6-figsupp1-data1-v1.zip
Figure 7
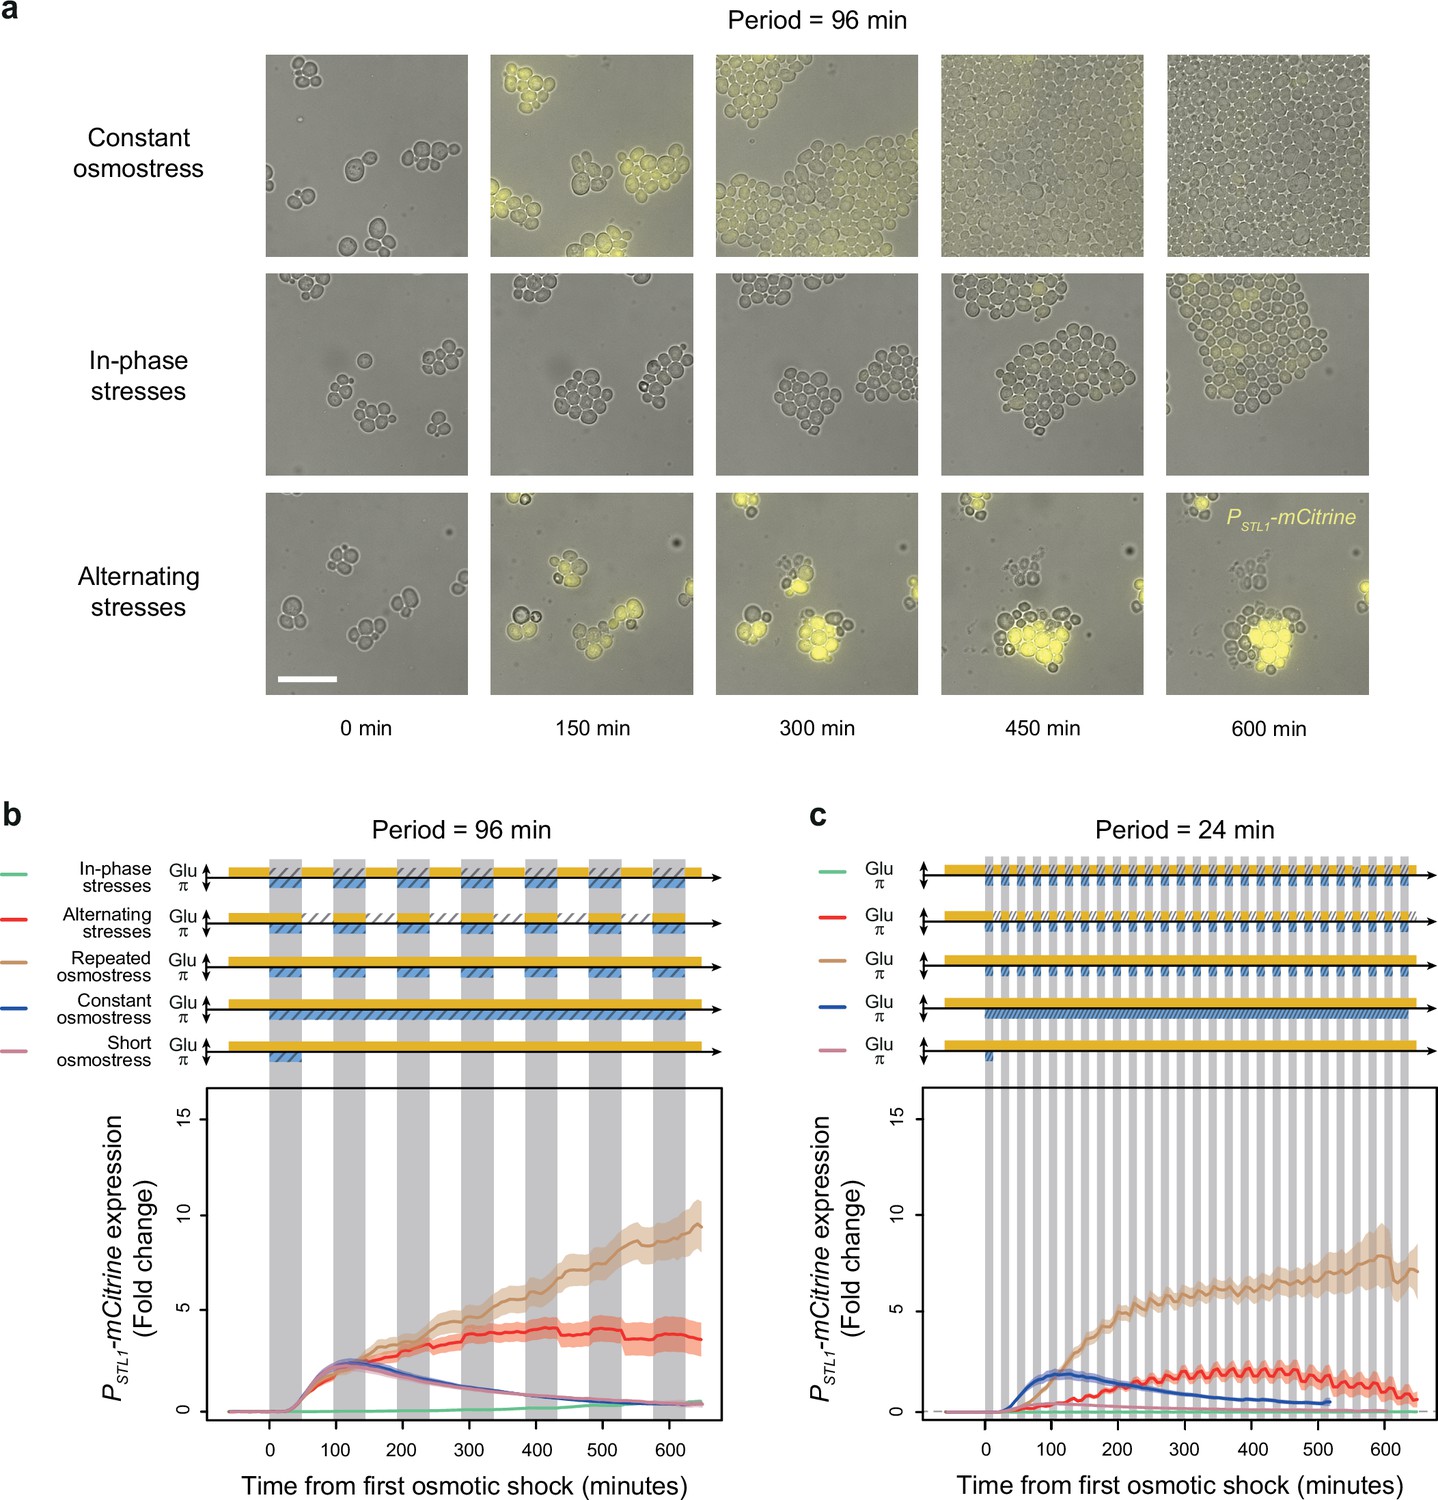
A transcriptional target of the HOG pathway is under-expressed during in-phase stresses (IPS) and over-expressed during alternating stresses (AS).
(a) Images of cells expressing a fluorescent reporter (mCitrine) under control of the STL1 promoter known to be regulated by the HOG pathway. Rows correspond to different conditions (as indicated on the left) and columns correspond to different time points after transitioning from complete medium to each condition. Bright-field and fluorescence images are overlaid. Scale bar represents 20 µm. (b, c) Temporal dynamics of PSTL1-mCitrine expression in five conditions: IPS (green curves), AS (red curve), periodic osmotic stress with constant glucose (brown curve), a single transition to constant osmotic stress with glucose for 10 hr (blue curve), and a short pulse of osmotic stress with constant glucose (purple curve). The fluctuation period is 96 min in (b) and 24 min in (c) for the first three conditions. 2% Glucose was used in all conditions. Each curve shows the mean fold change of fluorescence intensity measured for 30–65 cells from four or five fields of view. Colored areas indicate 95% confidence intervals of the mean. The colored graphs represent the periodic fluctuations of glucose (orange) and/or sorbitol (blue); hatching represents stress; gray indicates exposure to 1 M sorbitol.
-
Figure 7—source data 1
Source data for Figure 7.
- https://cdn.elifesciences.org/articles/88750/elife-88750-fig7-data1-v1.zip
Tables
Table 1
Genotype of yeast strains used in this study.
| Name | Genotype | Mating type | Background | Reference or source |
|---|---|---|---|---|
| yPH_132 | HTB2::HTB2-mCherry_pTEF-KanMX4-tTEF his3Δ1 leu2Δ0 met15Δ0 ura3Δ0 | a | BY4741 | This work |
| yPH_015 | HTB2::mCherry-Ura3 HOG1-GFP | a | BY4741 | Our team |
| yPH_091 | pSTL1::yECITRINE-HIS5 his3Δ1 leu2Δ0 lys2Δ0 ura3Δ0 Hog1::mCherry-hph | alpha | BY4742 | Uhlendorf et al., 2012 https://doi.org/10.1073/pnas.1206810109 |
| yPH_051 | pGPD1::YFP | a | BY4741 | Gift from Megan McClean |
| yPH_403 | HTB2::HTB2-mCherry_pTEF-KanMX4-tTEF pbs2Δ his3Δ1 leu2Δ0 met15Δ0 ura3Δ0 | a | yPH_132 | This work |
| yPH_405 | HTB2::HTB2-mCherry_pTEF-KanMX4-tTEF fps1Δ his3Δ1 leu2Δ0 met15Δ0 ura3Δ0 | a | yPH_132 | This work |
| yPH_412 | HTB2::HTB2-mCherry_pTEF-KanMX4-tTEF gpd1Δ his3Δ1 leu2Δ0 met15Δ0 ura3Δ0 | a | yPH_132 | This work |
| yPH_414 | HTB2::HTB2-mCherry_pTEF-KanMX4-tTEF gpd2Δ his3Δ1 leu2Δ0 met15Δ0 ura3Δ0 | a | yPH_132 | This work |
| yPH_421 | HTB2::HTB2-mCherry_pTEF-KanMX4-tTEF gpd1Δ gpd2Δ his3Δ1 leu2Δ0 met15Δ0 ura3Δ0 | a | yPH_132 | This work |
| yPH_441 | HTB2::HTB2-mCherry_pTEF-KanMX4-tTEF hog1Δ his3Δ1 leu2Δ0 met15Δ0 ura3Δ0 | a | yPH_132 | This work |
| yPH_445 | HTB2::HTB2-mCherry_pTEF-KanMX4-tTEF ste11Δ his3Δ1 leu2Δ0 met15Δ0 ura3Δ0 | a | yPH_132 | This work |
| yPH_452 | HTB2::HTB2-mCherry_pTEF-KanMX4-tTEF glc3Δ his3Δ1 leu2Δ0 met15Δ0 ura3Δ0 | a | yPH_132 | This work |
| yPH_482 | HTB2::HTB2-mCherry_pTEF-KanMX4-tTEF sic1(T173A) his3Δ1 leu2Δ0 met15Δ0 ura3Δ0 | a | yPH_132 | This work |
| yPH_486 | HTB2::HTB2-mCherry_pTEF-KanMX4-tTEF sic1(T173E) his3Δ1 leu2Δ0 met15Δ0 ura3Δ0 | a | yPH_132 | This work |
Table 2
Oligonucleotides used to generate gene deletions and point mutations.
| Strain | Primer name | Sequence |
|---|---|---|
| pbs2Δ (yPH_403) | sgRNA_PBS2_F | GATCAATCAAAGCGAGCAAGACAAGTTTTAGAGCTAG |
| sgRNA_PBS2_R | CTAGCTCTAAAACTTGTCTTGCTCGCTTTGATT | |
| Deletion_PBS2_F | CGTCATACAACTAAAACTGATAAAGTACCCGTTTTTCCGTACATTTCTATAGATACATTATTATATTAAGCAGATCGAGACGTTAATTTC | |
| Deletion_PBS2_R | GTAGCTTTTCGTCTGCTTTTTTTTTGTTGTTATATTCACGTGCCTGTTTGCTTTTATTTGGATATTAACGGAAATTAACGTCTCGATCTG | |
| Seq_PBS2_F | GCTTACCTGCTTGCCGGAAG | |
| Seq_PBS2_R | CTATAACGAGTATAATGCAAG | |
| gpd1Δ (yPH_412) (yPH_421) | sgRNA_GPD1_F | GATCTCTGCTGCCATCCAAAGAGTGTTTTAGAGCTAG |
| sgRNA_GPD1_R | CTAGCTCTAAAACACTCTTTGGATGGCAGCAGA | |
| Deletion_GPD1_F | TATACTACCATGAGTGAAACTGTTACGTTACCTTAAATTCTTTCTCCCTTTAATTTTCTTTTATCTTACTCTCCTACATAAGACATCAAG | |
| Deletion_GPD1_R | ATGAATATGATATAGAAGAGCCTCGAAAAAAGTGGGGGAAAGTATGATATGTTATCTTTCTCCAATAAATCTTGATGTCTTATGTAGGAG | |
| Seq_GPD1_F | GCACAACAAGTATCAGAATG | |
| Seq_GPD1_R | ATGCGGAAGAGGTGTACAGC | |
| gpd2Δ (yPH_414) (yPH_421) | sgRNA_GPD2_F | GATCGCATTGGTCCGAAACCACCGGTTTTAGAGCTAG |
| sgRNA_GPD2_R | CTAGCTCTAAAACCGGTGGTTTCGGACCAATGC | |
| Deletion_GPD2_F | TTTTTTTTTATATATTAATTTTTAAGTTTATGTATTTTGGTAGATTCAATTCTCTTTCCCTTTCCTTTTCCTTCGCTCCCCTTCCTTATC | |
| Deletion_GPD2_R | ATAATGATAAATTGGTTGGGGGAAAAAGAGGCAACAGGAAAGATCAGAGGGGGAGGGGGGGGGAGAGTGTGATAAGGAAGGGGAGCGAAG | |
| Seq_GPD2_F | CAGCTCTTCTCTACCCTGTC | |
| Seq_GPD2_R | GGTGATGTGATATGTAAACG | |
| fps1Δ (yPH_405) | sgRNA_FPS1_F | GATCACAGCAGGACAATTTCAACGGTTTTAGAGCTAG |
| sgRNA_FPS1_R | CTAGCTCTAAAACCGTTGAAATTGTCCTGCTGT | |
| Deletion_FPS1_F | ATCAACAAAGTATAACGCCTATTGTCCCAATAAGCGTCGGTTGTTCTTCTTTATTATTTTACCAAGTACGCTCGAGGGTACATTCTAATG | |
| Deletion_FPS1_R | TACCGGCGGTAGTAAGCAGTATTTTTTTCTATCAGTCTATATTATTTGTTTCTTTTTCTTGTCTGTTTTCCATTAGAATGTACCCTCGAG | |
| Seq_FPS1_F | CAGTGTGAATCCGGAGACGG | |
| Seq_FPS1_R | TACTTAAGACGATGGGTCAG | |
| hog1Δ (yPH_441) | sgRNA_HOG1_F | GATCGGCTCCTTACCACGATCCAAGTTTTAGAGCTAG |
| sgRNA_HOG1_R | CTAGCTCTAAAACTTGGATCGTGGTAAGGAGCC | |
| Deletion_HOG1_F | TGGTAAATACTAGACTCGAAAAAAAGGAACAAAGGGAAAACAGGGAAAACTACAACTATCGTATATAATAGTCCCTAACCACTCATTCTT | |
| Deletion_HOG1_R | TTCCTCTATACAACTATATACGTAAATACTTTTATGAGTACCATAAAAAAAAGAAACATCAAAAAGAAGTAAGAATGAGTGGTTAGGGAC | |
| Seq_HOG1_F | TAGTGGAAGAGGAATTTGCG | |
| Seq_HOG1_R | GCCATAAGTGACGGTTCTTG | |
| ste11Δ (yPH_445) | sgRNA_STE11_F | GATCTATGGTGCTTCTCAAGAAGGGTTTTAGAGCTAG |
| sgRNA_STE11_R | CTAGCTCTAAAACCCTTCTTGAGAAGCACCATA | |
| Deletion_STE11_F | CAGTAGAAAATATTCATATTTACACACATGCATAAAGAGAGACCACTTAATAAAGCTAGTATGATAAGATCACCGGTAGACGAAATATAC | |
| Deletion_STE11_R | ATGTATTATTTGATAAAAAATCGGCCAGAGCACTTTAGTGCCATAAAAAGAATTAATAAGTAGCCCTTTTGTATATTTCGTCTACCGGTG | |
| Seq_STE11_F | TTCTTTATGCTGTCCTCACC | |
| Seq_STE11_R | GAGAATCAAATACCGTCATC | |
| glc3Δ (yPH_452) | sgRNA_GLC3_F | GATCTTTCGACTACAGATTAGCAAGTTTTAGAGCTAG |
| sgRNA_GLC3_R | CTAGCTCTAAAACTTGCTAATCTGTAGTCGAAA | |
| Deletion_GLC3_F | TCCTACATTTTTTTTCCCTGATAACTTCCTGTTACTATTTAAGAACACCAAACCAAGTATAAAGAACCGTCAAGAATAAAACTCTATACT | |
| Deltetion_GLC3_R | GTACGTTTAGATATCTACCAATACATGAAGAGAAAAAAATTATTGAGTCTTGATTTTCAGTAAGCAATATAGTATAGAGTTTTATTCTTG | |
| Seq_GLC3_F | TCGAGCCAAGTGACACCAGC | |
| Seq_GLC3_R | GACAGCTCTGCTATTCGCCC | |
| Sic1 (yPH_482 T173A) (yPH_486 T173E) | sgRNA_SIC1_F | GATCACCTGGTACGCCCAGCGACAGTTTTAGAGCTAG |
| sgRNA_SIC1_R | CTAGCTCTAAAACTGTCGCTGGGCGTACCAGGT | |
| Repair_SIC1_T173A_F | ACATTTATCACTTGAAAGAGATGAGTTTGATCAGACACATAGAAAGAAGATTATTAAAGATGTACCTGGTGCGCCCAGCGACAAAGTGAT | |
| Repair_SIC1_T173A_R | TTCACTTTCTTGACTCCTGGCGTCATTTTTCGGAGAGTTGTTGTTCCAATTTTTTGCCAATTCAAATGTTATCACTTTGTCGCTGGGCGC | |
| Repair_SIC1_T173E_F | ACATTTATCACTTGAAAGAGATGAGTTTGATCAGACACATAGAAAGAAGATTATTAAAGATGTACCTGGTGAGCCCAGCGACAAAGTGAT | |
| Repair_SIC1_T173E_R | TTCACTTTCTTGACTCCTGGCGTCATTTTTCGGAGAGTTGTTGTTCCAATTTTTTGCCAATTCAAATGTTATCACTTTGTCGCTGGGCTC | |
| Seq_SIC1_F | CATTGGGTCGTGTAAATAGG | |
| Seq_SIC1_R | CTGAGTGACCAGTTCATCTG |
Additional files
Download links
A two-part list of links to download the article, or parts of the article, in various formats.
Downloads (link to download the article as PDF)
Open citations (links to open the citations from this article in various online reference manager services)
Cite this article (links to download the citations from this article in formats compatible with various reference manager tools)
Yeast cell responses and survival during periodic osmotic stress are controlled by glucose availability
eLife 12:RP88750.
https://doi.org/10.7554/eLife.88750.3


