Highly sensitive in vivo detection of dynamic changes in enkephalins following acute stress in mice
- Department of Anesthesiology, Washington University in St. Louis, United States
- Washington University Pain Center, Washington University in St. Louis, United States
- Center for Clinical Pharmacology, University of Health Science and Pharmacy, United States
- Department of Medicine, Washington University School of Medicine, Washington University in St. Louis, United States
Figures
Figure 1 with 1 supplement
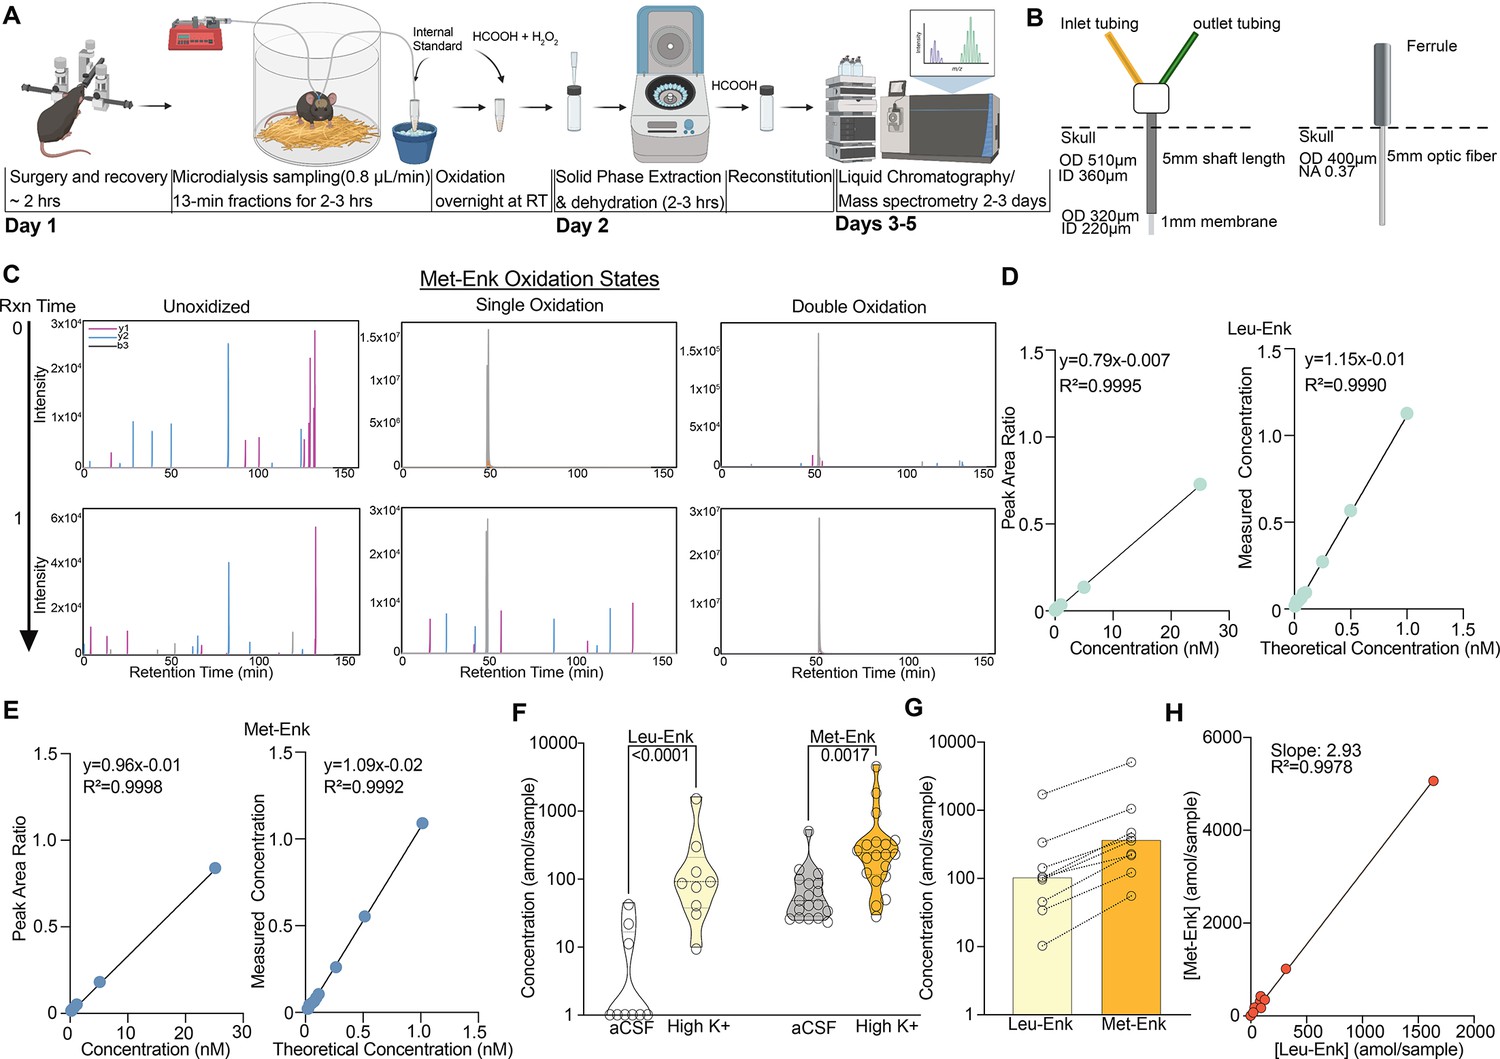
An optimized approach for in vivo Met- and Leu-enkephalin (Met- and Leu-Enk) measurement.
(A) Timeline of in vivo sample collection on day 1 and methionine oxidation reaction overnight, sample processing on day 2, and data acquisition on the liquid chromatography/mass spectrometry (LC-MS), days 3–5. The microdialysis probe is implanted via stereotaxic surgery in the nucleus accumbens shell. The mouse is allowed to recover before being connected to the microdialysis lines. Samples are then collected at a rate of 0.8 μL/min for 13 min each. After collection is completed, the samples are oxidized overnight. On day 2, the samples undergo solid-phase extraction (SPE) and are then dehydrated and reconstituted using formic acid (HCOOH) before being acquired on the LC-MS. Panel A created with BioRender.com. (B) Custom microdialysis probe specifications including membrane size and inner and outer diameters (ID and OD, respectively) compared to fiber photometry probe specifications including OD of optic fiber and numerical aperture (NA). (C) Before the methionine oxidation at reaction (Rxn) time 0, Met-Enk exists in three different forms with varying intensities, unoxidized (multi-peak), singly oxidized (multi-peak), and doubly oxidized (single peak). After the reaction completes (Rxn time 1), most of the detected signal is in the doubly oxidized form and shows a single peak (>99% signal intensity). Y1, y2, b3 refer to the different elution fragments resulting from Met-Enk during LC-MS. (D) (Left) Forward calibration curve of Leu-Enk and Met-Enk showing the peak area ratios as the light standard levels are varied. (Right) Reverse calibration curve of Leu-Enk showing the relationship between the heavy standard concentration applied and the measured concentration based on the instrument. (E) Same setup as (D) but for Met-Enk. (F) Violin plots showing that high K+ Ringer’s solution increases the release of both Leu-Enk and Met-Enk compared to baseline levels in artificial cerebrospinal fluid (aCSF) (Leu-Enk n=9, Met-Enk n=18). The dashed center line indicates the median. (G) The evoked concentrations of Met-Enk to Leu-Enk in the same samples show that Met-Enk is consistently released at a higher level than Leu-Enk (n=9). (H) Met-Enk is released at a factor of 2.97 that of Leu-Enk as shown by linear regression analysis of the data in (f), suggesting a linear relationship between the two peptides. Data in (F-H) are transformed to a log scale. In (F), two-way ANOVA shows a main effect of peptide (F(1, 51)=32.30, p<0.0001), solution (F(1, 51)=50.04, p<0.0001), and interaction (F(1, 51)=9.119, p=0.0039). The p-values reported were calculated using a Šídák’s multiple comparisons test. Mean difference between baseline Leu-Enk and high K+ 1.533, mean difference between baseline Met-Enk and high K+ 0.6157, 95% confidence interval 0.3074–1.527 (log10 values).
-
Figure 1—source data 1
Raw data for Figure 1.
- https://cdn.elifesciences.org/articles/91609/elife-91609-fig1-data1-v1.zip
Figure 1—figure supplement 1

Technical advancements enabled using internal standards for Met- and Leu-enkephalin (Met- and Leu-Enk) detection.
(A) A representative trace of high signal-to-noise endogenous Met-Enk signal (top) compared to the isotopically labeled internal standard (bottom). (B) A representative low signal-to-noise trace of endogenous Met-Enk signal (top) compared to the isotopically labeled standard (bottom). (C) A representative high signal-to-noise trace of endogenous Leu-Enk signal (top) compared to the isotopically labeled internal standard (bottom). (D) A representative low signal-to-noise trace of endogenous Leu-Enk signal (top) compared to the isotopically labeled standard (bottom). The bolded amino acids in the sequences for Met- and Leu-Enk represent the isotopically labeled standards.
-
Figure 1—figure supplement 1—source data 1
Raw data for Figure 1—figure supplement 1.
- https://cdn.elifesciences.org/articles/91609/elife-91609-fig1-figsupp1-data1-v1.zip
Figure 2 with 1 supplement
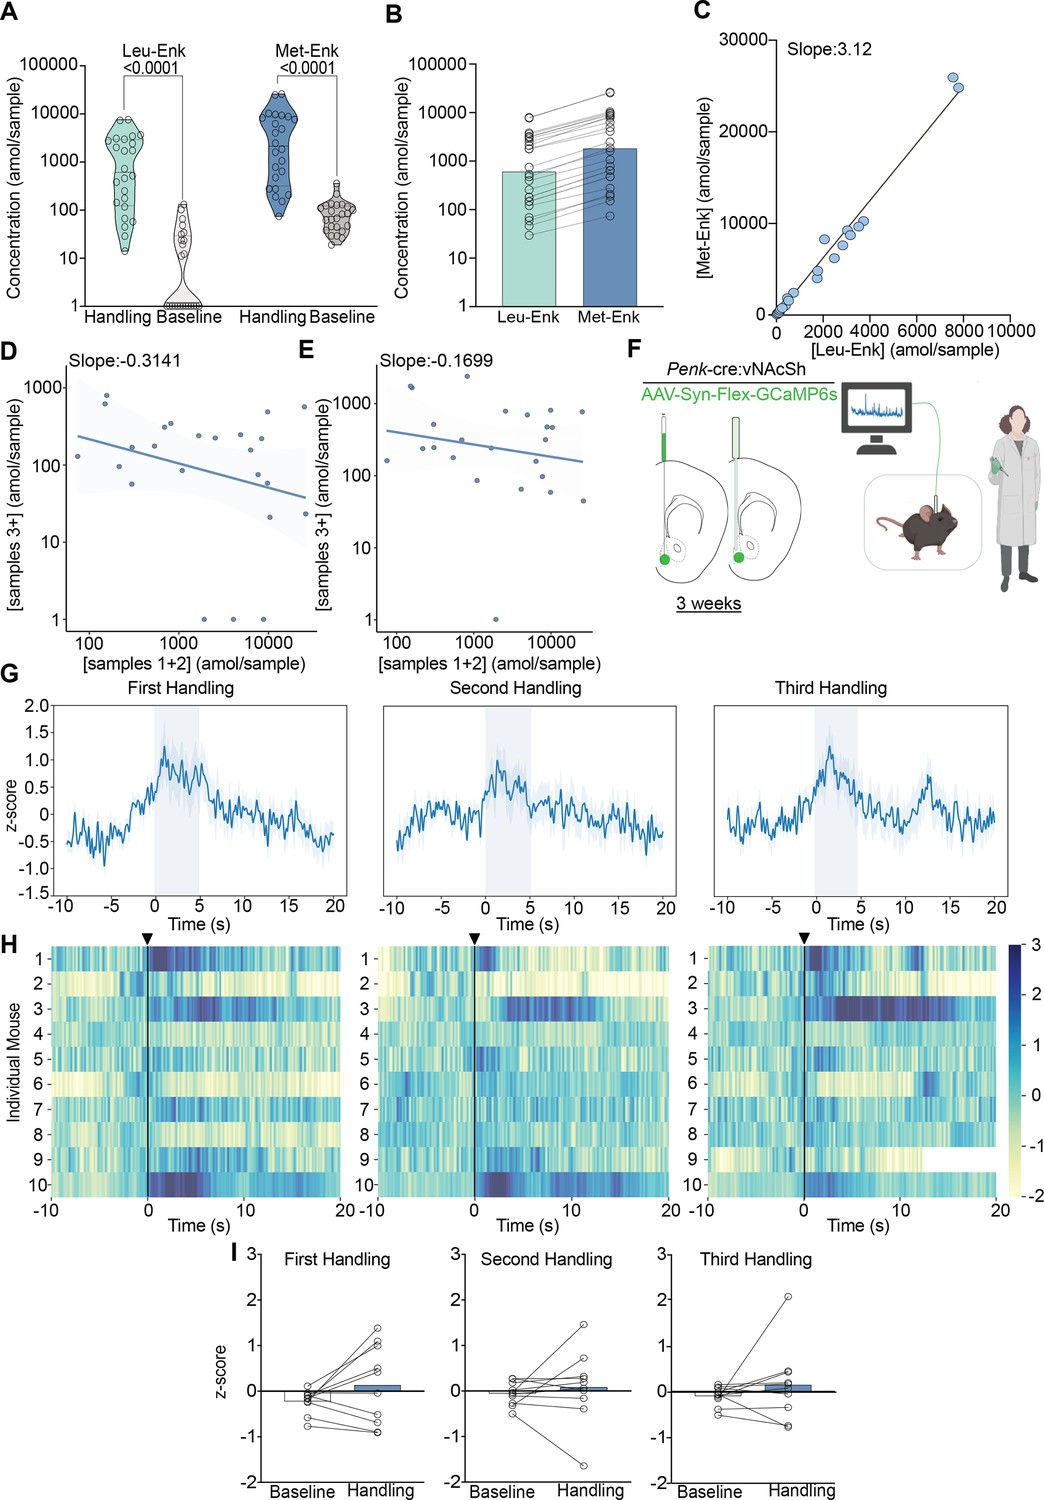
Experimenter handling evokes the release of Met- and Leu-enkephalin (Met- and Leu-Enk) in the nucleus accumbens shell (NAcSh).
(A) Experimenter handling during microdialysis causes a significant increase in the release of Leu- and Met-Enk in comparison to baseline. The two-way ANOVA on log-transformed data showing a significant effect of peptide F(1,92)=32.58, p<0.0001, handling F(1,92)=146.1, p<0.0001, and interaction F(1,92)=4.778, p=0.0314. Šídák’s multiple comparisons test was conducted, and p-values are shown on the figure. Mean difference between baseline Leu-Enk and handling 2.055, mean difference between baseline Met-Enk and handling 1.426, 95% confidence interval 0.05751–1.201 (log10 values). (B) During experimenter handling, Met-Enk is consistently released at a higher rate than Leu-Enk in the same samples. (C) Linear regression analysis of the data in (B) shows that Met-Enk is released at a rate of 3.12 times the rate of Leu-Enk during experimenter handling, suggesting a linear relationship between the two peptides. (D) A negative correlation (–0.3141) shows that if a high concentration of Met-Enk is released in the first two samples, the concentration released in later samples is affected; such influence suggests that there is regulation of the maximum amount of peptide to be released in NAcSh. (E) The negative correlation in panel (D) is reversed by using high K+ buffer with a negative correlation coefficient of –0.1699 to evoke Met-Enk release, suggesting that the limited release observed in (D) is due to modulation of peptide release rather than depletion of reserves. Data in (A–E) are transformed to a log scale, and n=24 animals. In panel (A), two-way ANOVA shows a main effect of peptide, treatment, and interaction. The p-values reported were calculated using a Šídák’s multiple comparisons test. (F) Schematic describing the viral strategy and probe placement for the fiber photometry experiment in Penk-Cre mice injected with the calcium sensor GCaMP6s in the NAcSh. Panel F created with BioRender.com. (G) Average z-score trace following the first, second, and third events involving experimenter handling. (H) Heatmaps showing individual mouse z-scored fiber photometry responses before and after experimenter handling. (I) Bar graphs showing the averaged z-score responses before experimenter handling and after experimenter handling (n = 10 for G–I).
-
Figure 2—source data 1
Raw data for Figure 2.
- https://cdn.elifesciences.org/articles/91609/elife-91609-fig2-data1-v1.zip
Figure 2—figure supplement 1

There are no significant differences between male and female responses to handling or fox odor exposure.
(A) Male and female responses to handling are comparable for both Leu- and Met-enkephalin (Leu- and Met-Enk) (n=16 males, n=8 females). The three-way ANOVA showed a significant main effect of sex (p=0.0049) and sex*treatment interaction (p=0.0107). However, after correcting for multiple comparisons, there were no differences between male and female conditions. (B) Met-Enk release is comparable between males and females as the main effect of sex in the two-way ANOVA is not significant (p=0.6821) and neither is the sex*treatment interaction (p=0.5504) (n=6 males, n=5 females). This data also supplements data as shown in Figure 3.
-
Figure 2—figure supplement 1—source data 1
Raw data for Figure 2—figure supplement 1.
- https://cdn.elifesciences.org/articles/91609/elife-91609-fig2-figsupp1-data1-v1.zip
Figure 3 with 2 supplements
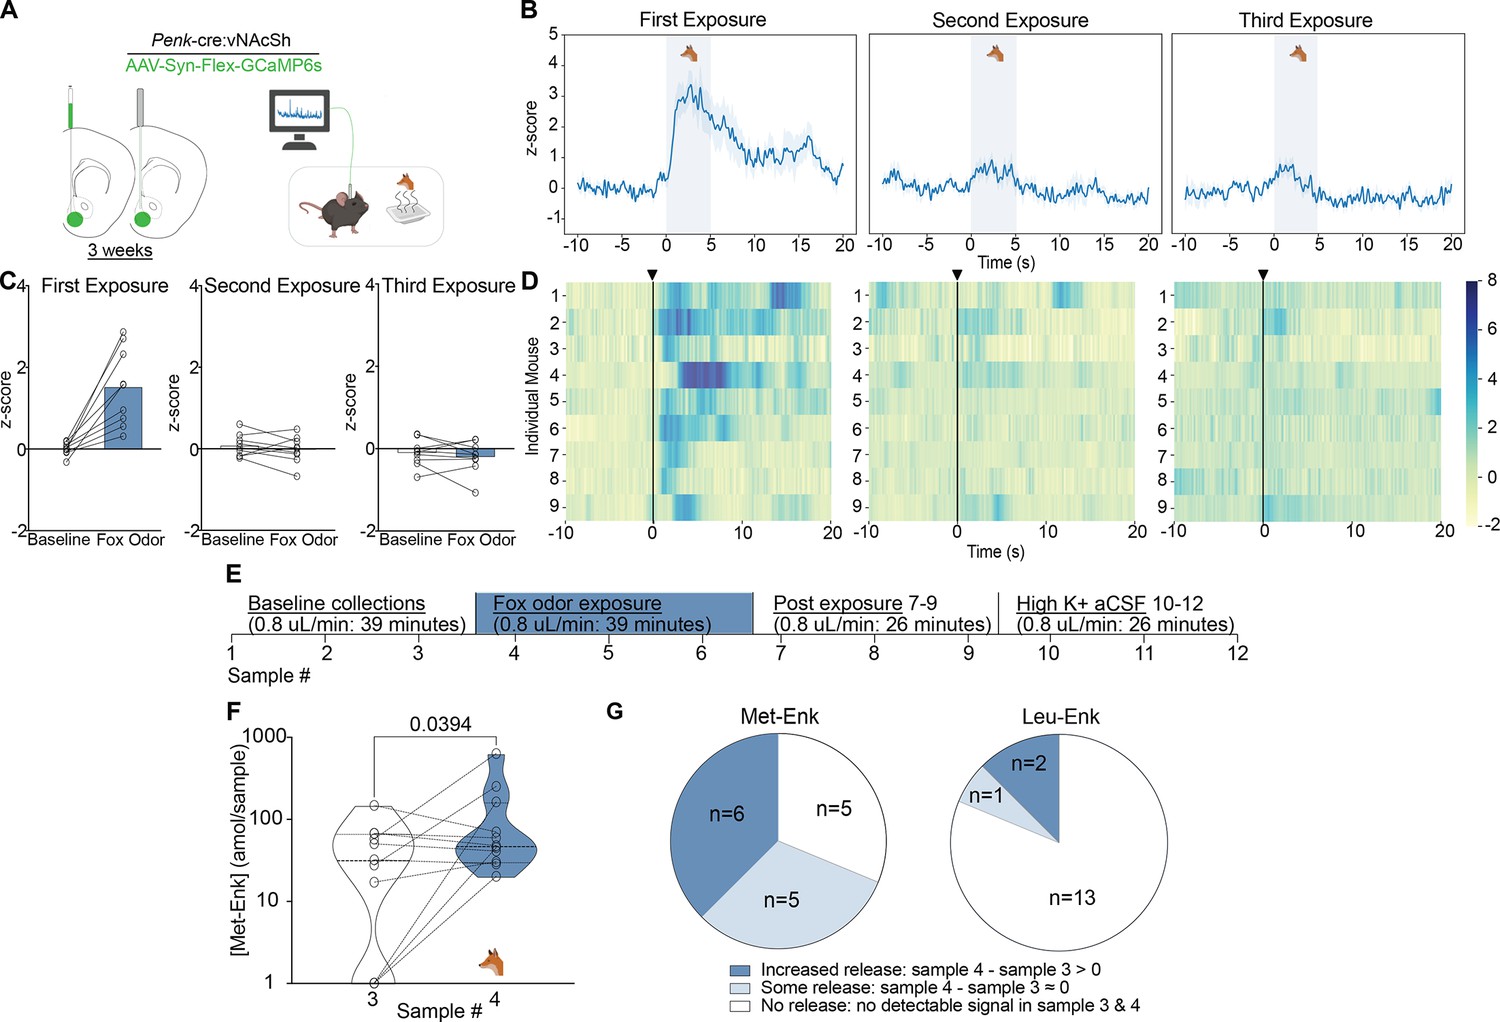
Fox odor exposure activates enkephalinergic neurons and drives the release of Met-enkephalin (Met-Enk) in the nucleus accumbens shell (NAcSh).
(A) Viral strategy and probe placement for the fiber photometry experiment in Penk-Cre mice injected with the calcium sensor GCaMP6s in the NAcSh. (B) Averaged z-score traces of the first, second, and third exposure to fox odor. (C) Bar graphs showing the averaged z-scored fiber photometry responses before and after exposure to fox odor. (D) Heatmaps showing individual mouse z-scored fiber photometry responses before and after exposure to fox odor (n=9, for A–D). (E) Experimental timeline describing the fox odor microdialysis experiment. (F) There is a significant increase in Met-Enk concentration during fox odor exposure (sample 4), in comparison to sample 3 before odor exposure. Data is transformed to a log scale, and the p-value was calculated using a two-tailed paired t-test (n=11), t=2.369, df = 10, mean difference 0.1388, 95% confidence interval –0.5419 to 0.2644. (G) Pie charts showing the variation across animals in Met-Enk and Leu-Enk release profiles in response to exposure to fox odor, suggesting that such exposure may selectively cause the release of Met-Enk but not Leu-Enk. Increased release showed higher concentration of Met-Enk during exposure to fox odor (sample 4) than the sample before (sample 3). Some releases showed a comparable level to the sample before exposure, and no release showed no quantifiable concentration during exposure to fox odor. Panel A, B and F created with BioRender.com.
-
Figure 3—source data 1
Raw data for Figure 3.
- https://cdn.elifesciences.org/articles/91609/elife-91609-fig3-data1-v1.zip
Figure 3—figure supplement 1

Hit map of microdialysis and fiber photometry probes.
(A) Microdialysis probe dimensions including membrane size and inner and outer diameters (ID and OD, respectively). (B) Hit map of microdialysis probes represented in main Figures 2 and 3. Full circles represent hits, and empty circles represent misses. (C) Dimensions for fiber photometry probes including OD of optic fiber and numerical aperture (NA). (D) Hit map of placement of fiber photometry probes. Dark circles represent hits, light circles represent near hits when activity was still recorded, and empty circles represent misses. Panels A and C created with BioRender.com. This data also supplements data as shown in Figure 2.
Figure 3—figure supplement 2

Water exposure activates enkephalinergic neurons in the nucleus accumbens shell (NAcSh).
(A) Viral strategy and probe placement for the fiber photometry experiment in penk-Cre mice injected with the calcium sensor GCaMP6s in the NAcSh. Panel A created with BioRender.com. (B) Averaged z-score traces of the first and second water exposures. The shaded region represents the SEM. (C) Bar graphs showing the averaged z-scored fiber photometry responses before and after exposure to water. (D) Heatmaps showing individual mouse z-scored fiber photometry responses before and after water exposure. (n=5, for A–D). (E) Individual mouse responses to fox urine (blue) and water exposure (magenta) plotted on the same graph for comparison. The final graph is the averaged data for all five mice with the shaded region representing SEM.
-
Figure 3—figure supplement 2—source data 1
Raw data for Figure 3—figure supplement 2.
- https://cdn.elifesciences.org/articles/91609/elife-91609-fig3-figsupp2-data1-v1.zip
Tables
Key resources table
| Reagent type (species) or resource | Designation | Source or reference | Identifiers | Additional information |
|---|---|---|---|---|
| Strain, strain background (C57BL/6 mice) | C57BL/6 | The Jackson laboratory | Strain #:000664 (Jackson laboratory) RRID:MGI:2159769 | Ongoing breeding in laboratory |
| Strain, strain background (proproenkephalin-Cre, C57BL/6 background, mice) | Penk-Cre | Moron-Concepcion Lab (PMID:34646022) | ||
| Strain, strain background (AAV5.Syn.Flex.GCaMP6s.WPRE.SV40) | GCaMP6s | Addgene | viral prep # 100845-AAV5 RRID:Addgene_100845 | pAAV.Syn.Flex.GCaMP6s.WPRE.SV40 was a gift from Douglas Kim and GENIE Project (Addgene viral prep # 100845; http://n2t.net/addgene:100845) |
| Software | Guppy | PMID:34930955 | RRID:SCR_022353 | |
| Software | Python, Matplotlib | https://matplotlib.org/ | RRID:SCR_008394 | |
| Software | GraphPad Prism | https://www.graphpad.com/ | RRID:SCR_002798 | |
| Software | Affinity Designer | https://affinity.serif.com/en-gb/ | RRID:SCR_016952 | |
| Antibody | guinea pig anti-GFAP | Synaptic systems | RRID:AB_10641162 | |
| Antibody | Alexa Fluor 594 | Invitrogen | RRID:AB_141930 | |
| Chemical compound, drug | Vectashield with DAPI | Vector labs | RRID:AB_2336788 | |
| Chemical compound, drug | NeuroTrace 530/615 Red Fluorescent Nissl Stain – Solution in DMSO | Invitrogen | Catalog # N21482 RRID:AB_2620170 | |
| Chemical compound, drug | Vectashield | Vector labs | RRID:AB_2336787 | |
| Peptide, recombinant protein (isotope labeled Leu-Enkephalin, YGGFL) | Leu-Enkephalin (heavy isotope labeled) | New England Peptide | Labeled L-Leucine (13C6, 15N) at the C terminus of the peptide | |
| Peptide, recombinant protein (isotope labeled Met-Enkephalin, YGGFM) | Met-Enkephalin (heavy isotope labeled) | New England Peptide | Labeled L-Phenylalanine (13C9, 15N) was added | |
| Peptide, recombinant protein (Leu-Enkephalin, YGGFL) | Leu-Enkephalin (standard) | New England Peptide | Non-isotope labeled standard | |
| Peptide, recombinant protein (Met-Enkephalin, YGGFM) | Met-Enkephalin (standard) | New England Peptide | Non-isotope labeled standard | |
| Commercial assay or kit | Parkell C&B Metabond kit | Optimus dental supply | SKU 04-PKL-S380 | |
| Chemical compound, drug | Acetonitrile (MeCN) | JT Baker | Cat # 9829-03 | |
| Chemical compound, drug | Water | JT Baker | Cat # 4218-03 | |
| Chemical compound, drug | Formic acid | Sigma-Aldrich | Cat # 56302 | |
| Chemical compound, drug | Methanol (MeOH) | Fluka | Cat # 34966 | |
| Chemical compound, drug | Hydrogen peroxide | Fisher Chemical | Cat #H325-100 | |
| Chemical compound, drug | NaCl | Sigma-Aldrich | ||
| Chemical compound, drug | KCl | Sigma-Aldrich | ||
| Chemical compound, drug | CaCl2 | Sigma-Aldrich | ||
| Chemical compound, drug | MgCl2 | Sigma-Aldrich | ||
| Chemical compound, drug | NaH2PO4 | Sigma-Aldrich | ||
| Chemical compound, drug | NaHCO3 | Sigma-Aldrich | ||
| Chemical compound, drug | HEPES | Sigma-Aldrich | ||
| Chemical compound, drug | Glucose | Sigma-Aldrich | ||
| Chemical compound, drug | Fox urine | PredatorPee fox pee brand | https://predatorpeestore.com/ | |
| Chemical compound, drug | Ketamine | |||
| Chemical compound, drug | Xylazine | Dechra | Rompun | |
| Chemical compound, drug | Acepromazine | Boehringer Ingelheim Animal Health USA Inc | NDC 0010-3827-01 | |
| Chemical compound, drug | Paraformaldehyde | Sigma-Aldrich | ||
| Chemical compound, drug | Triton X-100 | Sigma-Aldrich | ||
| Chemical compound, drug | Goat serum | Sigma-Aldrich | ||
| Chemical compound, drug | PBS | Sigma-Aldrich | ||
| Other | Probes and setup | BASi | Microdialysis probes used in this study are no longer carried by BASi, detailed information in the sections below. | |
| Other | Probes and setup | TDT, Doric lenses | ||
| Other | Laboratory pipetting needles with 90° blunt ends, 16-gauge, 2-inch length | Cadence Science, | Cat # 7938 | |
| Other | C18 extraction disks, diam.=47 mm, 20 pack; | Empore | Cat# 66,883U | |
| Other | Adapter for stage tipping | Glygen | Cat# CEN.24 | |
| Other | 1.5 mL tubes | Axygen | Cat# MCT-175-C | |
| Other | Eppendorf centrifuge | Eppendorf, | model 5424R | |
| Other | Vortex | Labnet VX100 | ||
| Other | Autosampler vials | Sun-Sri | Cat # 200046 | |
| Other | Autosampler vial caps | Sun-Sri | Cat # 501 382 | |
| Other | EASY nLC 1000 | Thermo Scientific | RRID:SCR_014993 | |
| Other | Q-Exactive Plus Hybrid Quadrupole Orbitrap | Thermo Scientific | RRID:SCR_020556 | |
| Other | EASY-Spray column, 75 µm × 50 cm PepMap | Thermo Scientific | Cat # ES903 |
Additional files
Download links
A two-part list of links to download the article, or parts of the article, in various formats.
Downloads (link to download the article as PDF)
Open citations (links to open the citations from this article in various online reference manager services)
Cite this article (links to download the citations from this article in formats compatible with various reference manager tools)
Highly sensitive in vivo detection of dynamic changes in enkephalins following acute stress in mice
eLife 12:RP91609.
https://doi.org/10.7554/eLife.91609.3


