Deletion of FNDC5/irisin modifies murine osteocyte function in a sex-specific manner
- Indiana University, United States
- Korea Advanced Institute of Science and Technology, Republic of Korea
- Maine Health Access Foundation, United States
- Dana Farber Cancer Institute, United States
- Indiana Center for Musculoskeletal Health, United States
Figures
Figure 1 with 1 supplement
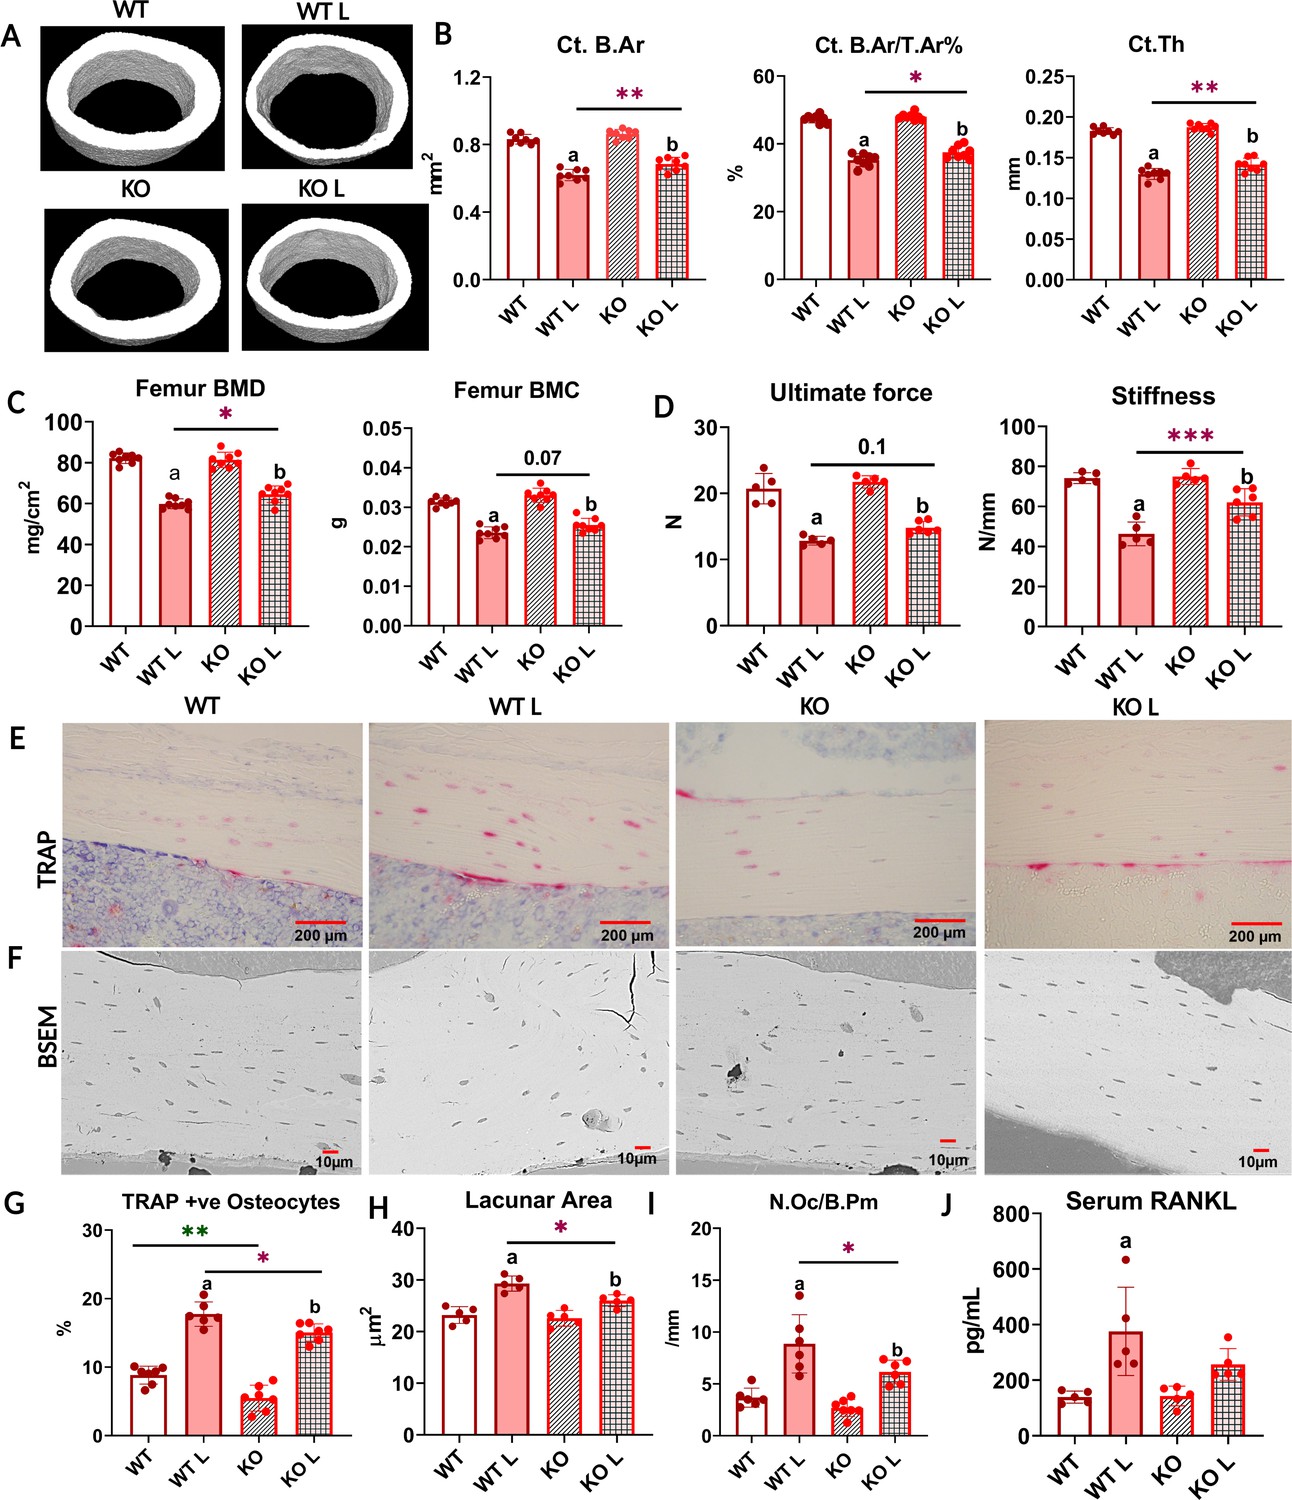
With lactation, FNDC5 global knockout (KO) mice lose less bone and are mechanically stronger compared to WT.
(A) Respective micro-computed tomography (µCT) images of femoral midshafts from WT virgin (WT), KO virgin (KO), WT lactation (WT L), and KO lactation (KO L) mice. (B) µCT analysis of femoral cortical bone parameters of virgin and lactating WT and KO female mice reported as cortical bone area (Ct. B.Ar), cortical bone area fraction (Ct. B.Ar/ T.Ar %), and cortical thickness (Ct. Th). (C) Ex vivo dual-energy X-ray absorptiometry (DXA) analysis for bone mineral density (BMD) and bone mineral content (BMC) of femurs from virgin and lactating WT and KO female mice. (D) Three-point bending analysis of WT and KO virgin and lactating mice reported as ultimate force and stiffness. (E) Representative tartrate-resistant acid phosphatase (TRAP)-stained images of cortical bone from WT virgin (WT), WT lactation (WT L), KO virgin (KO), and KO lactation (KO L) mice. (F) Representative backscatter scanning electron microscope (BSEM) images of WT virgin (WT), KO virgin (KO), WT lactation (WT L), and KO lactation (KO L) mice femur at ×400 magnification. (G) Percent TRAP-positive osteocytes (TRAP+ve) in tibia from virgin and lactating WT and KO mice. (H) Osteocyte lacunar area in femurs from virgin and lactating WT and mice. (I) Osteoclast number per bone perimeter in tibia from virgin and lactating WT and KO mice. (J) Serum receptor activator of nuclear factor kappa β ligand (RANKL) levels in virgin and lactating WT and KO mice. 4- to 5-month-old WT and KO virgin and lactating mice, n = 5–8/group. a=Significantly different from WT, b=significantly different from KO, *=p<0.05, **=p<0.01, ***=p<0.001. Two-way analysis of variance (ANOVA) was performed for statistical analysis. The interaction was not significant.
Figure 1—figure supplement 1
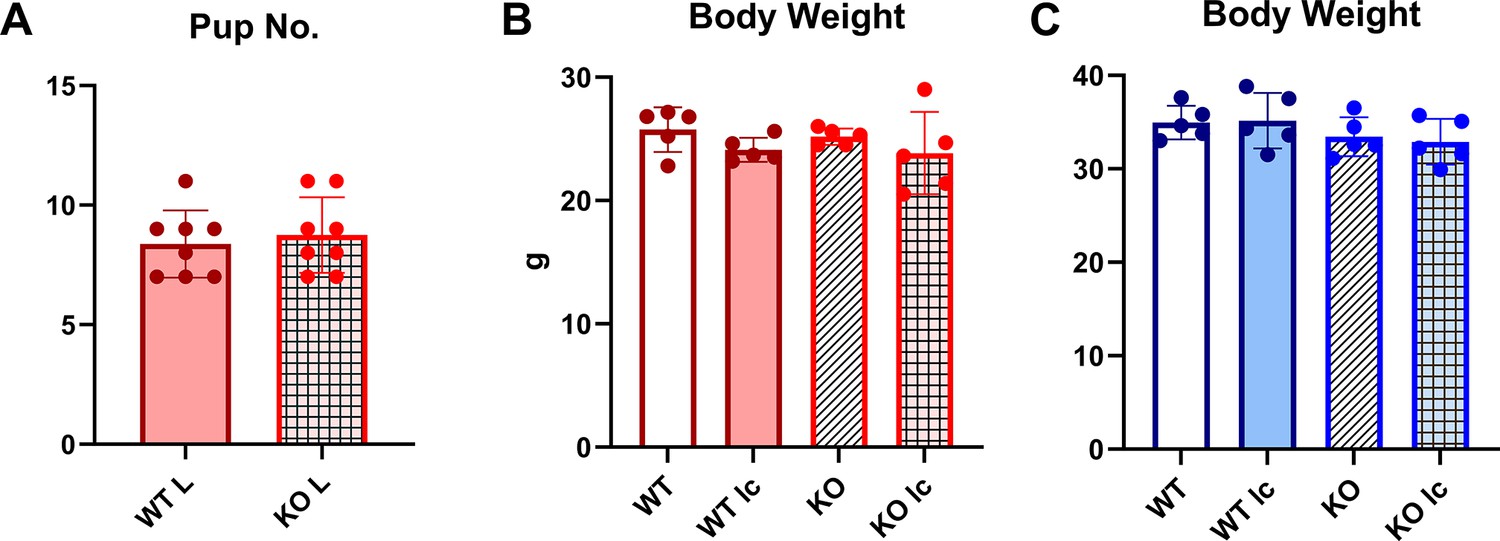
Pup numbers for the lactation experiment, and body weight measurements for the low-calcium diet experiment.
Panel A shows total pup numbers in wildtype (WT) and knockout (KO) female mice that underwent pregnancy and 2 weeks of lactation. There are no significant differences in the pup numbers between genotypes. Student’s t-test was performed for statistical analysis. n = 8/group. Panels B and C show total body weight of WT and KO female (B) and male (C) mice. No statistically significant difference was found among the groups, regardless of genotype or diet. Two-way analysis of variance (ANOVA) with Tukey’s post hoc test was done. n = 4-5/group. As depicted here, red is female, and blue is male.
Figure 2
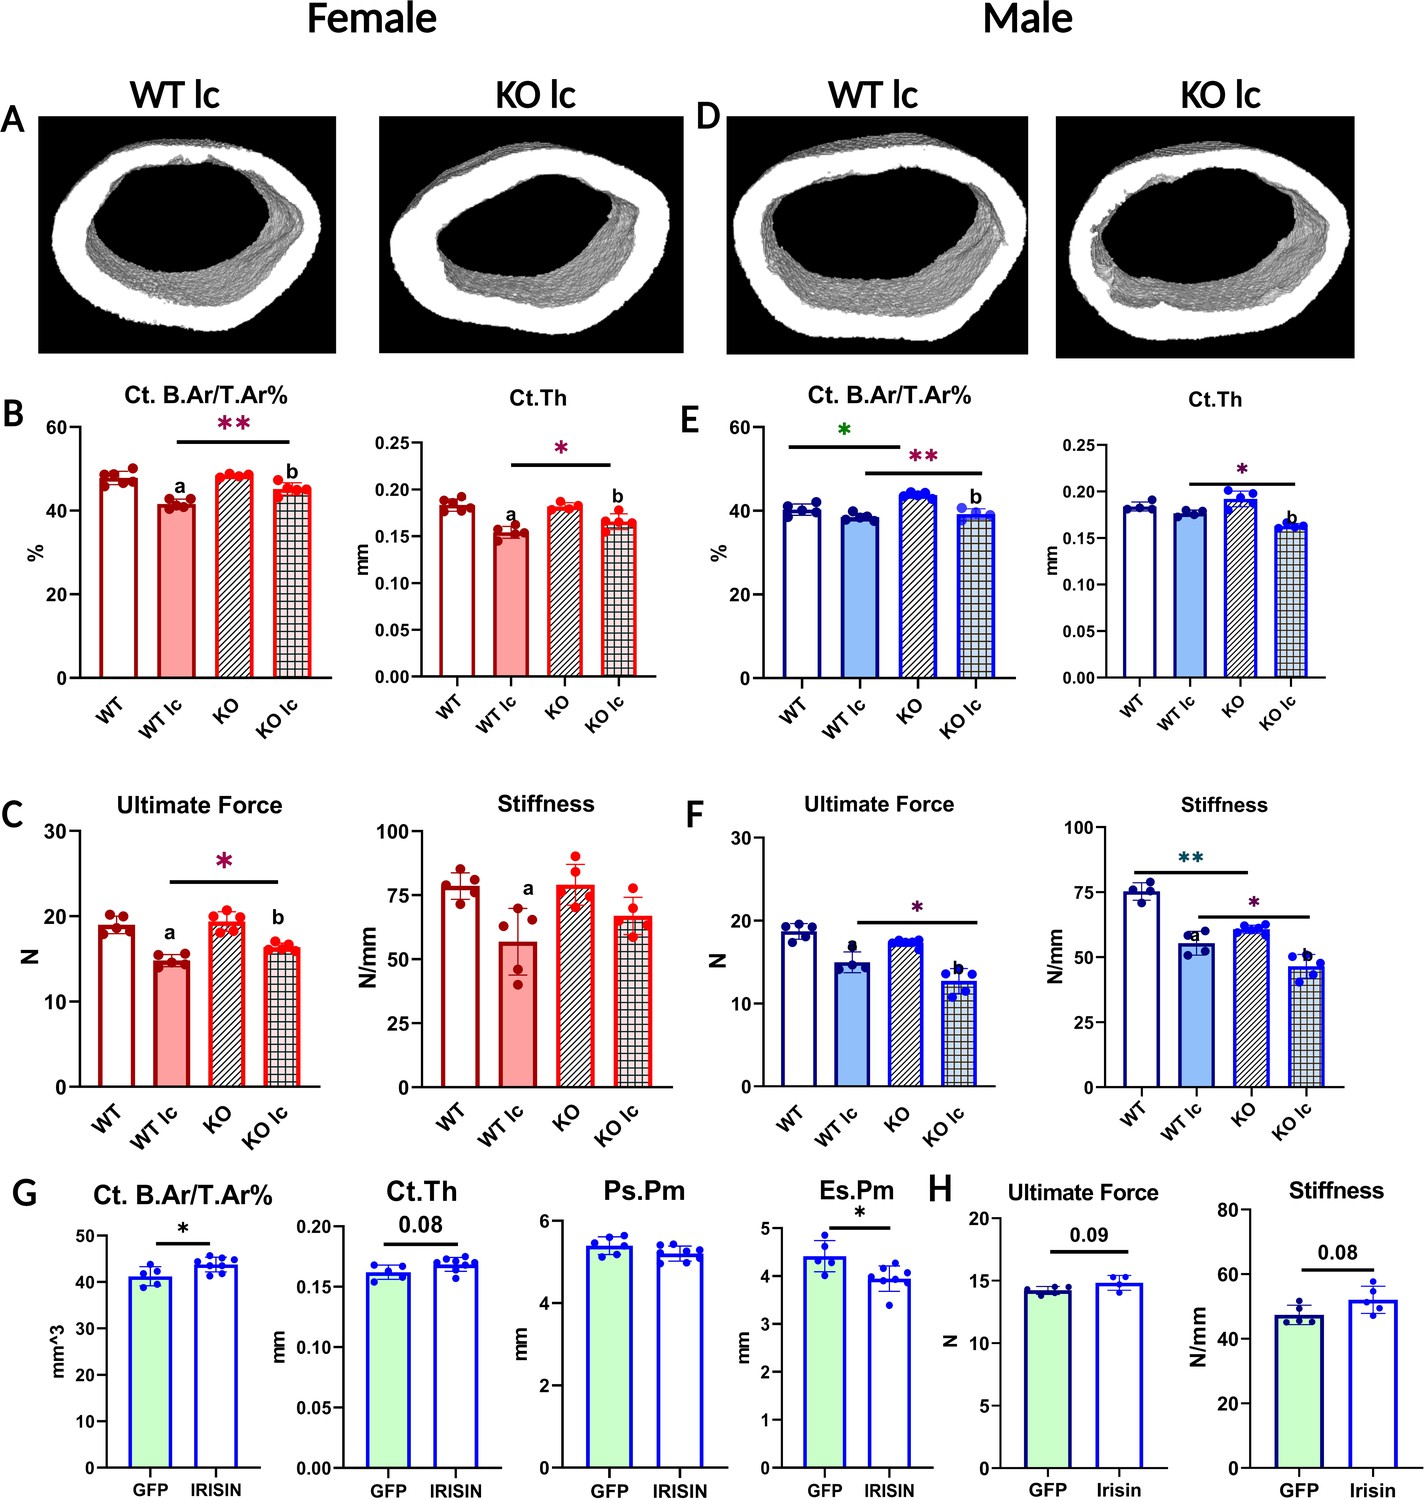
FNDC5 KO female and male mice have opposite responses to a low- calcium diet with regard to bone composition, structure, and mechanics, and irisin injection rescues FNDC5 KO male mice phenotype under a low-calcium diet.
(A) Representative micro-computed tomography (µCT) images of femoral midshaft cortical bones from WT low-calcium diet female mouse (WT lc) and KO low-calcium diet female mouse (KO lc). (B) Female femoral midshaft cortical bone parameters of WT control (WT), WT low-calcium diet (WT lc), KO control (KO), and KO low-calcium diet (KO lc) mice reported as cortical bone area fraction (Ct. B.Ar/T.Ar%) and cortical thickness (Ct.Th). (C) Mechanical properties of femurs from female WT and KO control and low-calcium diet reported as ultimate force and stiffness. (D) Representative µCT images of femoral midshaft cortical bones from WT low-calcium diet male mice (WT lc) and KO low-calcium diet male mice (KO lc). (E) Male femoral midshaft cortical bone parameters of WT control (WT), WT low-calcium diet (WT lc), KO control (KO), and KO low-calcium diet (KO lc) mice reported as cortical bone area fraction (Ct. B.Ar/T.Ar%) and cortical thickness (Ct. Th). (F) Mechanical properties of femurs from male WT and KO control and low-calcium diet reported as ultimate force and stiffness. n = 4–5/group. a=Significantly different from WT, b=significantly different from KO, *=p<0.05, **=p<0.01. Two-way analysis of variance (ANOVA) was performed. As depicted here, red is female, and blue is male. (G) µCT measurement of femoral cortical bone of AAV8-GFP or AAV8-irisin-injected male KO mice after a 2-week low-calcium diet, reported as cortical bone area fraction (Ct. B.Ar/T.Ar%), cortical thickness (Ct. Th), periosteal parameter (Ps.Pm), and endosteal parameter (Es.Pm). (H) Mechanical properties of femurs from male KO low-calcium diet mice injected with AAV8-GFP or AAV8-irisin reported as ultimate force and stiffness. n = 5–7/group, *=p<0.05. Student’s t-test was performed for statistical analysis between male KO GFP vs irisin-injected mice. As depicted here, green shaded bars represent GFP-injected mice.
Figure 3 with 1 supplement

Osteocytes from female and male knockout (KO) mice respond differently to a low-calcium diet.
(A) Percentage of tartrate-resistant acid phosphatase (TRAP)-positive (+ve) osteocytes in female and male wildtype (WT) and KO mice given a normal or a low-calcium diet. (B) Osteoclast number (N.Oc/B.Pm) in WT and KO female and male mice given a normal or a low-calcium diet. (C) Representative backscatter scanning electron microscope (BSEM) images depicting osteocyte lacunar area in femurs from WT female (WT F) and WT male (WT M) given a normal diet at ×450 magnification. (D) Osteocyte lacunar area in WT and KO female and male mice given a normal diet. (E) Lacunar area in female and male WT and KO mice given a normal or a low-calcium diet. (F) Serum receptor activator of nuclear factor kappa β ligand (RANKL) levels in female and male WT and KO mice given either a normal diet or a low-calcium diet. (G) Serum parathyroid hormone (PTH) levels in female and male WT and KO mice given either a normal diet or a low-calcium diet. (H) Serum calcium levels in female and male WT and KO mice given either a normal diet or a low-calcium diet. n = 4–5/group. a=Significantly different from WT, b=significantly different from KO, *=p<0.05, **=p<0.01. Two-way analysis of variance (ANOVA) was performed. As depicted here, red is female, and blue is male.
Figure 3—figure supplement 1
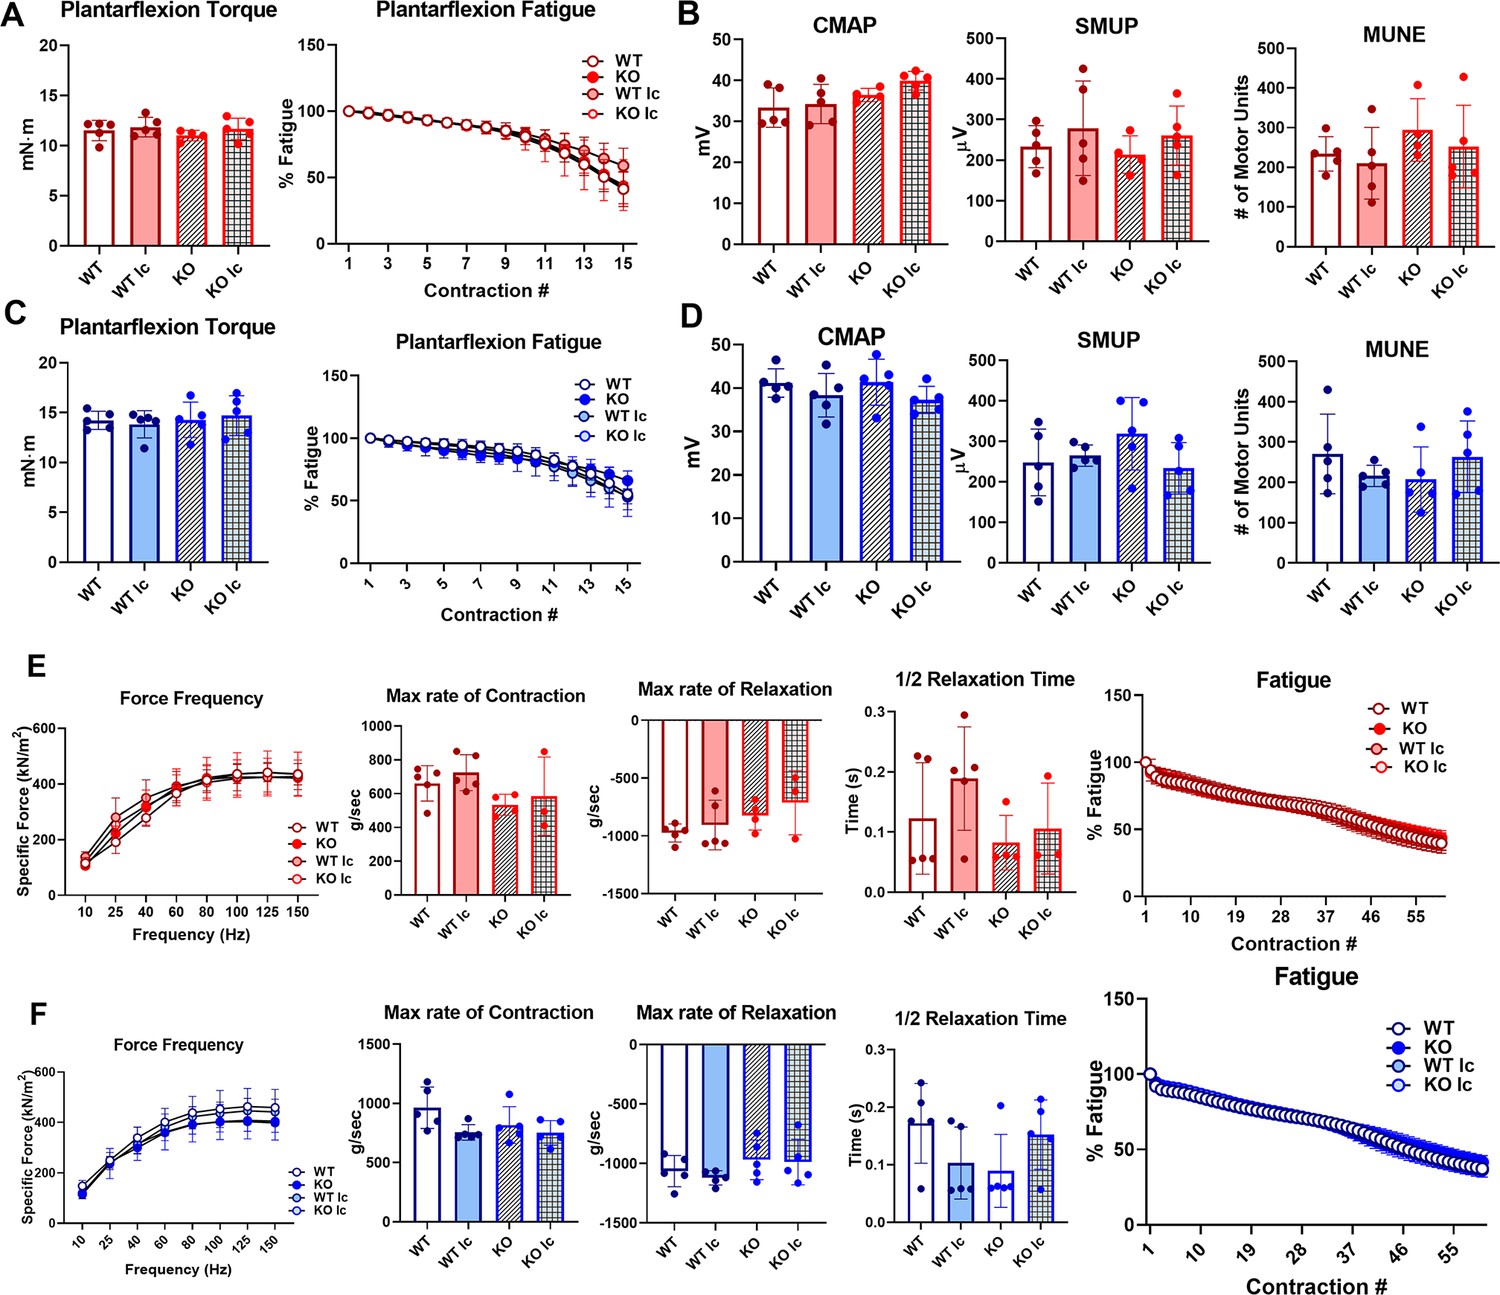
Neither genotype nor dietary calcium alters muscle functions in vivo or ex vivo.
Panels A and C show in vivo muscle plantarflexion force (reported as plantarflexion torque and plantarflexion fatigue) in wildtype (WT) and knockout (KO) female (A) and male (C) mice on a control or a low-calcium diet, panels B and D show muscle electrophysiology parameters of CMAP, SMUP, and MUNE in WT and KO female (B) and male (D) mice, and panels E and F show ex vivo EDL functional measurement (reported as specific force frequency, maximum rate of contraction, maximum rate of relaxation, half-relaxation time, and % fatigue) in WT and KO female (E) and male (F) mice. Two-way analysis of variance (ANOVA) was performed. n = 4–5/group. As depicted here, red is female, and blue is male.
Figure 4
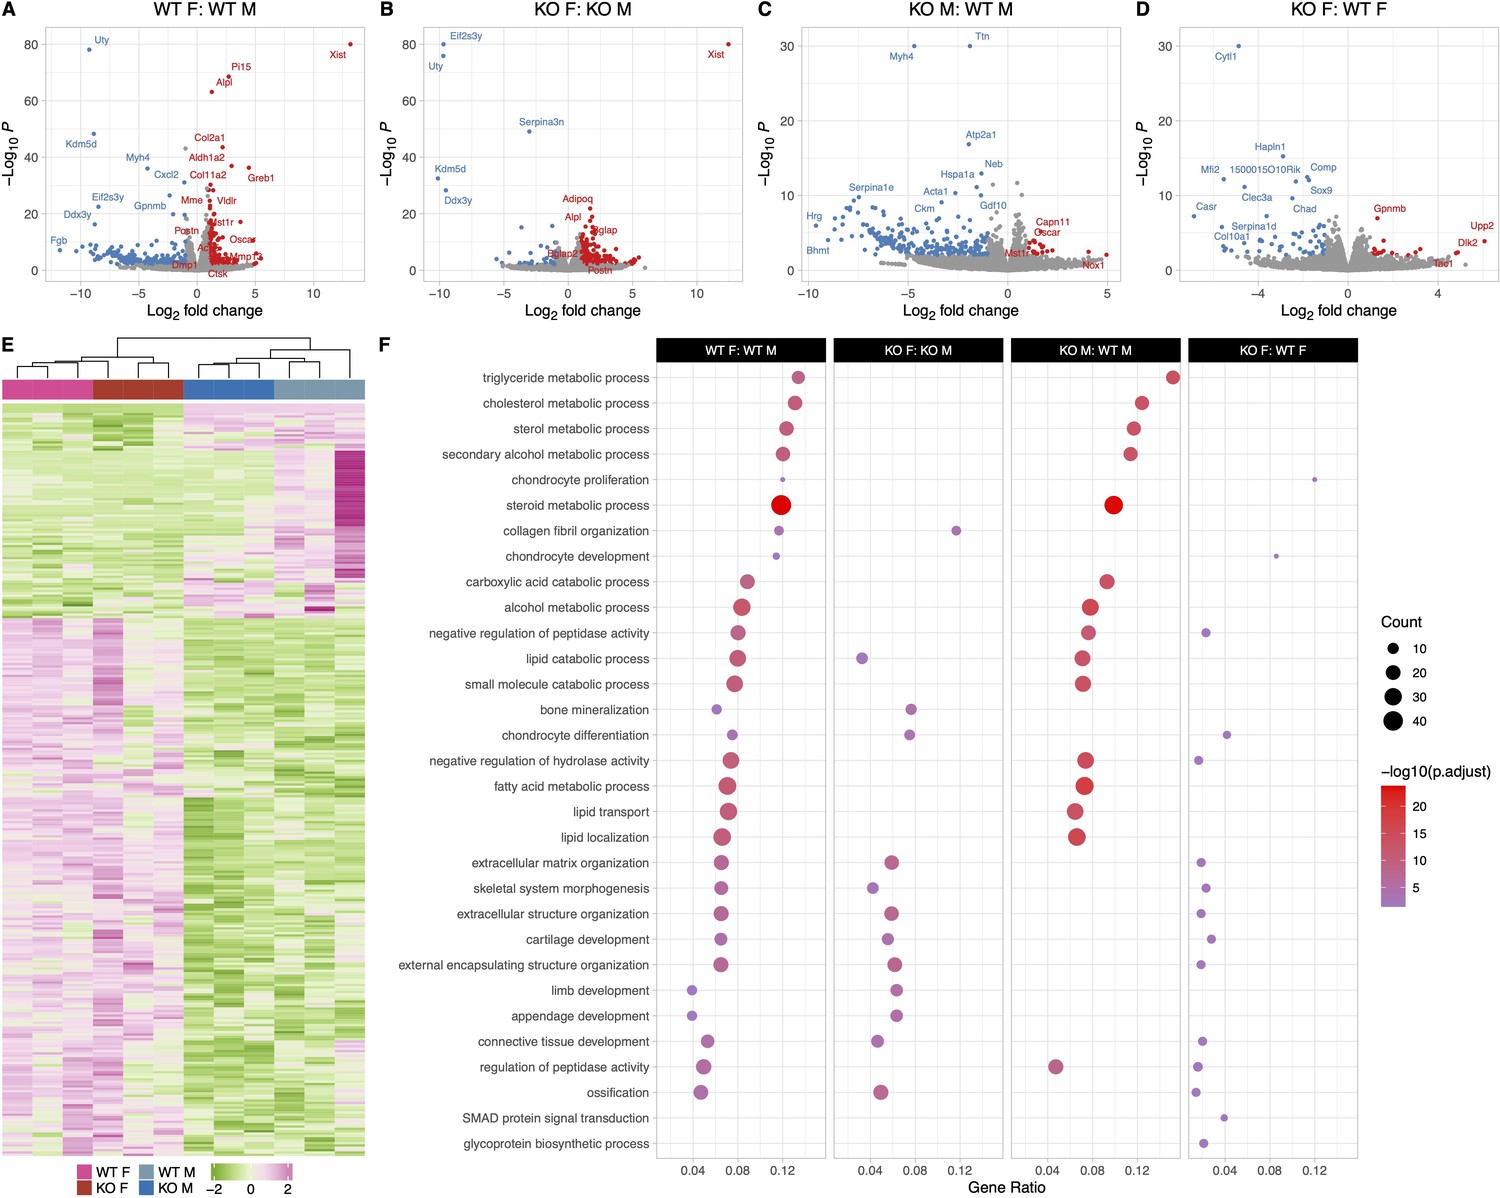
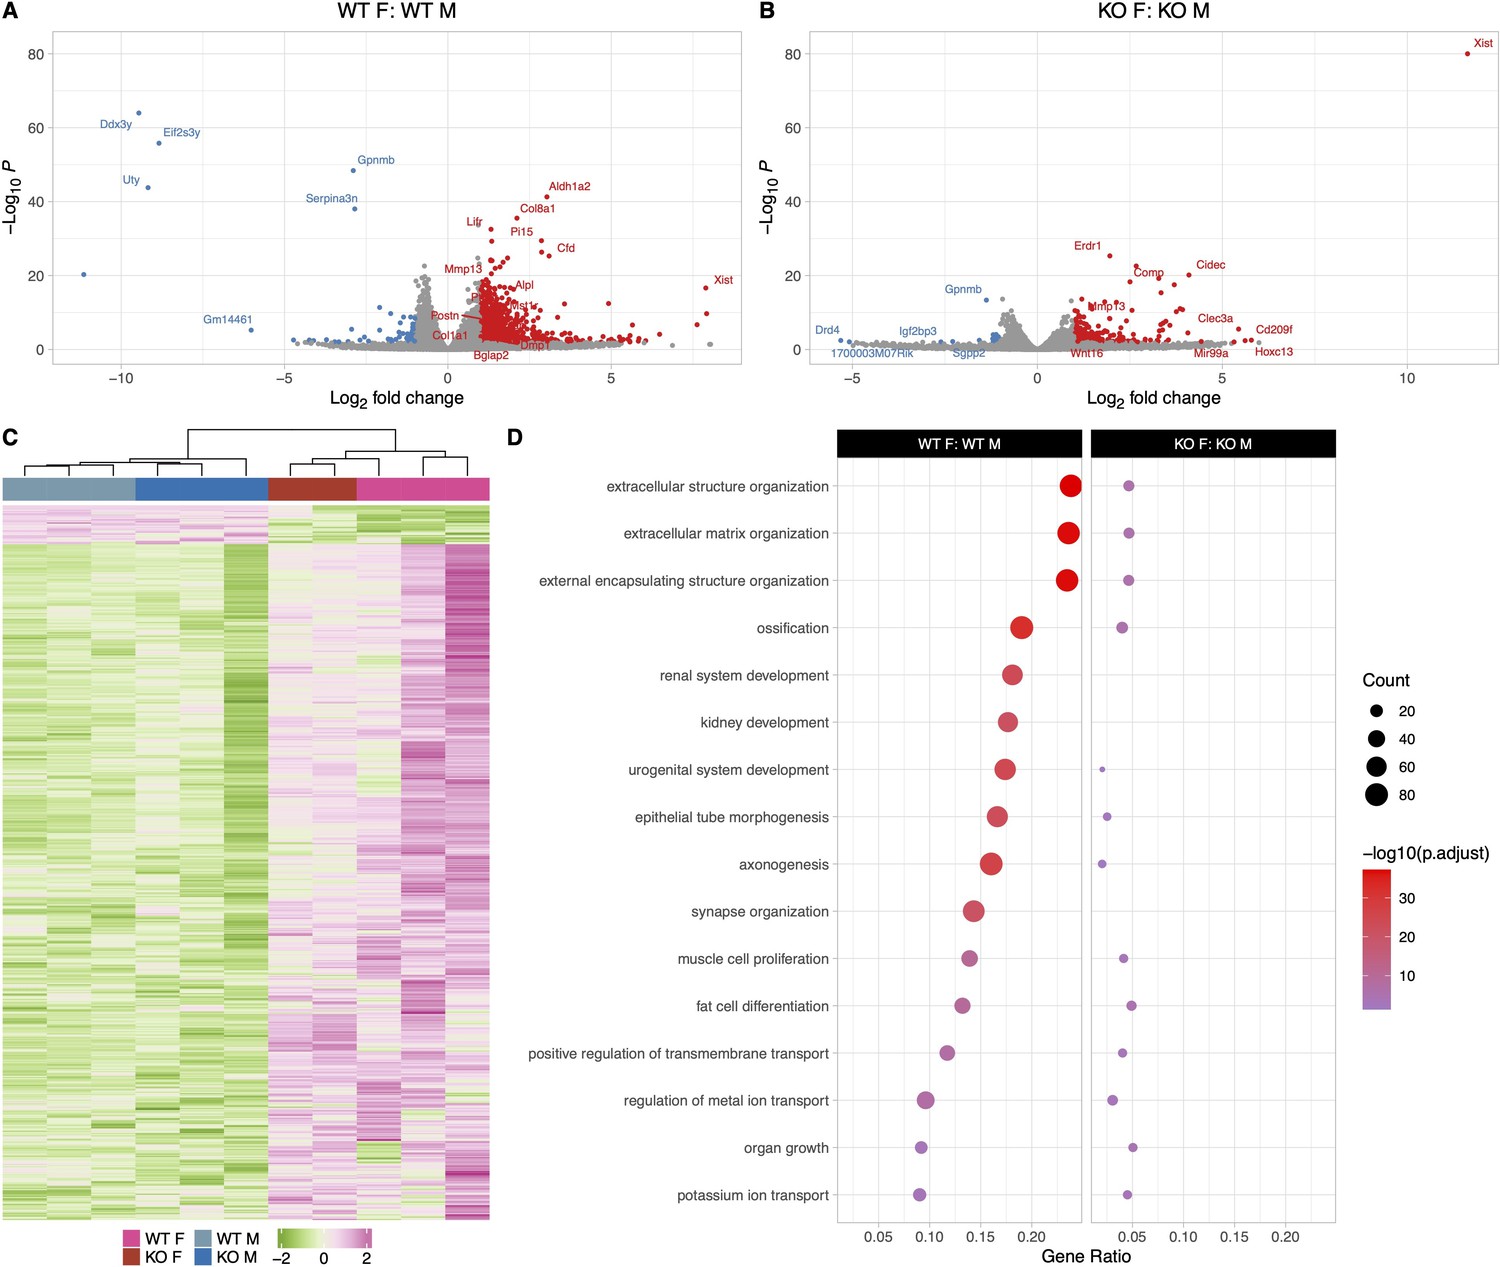
Female and male wildtype (WT) osteocyte transcriptomes are distinctly different; however, female and male knockout (KO) osteocyte transcriptomes have fewer differences compared to WT female and male transcriptomes.
(A) Volcano plot showing the significantly regulated genes between WT female control (WT F) and WT male control (WT M) osteocyte transcriptome. (B) Volcano plot showing the significantly regulated genes between KO female control (KO F) and KO male control (KO M) osteocyte transcriptome. (C) Volcano plot showing the significantly regulated genes between WT male control (WT M) and KO male control (KO M) osteocyte transcriptome. (D) Volcano plot showing the significantly regulated genes between WT female control (WT F) and KO female control (KO F) osteocyte transcriptome. (E) Heat map showing the differentially expressed genes (DEG) among WT female control (WT F), WT male control (WT M), KO female control (KO F), and KO male control (KO M) osteocyte transcriptome. (F) Gene set enrichment analysis of gene ontology (GO) analysis of the significantly regulated genes between WT female control (WT F) and WT male control (WT M) osteocyte transcriptome, between KO female control (KO F) and KO male control (KO M) osteocyte transcriptome, WT male control (WT M) and KO male control (KO M) osteocyte transcriptome, and WT female control (WT F) and KO female control (KO F) osteocyte transcriptome. The figure shows the union of the top 10 GO terms of each analysis. If a term in the union, besides the top 10, is also significant (adjusted p-value less than 0.05 was used for GO analysis) in an analysis, it is also included in the figure. The latter group in the figure’s title is the reference group. n = 3/group. For DEG analysis, unadjusted p-value <0.01 was used.
Figure 5 with 1 supplement
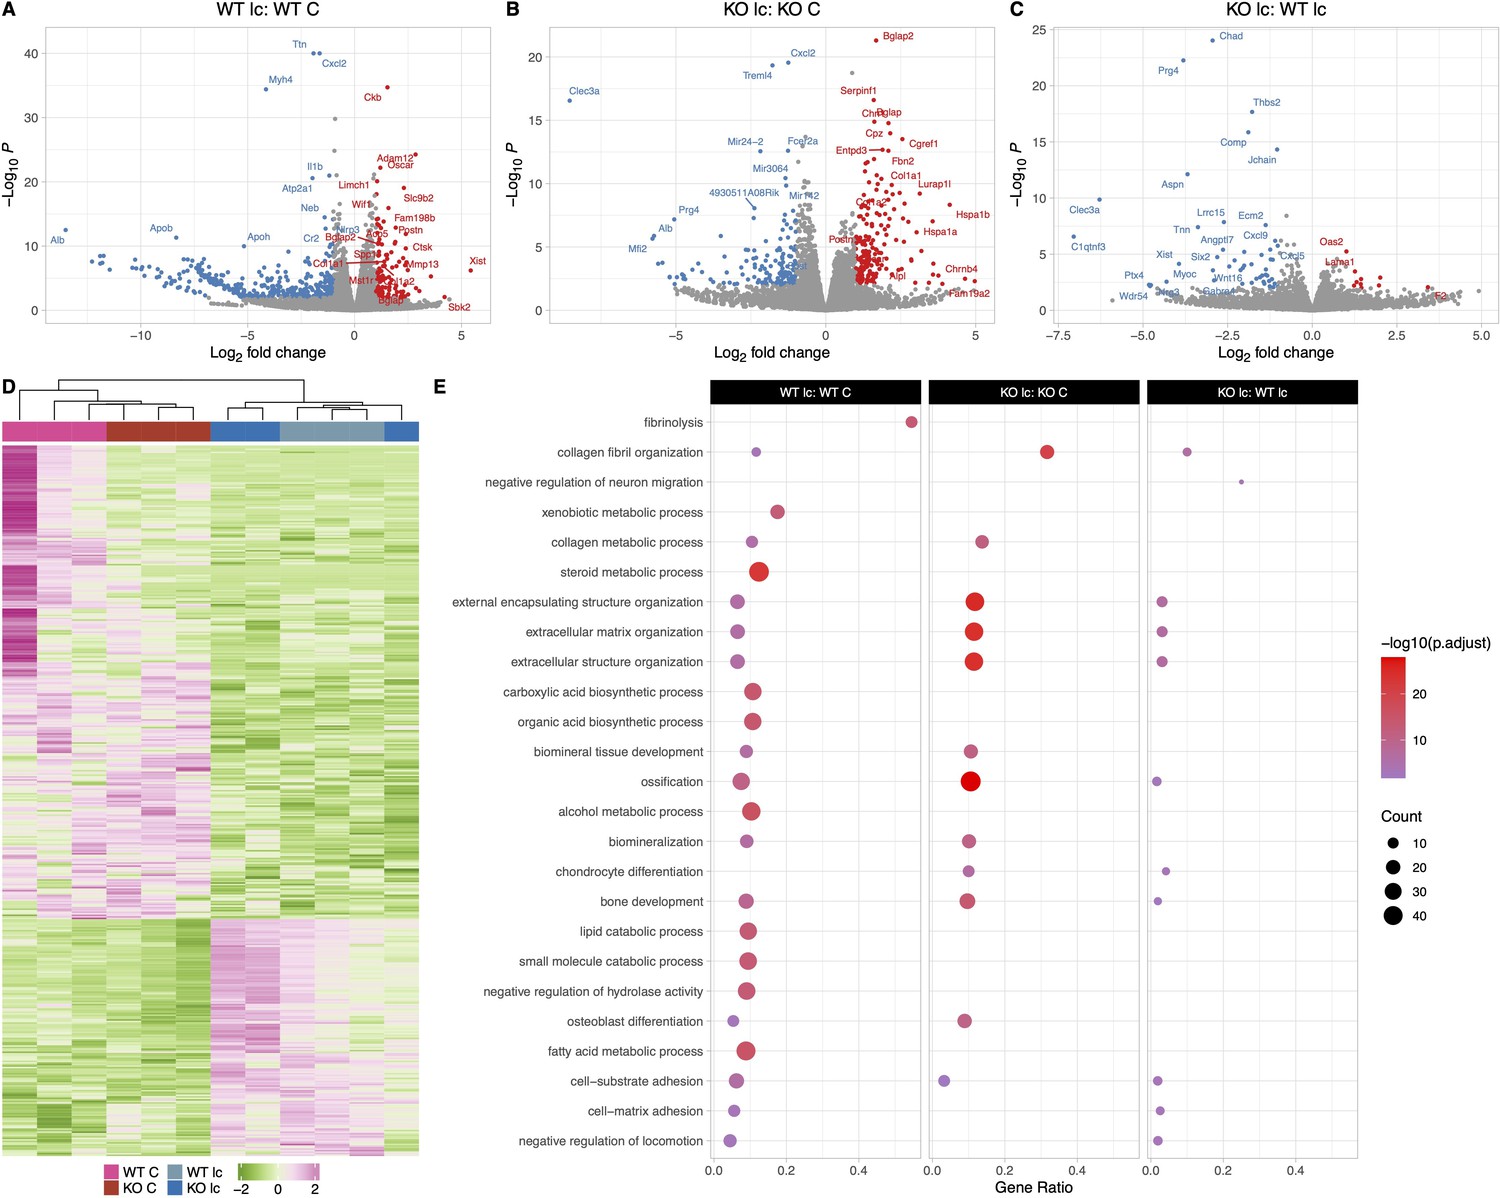
The osteocyte transcriptomes from female wildtype (WT) and knockout (KO) mice are distinct when challenged with a low-calcium diet.
(A) Volcano plot showing the significantly regulated genes between WT female control (WT C) and WT female low-calcium diet-fed mice (WT lc) osteocyte transcriptome. (B) Volcano plot showing the significantly regulated genes between KO female control (KO C) and KO female low-calcium diet-fed mice (KO lc) osteocyte transcriptome. (C) Volcano plot showing the significantly regulated genes between WT female low-calcium diet-fed mice (WT lc) and KO female low-calcium diet-fed mice (KO lc) osteocyte transcriptome. (D) Heat map showing the differentially expressed genes (DEGs) among WT female control (WT C), WT female low-calcium diet-fed mice (WT lc), KO female control (KO C), and KO female low-calcium diet-fed mice (KO lc) osteocyte transcriptome. (E) Gene set enrichment analysis of gene ontology (GO) analysis of the significantly regulated genes between WT female control (WT C) and WT female low-calcium diet-fed mice (WT lc) osteocyte transcriptome, between KO female control (KO C) and KO female low-calcium diet-fed mice (KO lc) osteocyte transcriptome, and WT female low-calcium diet-fed mice (WT lc) and KO female low-calcium diet-fed mice (KO lc) osteocyte transcriptome. The figure shows the union of the top 10 GO terms of each analysis. If a term in the union, besides the top 10, is also significant (adjusted p-value less than 0.05 was used for GO analysis) in an analysis, it is also included in the figure. The latter group in the figure’s title is the reference group. n = 2–3/group. For DEG analysis, unadjusted p-value <0.01 was used.
Figure 5—figure supplement 1

Quality control and validation of RNA sequencing.
Sanity check of data on the sample’s sex. (A) Boxplot of proportional of reads on chromosome Y. Male should have a higher value than female. (B) Boxplot of RPKM of Xist. Males should have very low expression of Xist. (C) Scatter plot of PC1 and PC2 from principal component analysis (PCA) of gene expression data. (D) Quantitative polymerase chain reaction (qPCR) analysis of Tnsfs11, Acp5, Sost, and Ctsk genes from osteocyte-enriched bone chips from female samples. n = 3-4/sample. Two-way analysis of variance (ANOVA) was performed for statistical analysis. Gene fold-change was normalized using β-2-microglobulin as the housekeeping gene. a = Significantly different from WT, b = Significantly different from KO, * = p<0.05. (E) qPCR analysis of Tnsfs11, Acp5, Sost, and Ctsk genes from osteocyte-enriched bone chips from male samples. n = 3-4/sample. Two-way ANOVA was performed for statistical analysis. Gene fold-change was normalized using β-2-microglobulin as the housekeeping gene. a = Significantly different from WT, b = Significantly different from KO, * = p<0.05.
Figure 6

The osteocyte transcriptomes from male wildtype (WT) and knockout (KO) mice are distinct when challenged with a low-calcium diet.
(A) Volcano plot showing the significantly regulated genes between WT male control (WT C) and WT male low-calcium diet-fed mice (WT lc) osteocyte transcriptome. (B) Volcano plot showing the significantly regulated genes between KO male control (KO C) and KO male low-calcium diet-fed mice (KO lc) osteocyte transcriptome. (C) Volcano plot showing the significantly regulated genes between WT male low-calcium diet-fed mice (WT lc) and KO male low-calcium diet-fed mice (KO lc) osteocyte transcriptome. (D) Heat map showing the differentially expressed genes (DEGs) among WT male control (WT C), WT male low-calcium diet-fed mice (WT lc), KO female control (KO C), and KO male low-calcium diet-fed mice (KO lc) osteocyte transcriptome. (E) Gene set enrichment analysis of gene ontology (GO) analysis of the significantly regulated genes between WT male control (WT C) and WT male low-calcium diet-fed mice (WT lc) osteocyte transcriptome, between KO male control (KO C) and KO male low-calcium diet-fed mice (KO lc) osteocyte transcriptome, and WT male low-calcium diet-fed mice (WT lc) and KO male low-calcium diet-fed mice (KO lc) osteocyte transcriptome. The figure shows the union of the top 10 GO terms of each analysis. If a term in the union, besides the top 10, is also significant (adjusted p-value less than 0.05 was used for GO analysis) in an analysis, it is also included in the figure. The latter group in the figure’s title is the reference group. n = 3/group. For DEG analysis, unadjusted p-value <0.01 was used.
Figure 7
The osteocyte transcriptomes from male and female mice are distinct when challenged with a low-calcium diet.
(A) Volcano plot showing the significantly regulated genes between WT female low-calcium diet-fed (WT F) and WT male low-calcium diet-fed mice (WT M) osteocyte transcriptome. (B) Volcano plot showing the significantly regulated genes between KO female low-calcium diet-fed (KO F) and KO male low-calcium diet-fed mice (KO M) osteocyte transcriptome. (C) Heat map showing the differentially expressed genes (DEGs) among WT male low-calcium diet-fed mice (WT M), KO male low-calcium diet-fed mice (KO M), WT female low-calcium diet-fed (WT F), and KO female low-calcium diet-fed (KO F) osteocyte transcriptome. (D) Gene set enrichment analysis of gene ontology (GO) analysis of the significantly regulated genes between WT female low-calcium diet-fed (WT F) and WT male low-calcium diet-fed mice (WT M) osteocyte transcriptome, and between KO female low-calcium diet-fed (KO F) and KO male low-calcium diet-fed mice (KO M) osteocyte transcriptome. The figure shows the union of the top 10 GO terms of each analysis. If a term in the union, besides the top 10, is also significant (adjusted p-value less than 0.05 was used for GO analysis) in an analysis, it is also included in the figure. The latter group in the figure’s title is the reference group. n = 2–3/group. For DEG analysis, unadjusted p-value <0.01 was used.
Figure 8
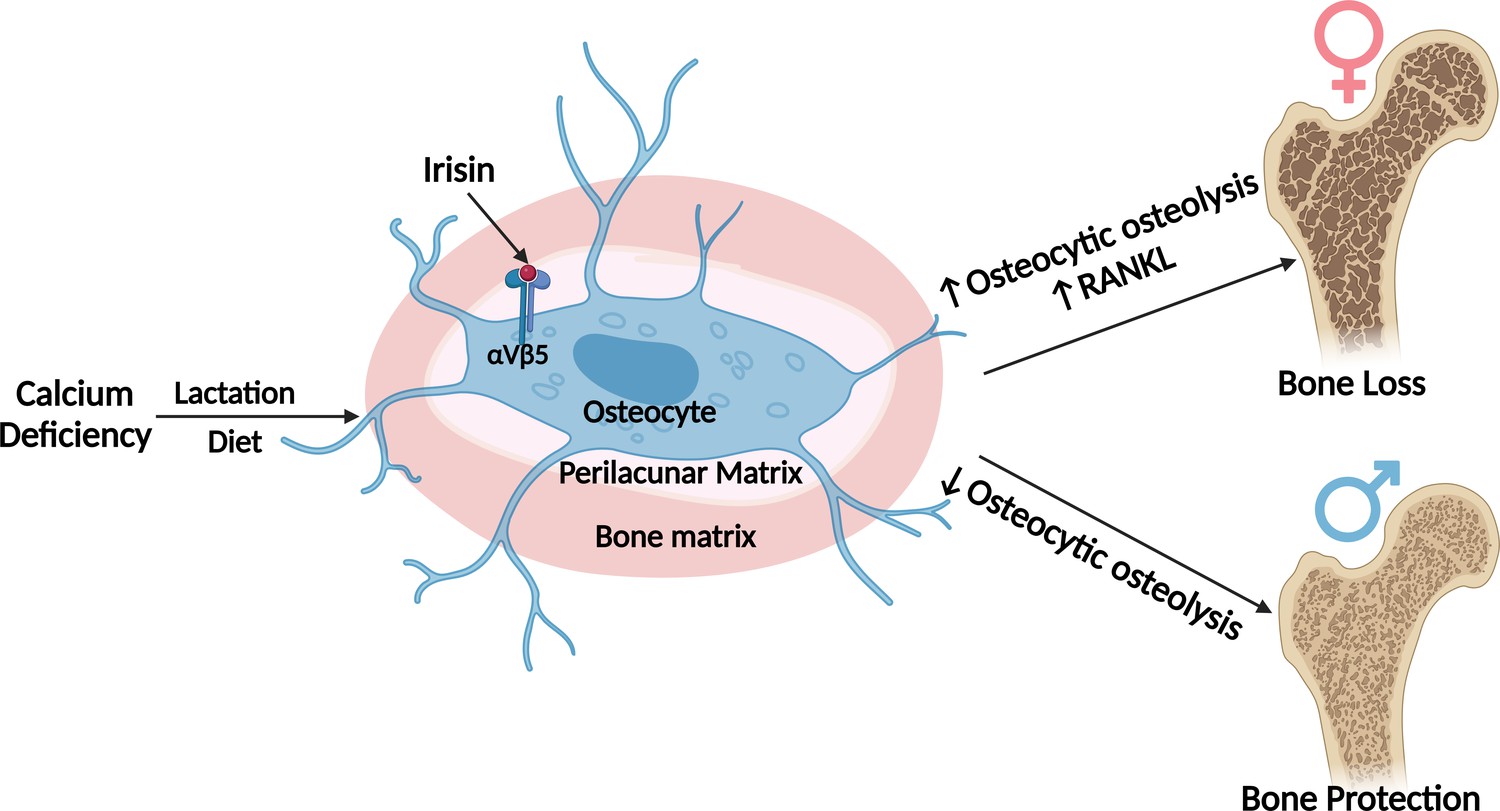
Graphical abstract (image was created using BioRender.com and published using a CC BY-NC-ND license with permission).
No differences are observed in bone from Fndc5/irisin null female, whereas null male skeletons are larger but weaker compared to wildtype controls. With calcium deficiency, lactating female null mice are protected from bone loss due to osteocytic osteolysis, whereas male null mice on a low-calcium diet lose greater amounts of bone compared to their wildtype controls. The osteocyte transcriptomes show wildtype males have higher expression of the steroid, lipid, and fatty acid pathways which are lower in the null males, whereas the wildtype females have higher expression of genes regulating osteocytic osteolysis than null females. With calcium deficiency, female null osteocytes have lower while male null osteocytes have higher expression of osteocytic osteolysis genes compared to wildtype controls.
© 2024, BioRender Inc. Figure 8 was created using BioRender, and is published under a CC BY-NC-ND. Further reproductions must adhere to the terms of this license
Tables
Table 1
FNDC5 knockout (KO) female and male mice have opposite responses to a low-calcium diet compared to wildtype (WT) female and male mice where female KO mice are protected but male KO mice have greater bone loss than WT.
Percentage changes in different bone and serum parameters of WT and KO female and male mice with a 2-week low-calcium diet. *=p<0.05 compared to WT.
| Bone parameters and serum markers | % Change in female | % Change in male | |||
|---|---|---|---|---|---|
| Change | WT | KO | WT | KO | |
| Bone area | Decrease | 13% | 7%* | 2% | 13%* |
| Bone area fraction | Decrease | 17% | 11%* | 7% | 23%* |
| Cortical thickness | Decrease | 19% | 13%* | 4% | 15%* |
| Osteoclast number/bone perimeter | Increase | 125% | 127% | 170% | 336%* |
| TRAP-positive osteocytes | Increase | 180% | 290% * | 85% | 388%* |
| Osteocyte lacunar area | Increase | 38% | 16% * | 60% | 89%* |
| Serum PTH | Increase | 150% | 75% * | 70% | 164%* |
| Serum RANKL | Increase | 100% | 118% | 119% | 130% |
Additional files
-
Supplementary file 1
FNDC5 knockout (KO) mice femurs are partially resistant to lactation-induced bone loss.
Femoral cortical and trabecular bone parameters of wildtype (WT) and FNDC5 KO female virgin and lactation mice. n = 5–8/group. Data presented as mean ± standard deviation. a=Significant compared to WT control, b=significant compared to KO control, c=significant compared to WT low-calcium diet, two-way analysis of variance (ANOVA), significance <0.05, n = 8/group. Percentage change in different bone and serum parameters in WT and FNDC5 KO female mice with lactation. *=p<0.05 compared to WT.
- https://cdn.elifesciences.org/articles/92263/elife-92263-supp1-v1.docx
-
Supplementary file 2
Wildtype (WT) and FNDC5 knockout (KO) female and male mice bone responds differently to a low-calcium diet.
Femoral bone mineral density (BMD), bone mineral content (BMC), cortical and trabecular bone parameters, and mechanical properties of 4- to 5-month-old WT and KO female and male mice under a normal diet or a 2-week low-calcium diet. n = 5/group. Data presented as mean ± standard deviation. a=significant compared to WT control, b=significant compared to KO control, c=significant compared to WT low-calcium diet, two-way analysis of variance (ANOVA), significance <0.05, n = 4–5/group.
- https://cdn.elifesciences.org/articles/92263/elife-92263-supp2-v1.docx
-
Supplementary file 3
Differentially expressed genes in WT F vs WT M and KO F vs KO M.
Genes that are significantly differentially expressed in female FNDC5 KO mice compared to female WT mice as well as genes that are significantly differentially expressed in male FNDC5 KO mice compared to male WT mice are listed.
- https://cdn.elifesciences.org/articles/92263/elife-92263-supp3-v1.xlsx
-
Supplementary file 4
Female KO lc vs WT lc and male KO lc vs WT lc genes.
Genes that are significantly differentially expressed in low-calcium diet-fed female FNDC5 KO mice compared to low-calcium diet-fed female WT mice as well as genes that are significantly differentially expressed in low-calcium diet-fed male FNDC5 KO mice compared to low-calcium diet-fed male WT mice are listed.
- https://cdn.elifesciences.org/articles/92263/elife-92263-supp4-v1.xlsx
-
MDAR checklist
- https://cdn.elifesciences.org/articles/92263/elife-92263-mdarchecklist1-v1.docx
Download links
A two-part list of links to download the article, or parts of the article, in various formats.
Downloads (link to download the article as PDF)
Open citations (links to open the citations from this article in various online reference manager services)
Cite this article (links to download the citations from this article in formats compatible with various reference manager tools)
Deletion of FNDC5/irisin modifies murine osteocyte function in a sex-specific manner
eLife 12:RP92263.
https://doi.org/10.7554/eLife.92263.3


