PURA syndrome-causing mutations impair PUR-domain integrity and affect P-body association
- Institute of Structural Biology, Molecular Targets and Therapeutics Center, Helmholtz Munich, Germany
- Institute of Pharmaceutical Biotechnology, Ulm University, Germany
- Chemistry Department, Biomolecular NMR and Center for Integrated Protein Science Munich, Technical University of Munich, Germany
- Biocenter, Institute of Molecular Physiology, Johannes Gutenberg-Universität (JGU), Germany
- Acellera Labs SL, Spain
- Institute of Molecular Biology (IMB), Germany
Figures
Figure 1 with 4 supplements
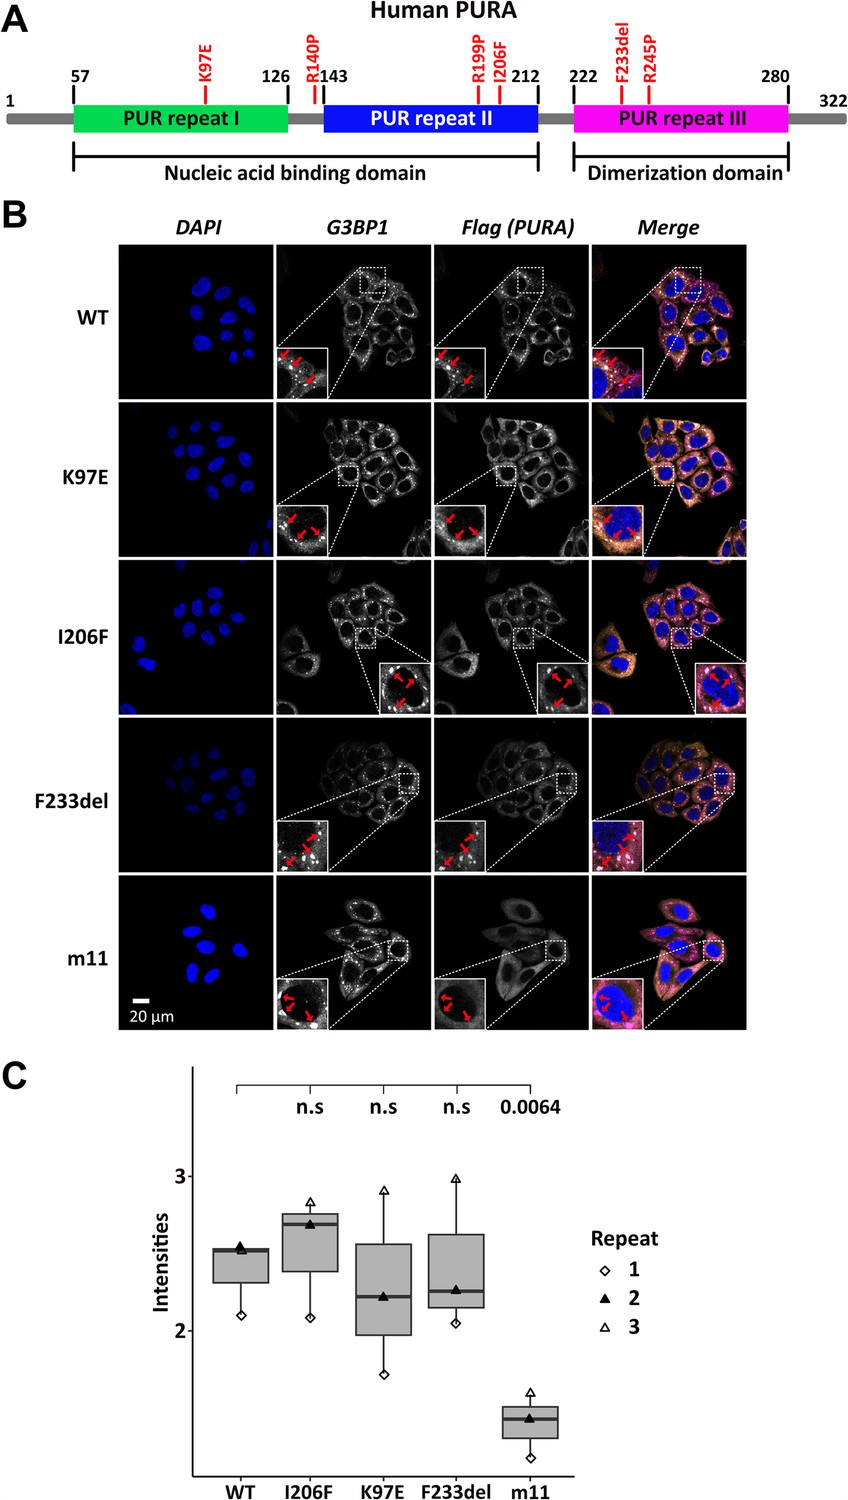
Stress-granule localization of hsPURA depends on its ability to bind RNA.
(A) Schematic overview of the hsPURA protein. Patient-derived mutations experimentally assessed in this study are marked in red. (B) In HeLa cells stress granules were identified by G3BP1 immunostaining (magenta) and overexpressed hsPURA (yellow) by its N-terminal Flag-tag. Nuclei were stained with DAPI (4',6-diamidino-2-phenylindole; blue). Representative stress granules are marked with red arrows in the zoomed-in area. Except for hsPURA m11, all overexpressed versions of hsPURA (wild-type and mutant) showed strong stress-granule localization. (C) Box–Whiskers plot of quantified intensities of hsPURA staining in stress granules above cytoplasmic background levels upon arsenite-induced stress treatment (see A). Three biological replicates (indicated by different icons) with 66 stress granules each were quantified for each cell line. Box–Whiskers plot of average signal intensity per repeat in each cell line. No significant difference was detected between patient-related genetic variations and wild-type (WT). Only for the m11 mutant protein the association to stress granules was significantly reduced (p = 0.0064), indicating the requirement of RNA binding for stress-granule association. p-value was calculated using unpaired two-sided Student’s t-test of mutated protein compared to WT control.
Figure 1—figure supplement 1
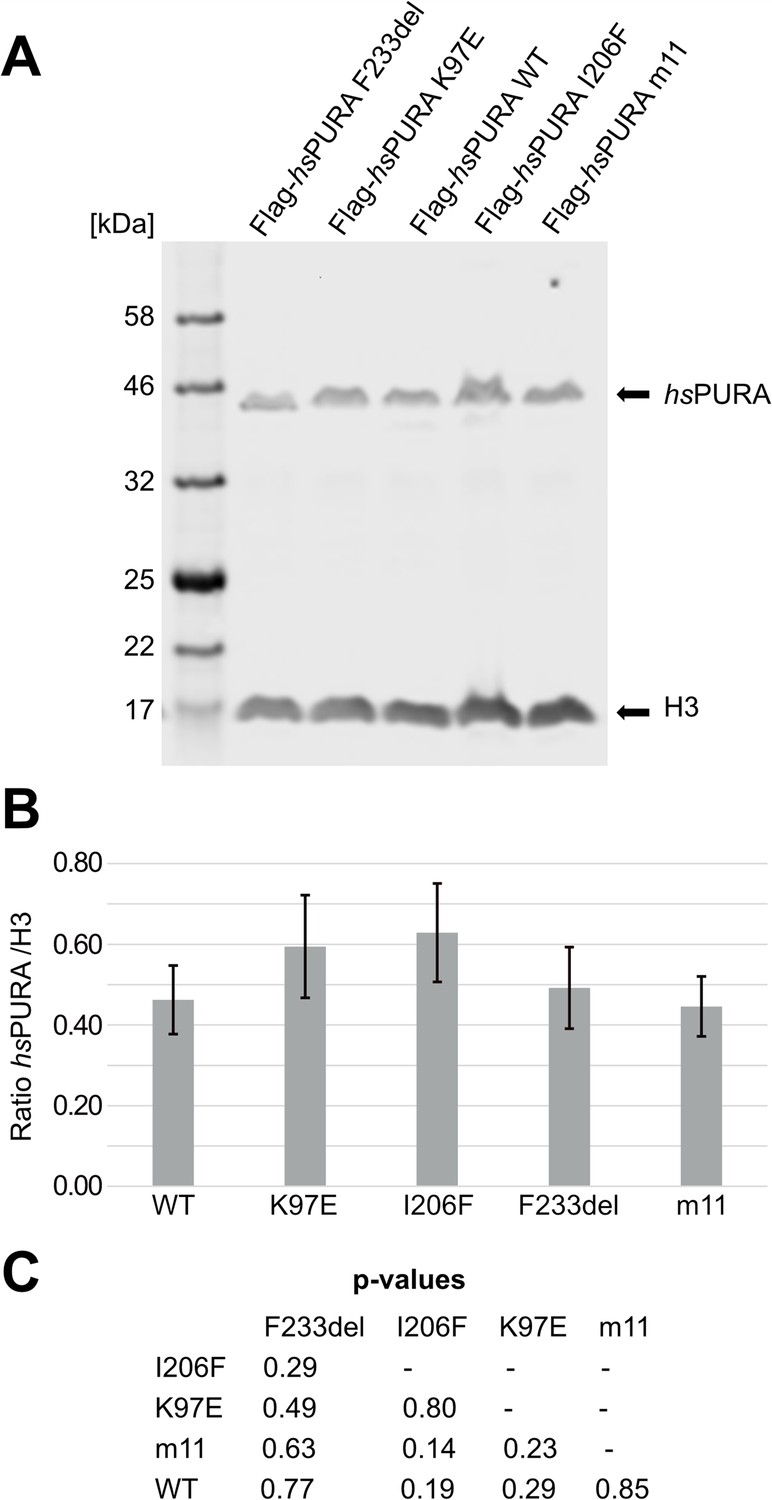
Quantitative western blot of cell lysate of cell lines used for the immunofluorescence (IF) staining assays.
(A) Used cell lines were doxycycline-induced HeLa overexpression cell lines. Cells were induced 16 hr before harvesting, washed twice with phosphate-buffered saline (PBS) and lysed in 2× sodium dodecyl sulfate (SDS) Laemmli buffer. For the western blot, commercial antibodies for H3 and Flag were used. H3 was used as a housekeeping marker to quantify the amount of overexpressed protein. The blot shown here is one representative of three replicates (n = 3). (B) Quantification of the western blots of the IF cell lines. Values represent means ± standard deviation (SD; n = 3). No statistically significant difference between cell lines was observed with p < 0.05 by analysis of variance (ANOVA). (C) Pairwise t-test confirmed no significant differences between cell lines. All p-values are above 0.05.
-
Figure 1—figure supplement 1—source data 1
Quantitative western blot of cell lysate of cell lines used for the immunofluorescence staining assays – uncropped, raw image.
- https://cdn.elifesciences.org/articles/93561/elife-93561-fig1-figsupp1-data1-v1.pdf
-
Figure 1—figure supplement 1—source data 2
Quantitative western blot of cell lysate of cell lines used for the immunofluorescence staining assays – uncropped, labeled image.
- https://cdn.elifesciences.org/articles/93561/elife-93561-fig1-figsupp1-data2-v1.zip
Figure 1—figure supplement 2
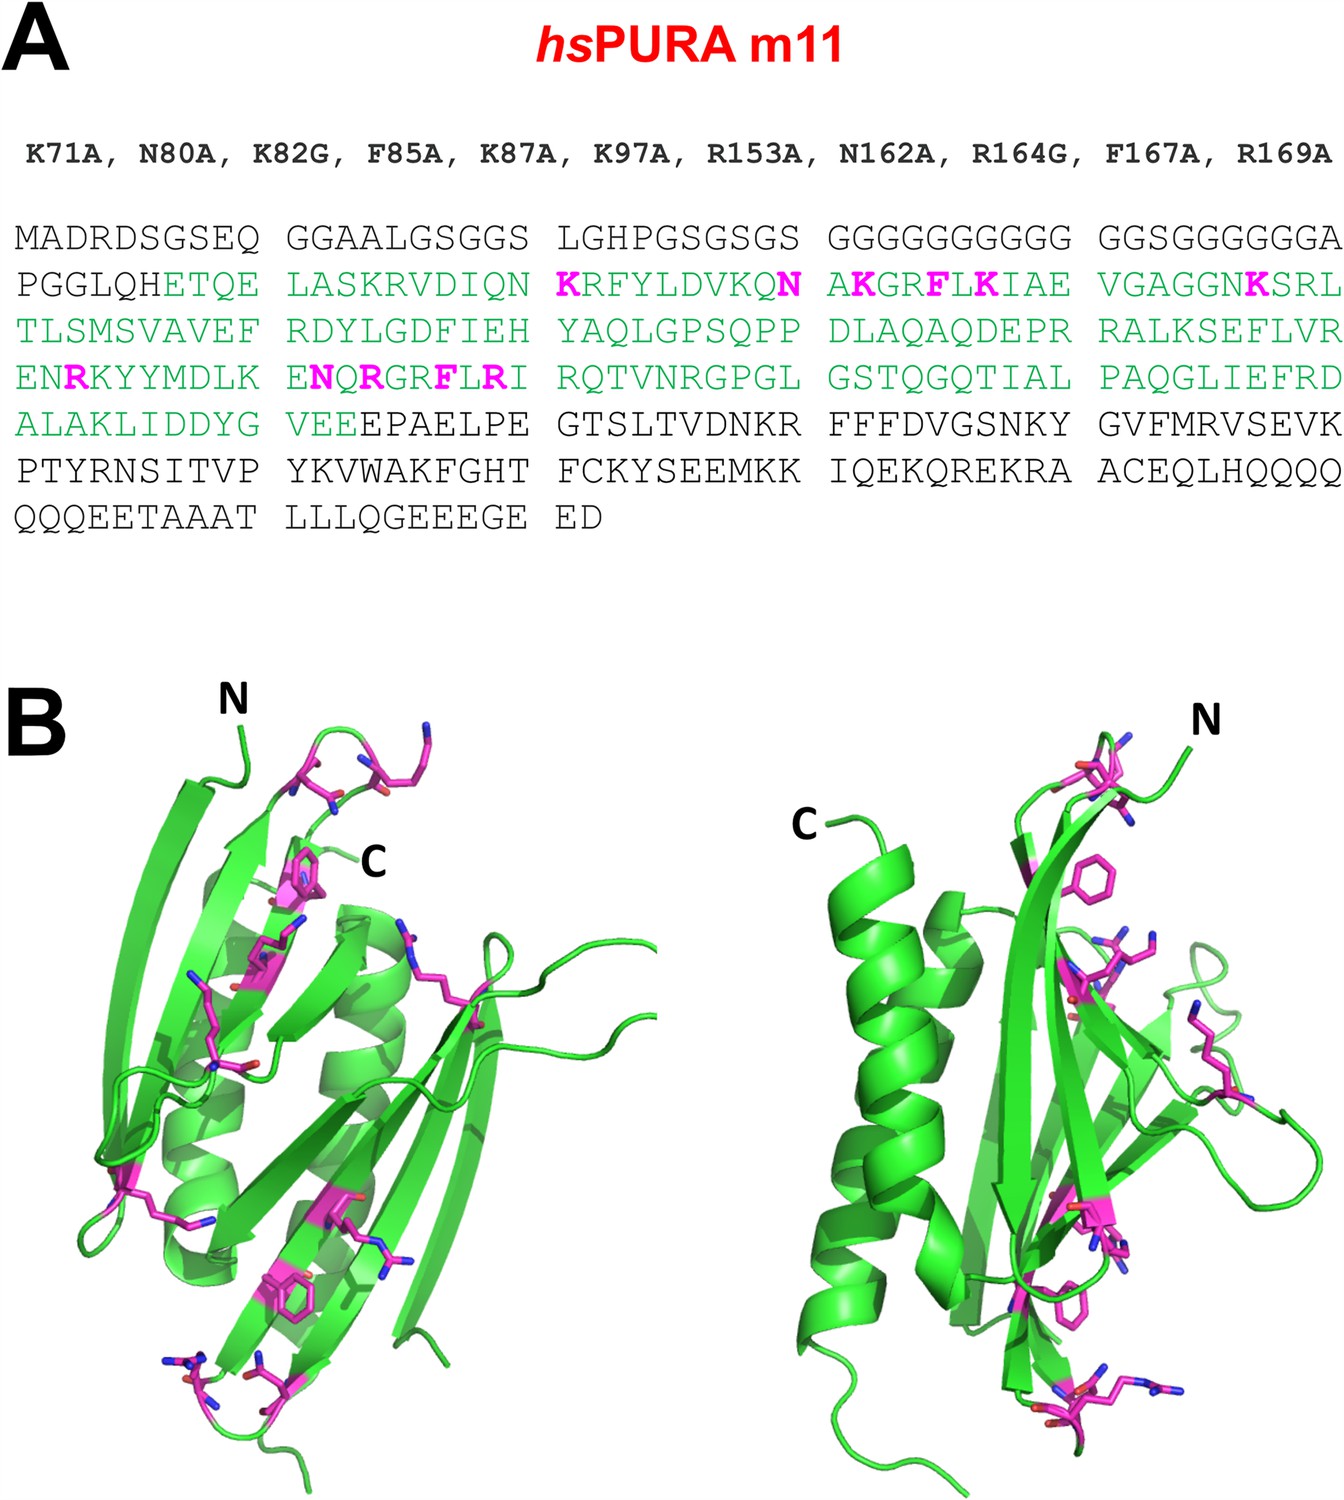
RNA-binding-deficient hsPURA I–II m11 variant.
(A) The amino acid sequence of the full-length hsPURA protein with the residues constituting the repeats I and II shown in green. Eleven residues that underwent structure-guided point mutations are marked in magenta. (B) The crystal structure of wild-type hsPURA I–II (green ribbon) is shown in two different orientations. The residues which are mutated in the m11 variant are shown as sticks in magenta. These mutations were designed to abolish the interaction of hsPURA with nucleic acids.
Figure 1—figure supplement 3
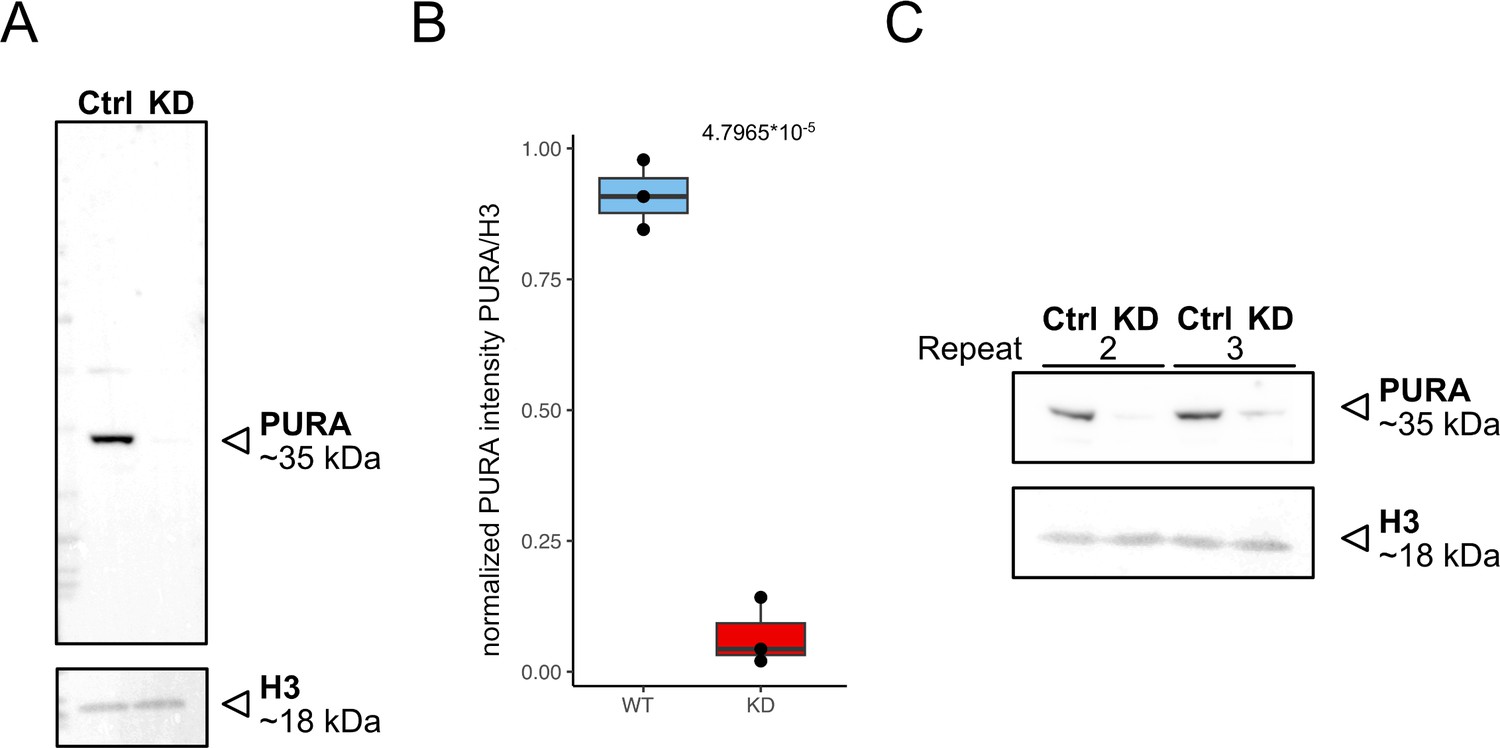
Validation of knockdown efficiency.
(A) Western blot of control (scrambled sirRNA) and PURA knockdown HeLa cells anti-PURA and H3 as housekeeping gene. (B) Quantification of relative PURA intensity normalized to H3 intensity (n = 3). Pairwise t-test shows significant differences between cell lines. (C) Western blot of repeats 2 and 3 of KD experiment used for quantification.
-
Figure 1—figure supplement 3—source data 1
Validation of knockdown efficiency.
Western blot of control (scrambled sirRNA) and PURA knockdown HeLa cells anti-PURA and H3 as housekeeping gene – uncropped, raw images.
- https://cdn.elifesciences.org/articles/93561/elife-93561-fig1-figsupp3-data1-v1.zip
-
Figure 1—figure supplement 3—source data 2
Validation of knockdown efficiency.
Western blot of control (scrambled sirRNA) and PURA knockdown HeLa cells anti-PURA and H3 as housekeeping gene – uncropped, labeled images.
- https://cdn.elifesciences.org/articles/93561/elife-93561-fig1-figsupp3-data2-v1.zip
Figure 1—figure supplement 4
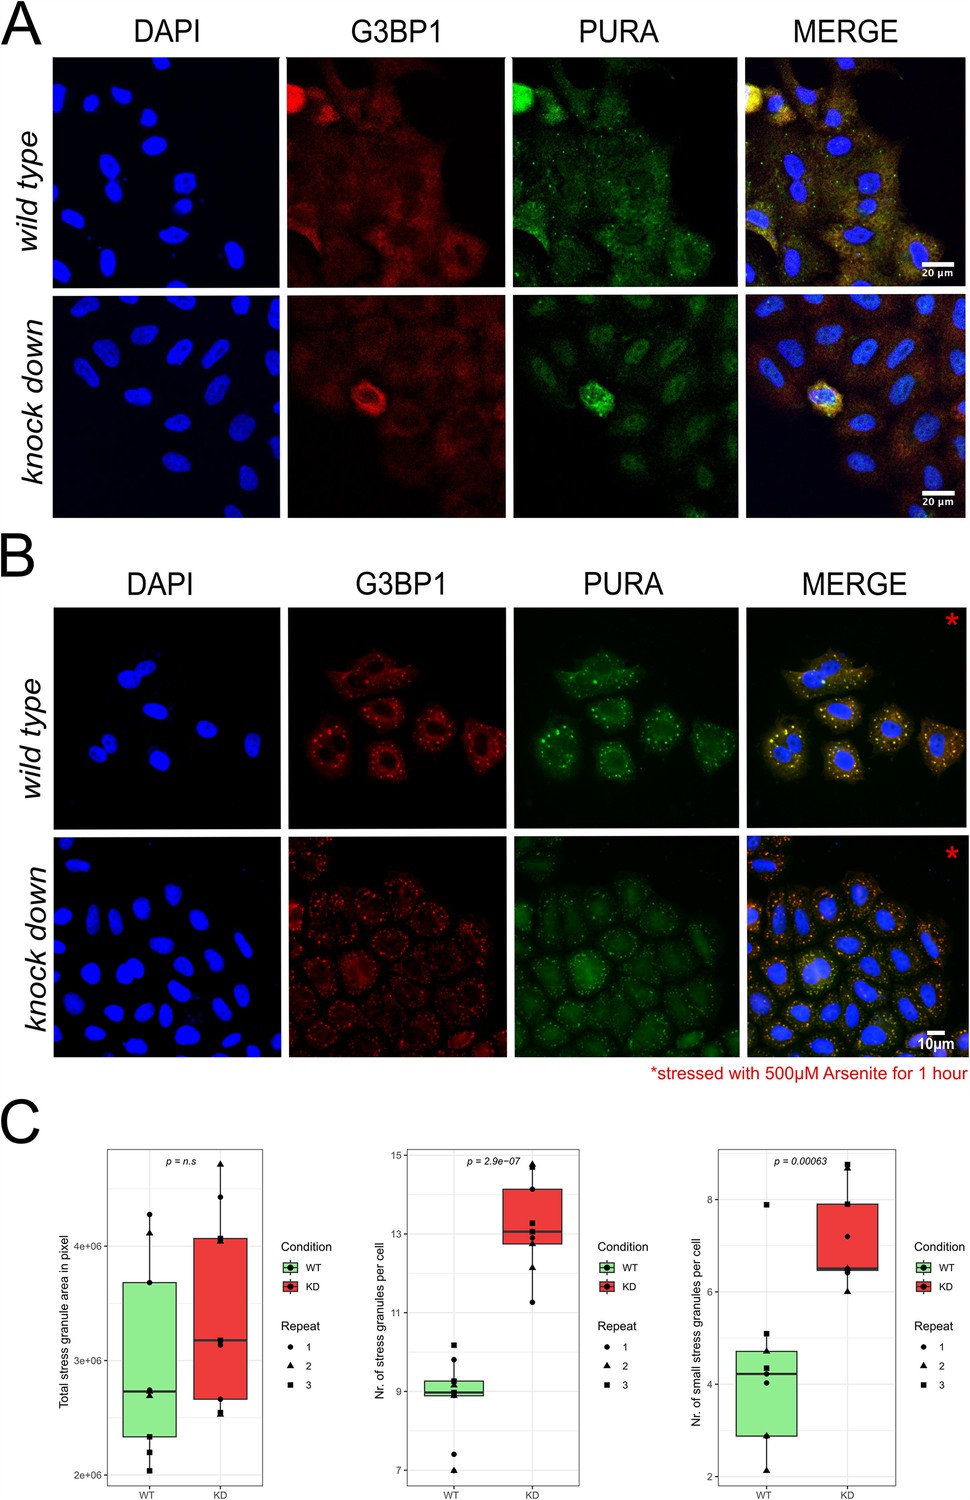
Stress-granule formation in HeLa wild-type versus PURA knockdown cells.
(A) Unstressed HeLa wild-type versus PURA knockdown cells stained with the stress-granule marker G3BP1 (red) and PURA (green). No stress granules can be detected by G3BP1 staining. (B) Arsenite-stressed HeLa wild-type versus PURA knockdown cells stained with the stress-granule marker G3BP1 (red) and PURA (green). (C) Quantification of stress granules per cell in wild-type versus knockdown (KD) HeLa cells under stress conditions shown in (B). While no significant difference can be observed in the overall area of all microscopically visible stress granules (left), significantly more granule number appeared in knockdown cells (middle). Stress granules were defined as entities with ≥0.7 µm in diameter and small stress granules as entities with 0.3–0.7 µm in diameter.
Figure 2 with 1 supplement
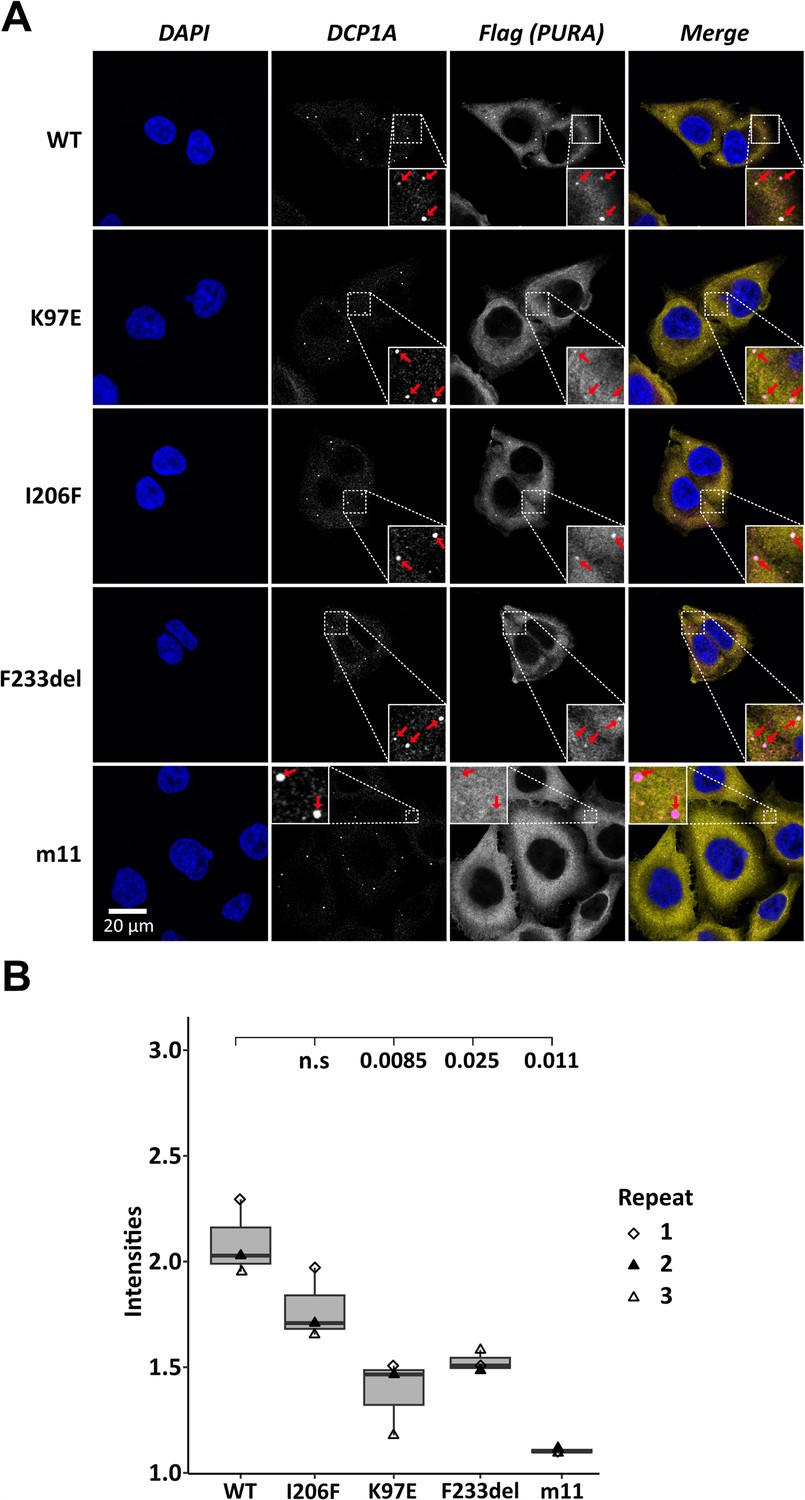
Processing-body association of hsPURA in HeLa cells is impaired by patient-derived mutations.
(A) P-bodies were identified by immunostaining against DCP1A and against the N-terminal FLAG-tag of overexpressed hsPURA FL. Whereas their individual staining is shown in white, the overlay of DCP1A and FLAG is shown in magenta and yellow, respectively. Nuclei were stained with DAPI (blue). All cell lines show P-body formation, marked with red arrows in the zoomed area. (B) Box–Whiskers plots of quantification of intensities of hsPURA staining in P-bodies above cytoplasmic background levels. For each cell line, three biological replicates (indicated by different icons) with each 100 P-bodies were quantified, and Box–Whiskers plot generated for each cell line. Significantly lower P-body localization was observed for the K97E (p = 0.0085), F2333del (p = 0.025), and m11 (p = 0.011) variants of hsPURA. p-values were calculated using unpaired two-sided Student’s t-test of mutant compared to WT control.
Figure 2—figure supplement 1
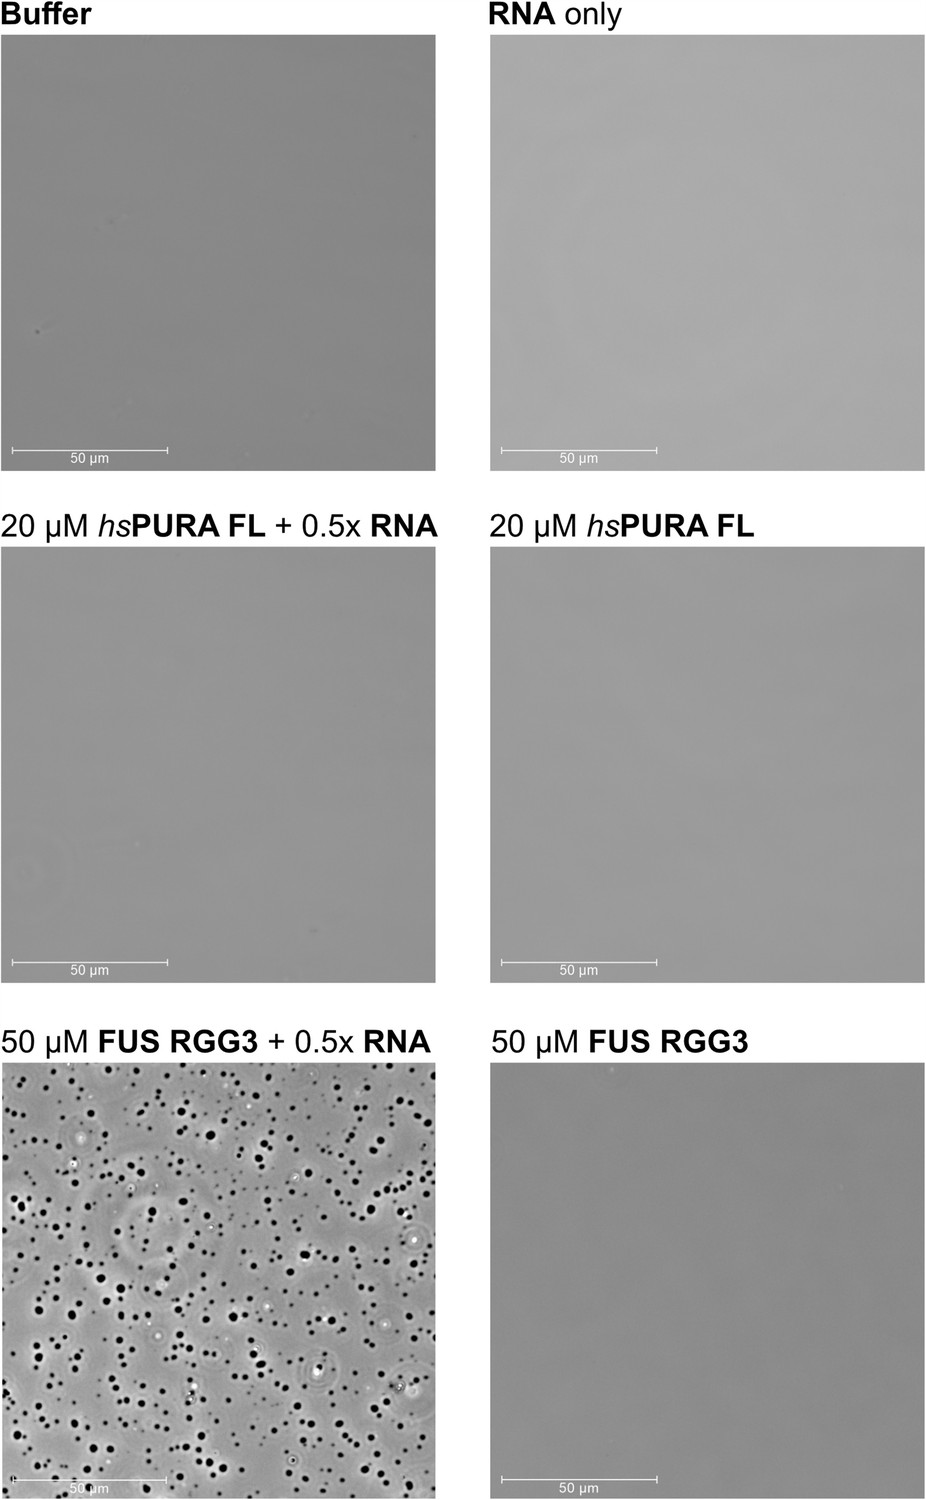
hsPURA does not undergo phase separation.
The phase separation experiment was performed with full-length hsPURA alone and with total HeLa RNA. As a positive control for RNA-dependent phase separation the unstructured FUS RGG3 protein fragment was used (Dormann et al., 2012). No liquid-phase separation was observed with hsPURA either in absence or presence of RNA.
Figure 3 with 4 supplements
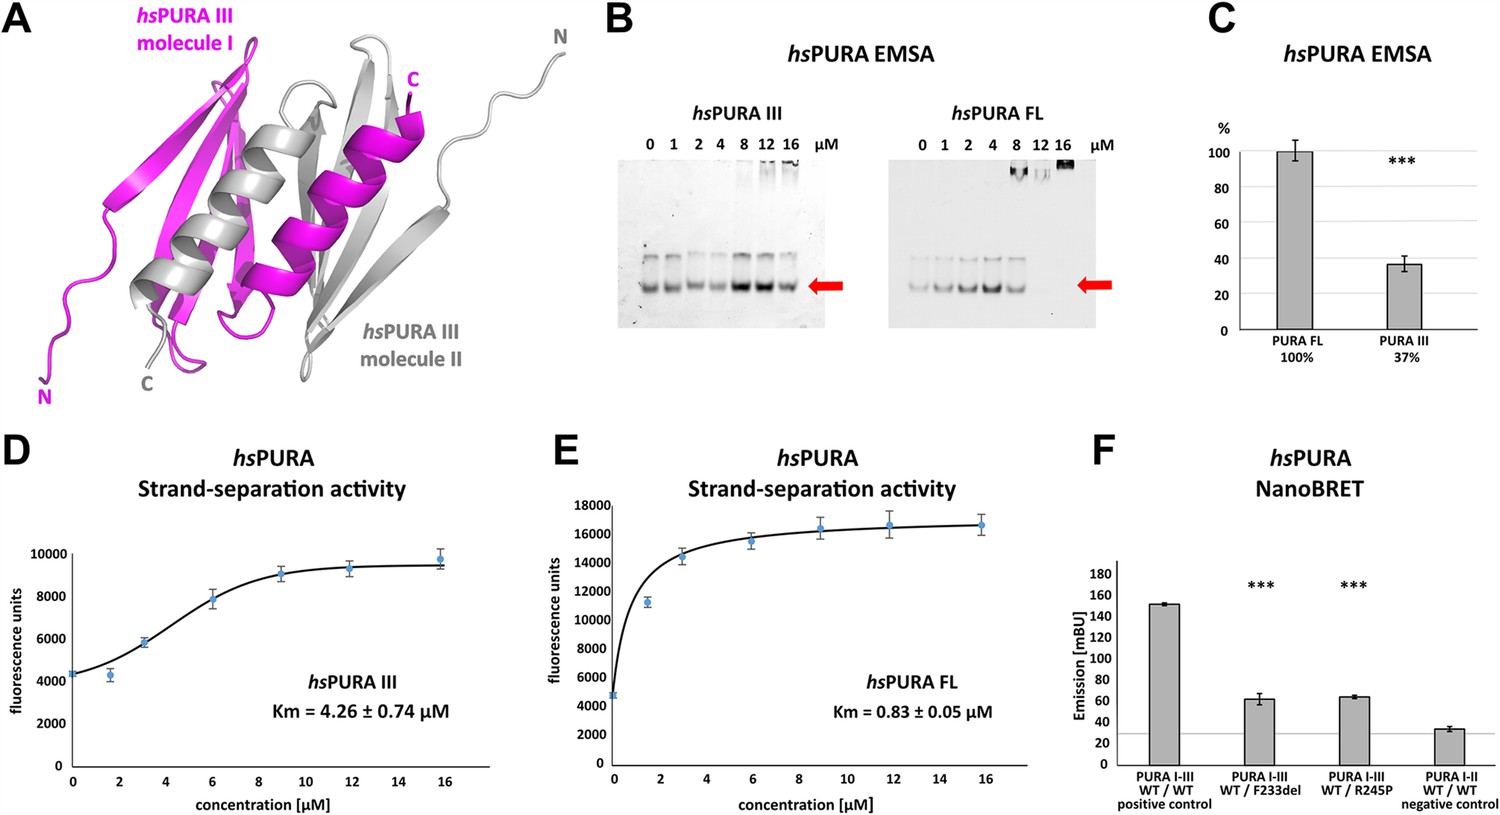
Crystal structure of C-terminal PUR domain from hsPURA and effects of mutations on its function.
(A) Crystal structure of hsPURA III at 1.7 Å resolution (PDB ID: 8CHW). Two hsPURA III molecules (magenta and gray, respectively) form a homodimer. Like other PUR domains (e.g. hsPURA I–II), hsPURA repeat III consists of four β-sheets and one α-helix. (B) In electrophoretic mobility shift assays (EMSAs) the interaction of hsPURA FL and hsPURA III with a 24-mer (CGG)8 RNA fluorescently labeled with Cy5 fluorophore at 5′-end was observed. The amount of the RNA was kept constant at 8 nM while the protein concentration increased from 0 to 16 μM. The unbound RNA used for quantification (see E) is indicated with red arrows. (C) Apparent affinities derived from EMSAs (C) indicate that the C-terminal PUR domain is also able to interact with the nucleic acids. Pairwise t-tests of the hsPURA fragments showed significantly lower RNA binding compared to the full-length protein (hsPURA III: p = 9.6E−4). Three replicates were measured for each experiment and protein variant, and the standard deviations have been calculated and shown as bars. (D, E) Strand-separation activity of hsPURA. The graphs show the averaged values of three independent experiments as dots with standard deviations as error bars. (D) The hsPURA III fragment shows sigmoidal increase of the ssDNA concentration measured as a fluorescent signal. For the quantification of the sigmoidal curves, we utilized Boltzmann function implemented in the Origin software. Calculated x0, which corresponds to the Km in this assay yields 4.26 ± 0.74 µM. (E) Strand-separation activity of full-length hsPURA was calculated with Michaelis–Menten kinetic, yielding an average Km value of 0.83 ± 0.05 µM, respectively. For both hsPURA samples at least three independent measurements have been performed. (F) NanoBRET experiments in HEK293 cells with different hsPURA fragment-expressing constructs. Milli-BRET units (mBU) were measured for dimerization of hsPURA I–III with hsPURA I–III, hsPURA I–III F233del, and hsPURA I–III R245P. Pairwise t-tests of the mutant hsPURA I–III versions F233del and R245P yielded significantly lower signals compared to the wild-type protein (hsPURA I–III F233del: p = 3.3E−4; hsPURA I–III R245P: p = 1.5E−7), indicating impaired interactions between the proteins. Black horizontal line shows reference of mBU obtained for hsPURA I–II as negative control. Of note, since the BRET signal is the ratio of donor and acceptor signal, it does not require normalization for expression levels. Asterisks in (C) and (F) indicate significance level: *** for p ≤ 0.001.
-
Figure 3—source data 1
Electrophoretic mobility shift assays (EMSAs) for the interaction of hsPURA variants with a 24-mer (CGG)8 RNA fluorescently labeled with Cy5 fluorophore at 5′-end.
Uncropped, raw EMSA gel image for hsPURA III.
- https://cdn.elifesciences.org/articles/93561/elife-93561-fig3-data1-v1.pdf
-
Figure 3—source data 2
Electrophoretic mobility shift assays (EMSAs) for the interaction of hsPURA variants with a 24-mer (CGG)8 RNA fluorescently labeled with Cy5 fluorophore at 5′-end.
Uncropped, labeled EMSA gel image for hsPURA III.
- https://cdn.elifesciences.org/articles/93561/elife-93561-fig3-data2-v1.zip
-
Figure 3—source data 3
Electrophoretic mobility shift assays (EMSAs) for the interaction of hsPURA variants with a 24-mer (CGG)8 RNA fluorescently labeled with Cy5 fluorophore at 5′-end.
Uncropped, raw EMSA gel image for hsPURA FL.
- https://cdn.elifesciences.org/articles/93561/elife-93561-fig3-data3-v1.zip
-
Figure 3—source data 4
Electrophoretic mobility shift assays (EMSAs) for the interaction of hsPURA variants with a 24-mer (CGG)8 RNA fluorescently labeled with Cy5 fluorophore at 5′-end.
Uncropped, labeled EMSA gel image for hsPURA FL.
- https://cdn.elifesciences.org/articles/93561/elife-93561-fig3-data4-v1.zip
Figure 3—figure supplement 1
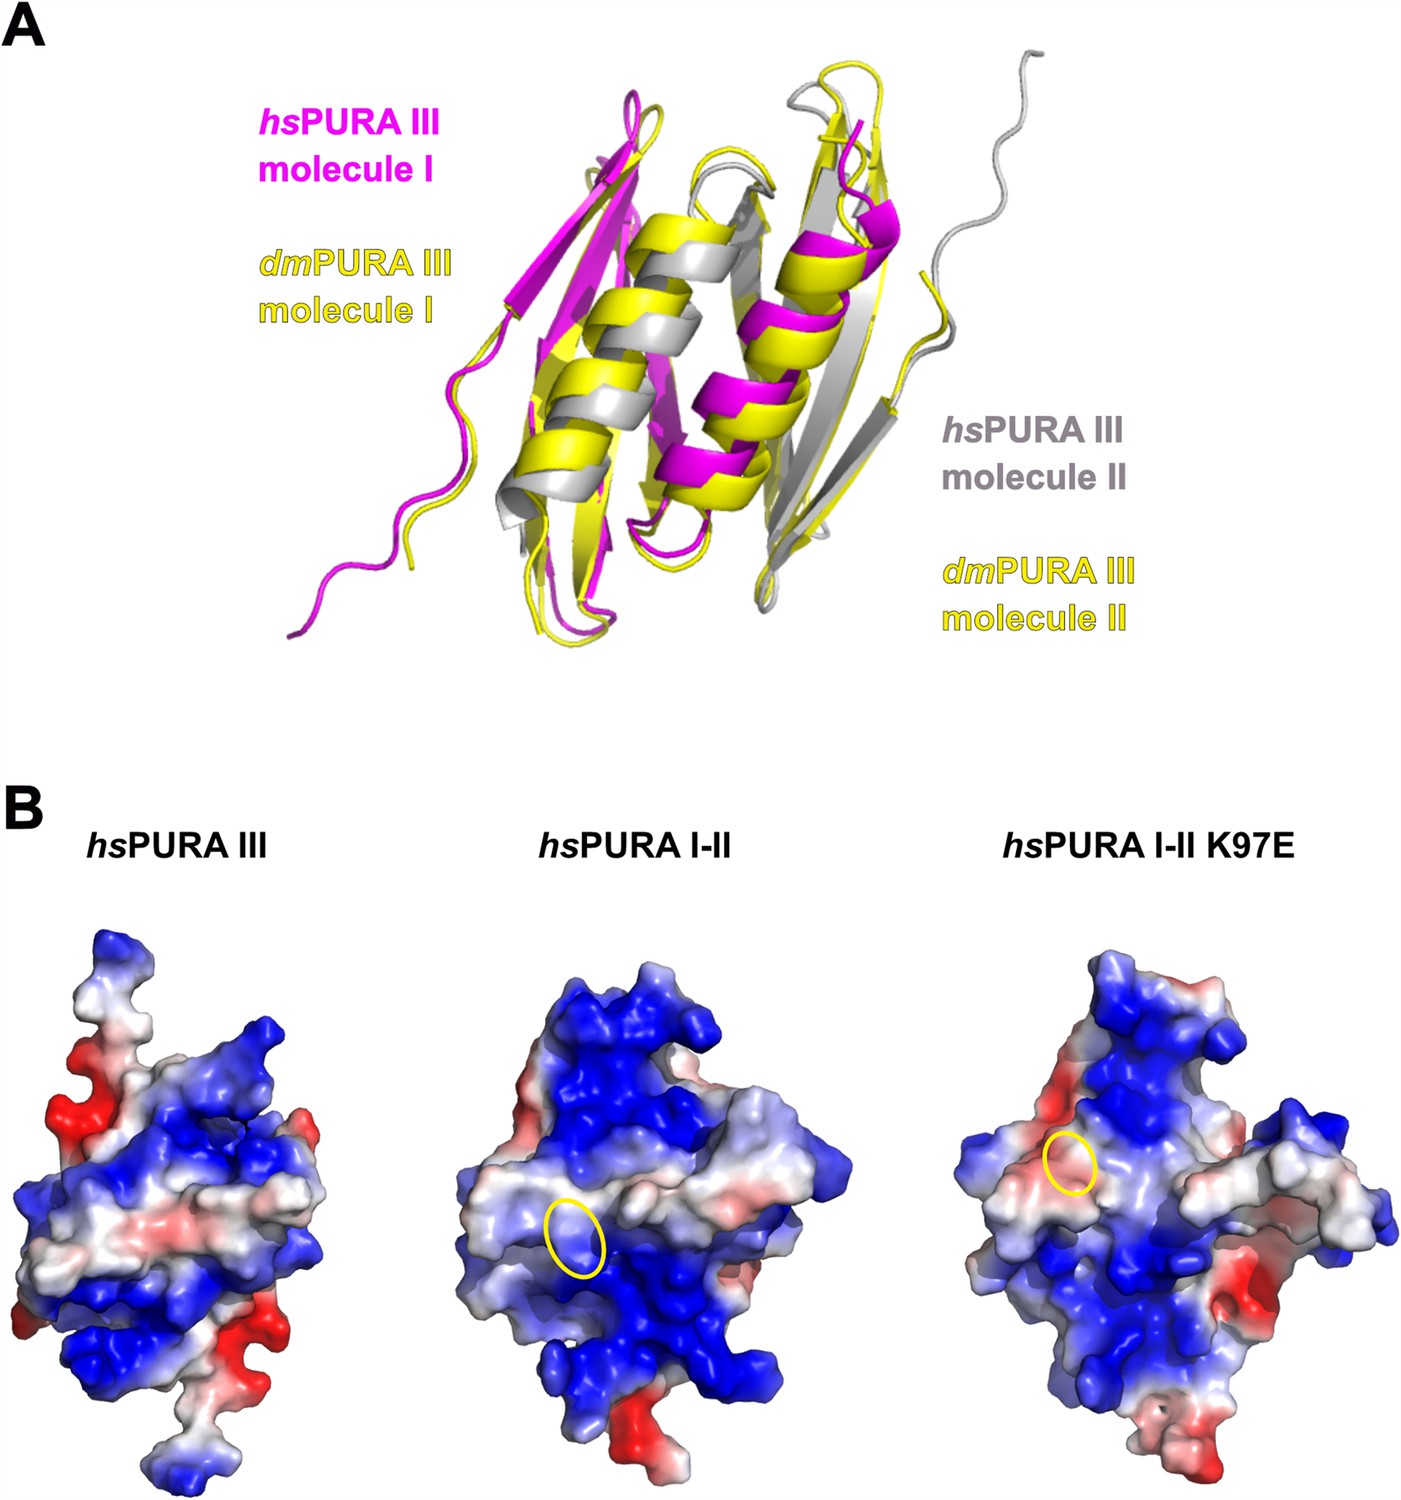
Analysis and comparison of the crystal structure of hsPURA repeat I-II and III.
(A) Superposition of the crystal structure of the hsPURA repeat III homodimer at 1.7 Å resolution (PDB ID: 8CHW; chains shown as magenta and gray ribbons) with its D. melanogaster homologue dmPURA III (PDB ID: 5FGO; both chains shown as yellow ribbons). The hsPURA III dimer shows high structural similarity to dmPURA III with root mean square deviation (r.m.s.d.) of 1.26 Å for 125 superimposed Cα atoms and 50% of sequence identity. (B) The surface electrostatic potentials for hsPURA III (left), hsPURA I–II (middle), and hsPURA I–II K97E (right). All three structures are oriented with the nucleic binding sites facing toward the reader. The position of K97 in wild-type hsPURA I–II and E97 in hsPURA II–II K97E is encircled.
Figure 3—figure supplement 2

Structural features likely contributing to the PURA-dependent unwinding of dsRNA.
Superposition of the hsPURA I–II crystal structure (PDB ID: 8CHT; repeat I in green and II in blue) with the previously published structure of the PURA I–II fragment from D. melanogaster (gray ribbon model) in complex with DNA (shown in red) (PDB ID: 5FGP). The structure is presented in two different orientations. The β-ridge is highlighted by the magenta square and label. The position of the residue 97 is shown in yellow and labeled accordingly.
Figure 3—figure supplement 3
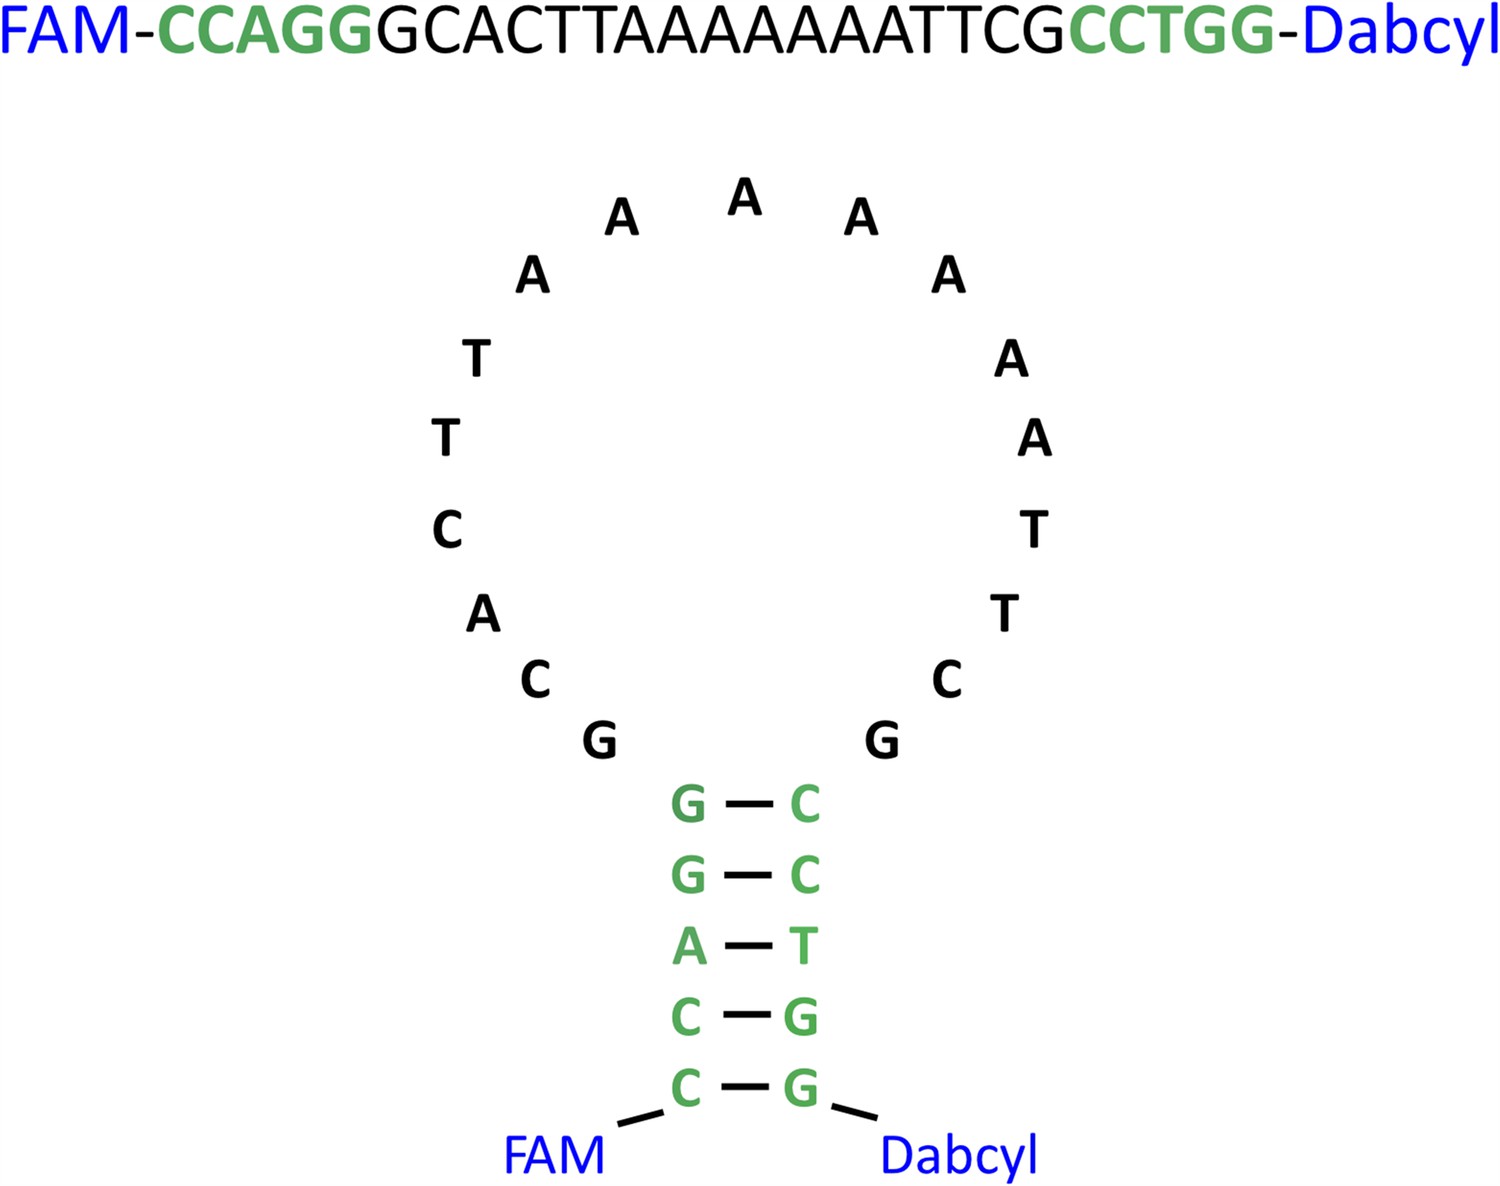
The strand-separation activity assay DNA probe.
The primary and secondary structures of the DNA oligo with 5′-labeled FAM fluorophore and 3′-labeled Dabcyl quencher.
Figure 3—figure supplement 4
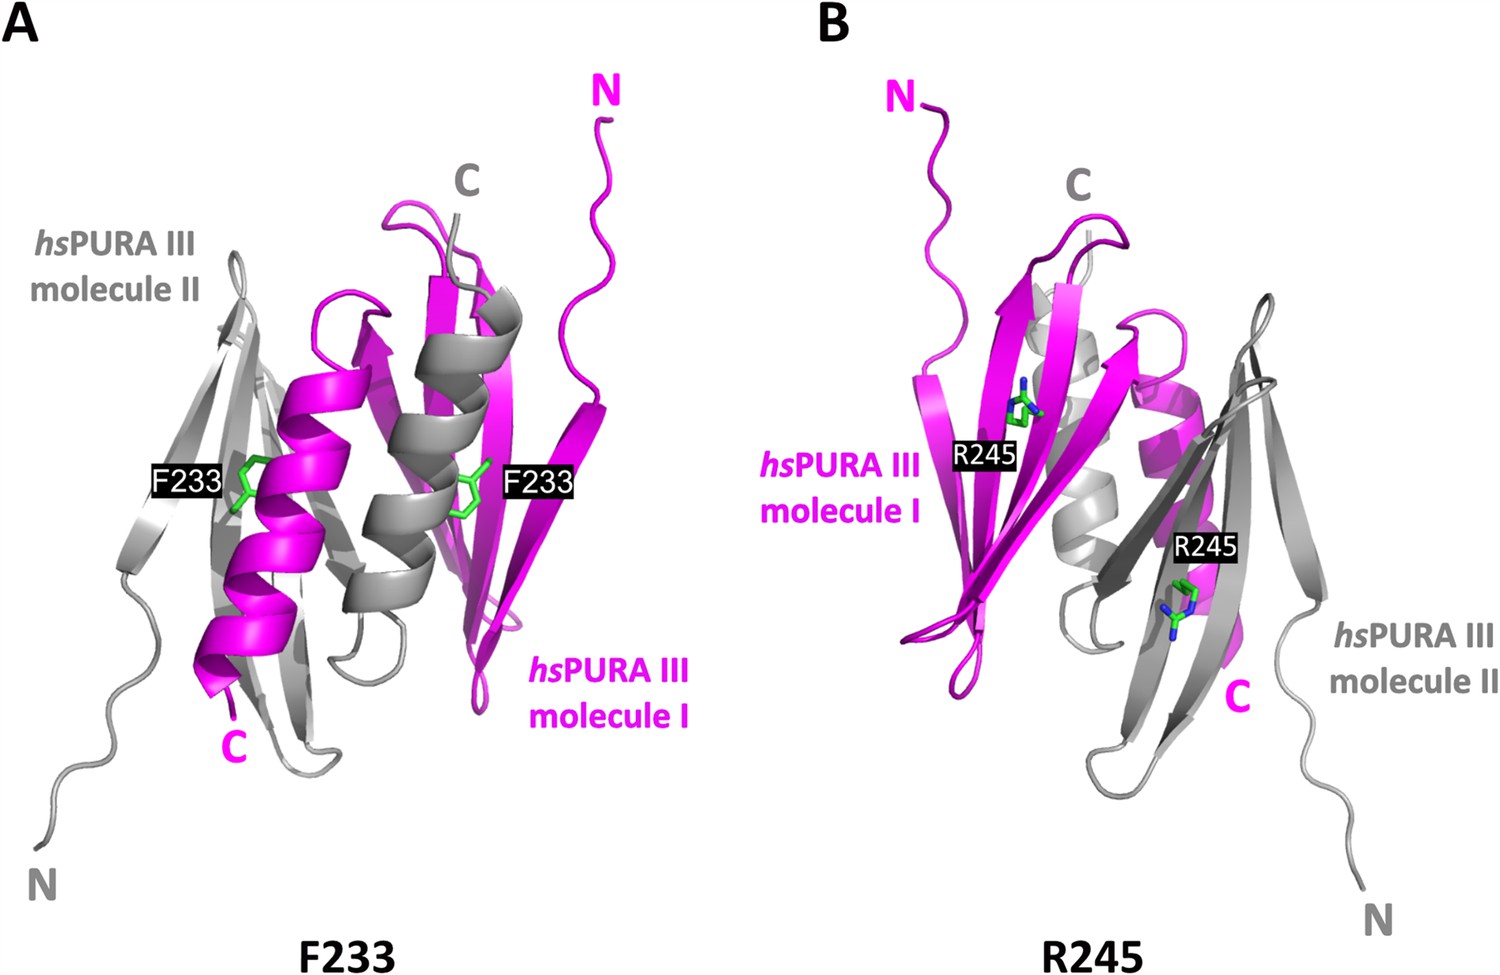
The crystal structure of the hsPURA III homodimer.
(A) The crystal structure of the hsPURA III homodimer at 1.7 Å resolution (PDB ID: 8CHW) with the residues F233 shown as green sticks and labeled. (B) The crystal structure of the hsPURA III homodimer at 1.7 Å resolution (PDB ID: 8CHW) with the residues R245 shown as green sticks and labeled.
Figure 4 with 1 supplement
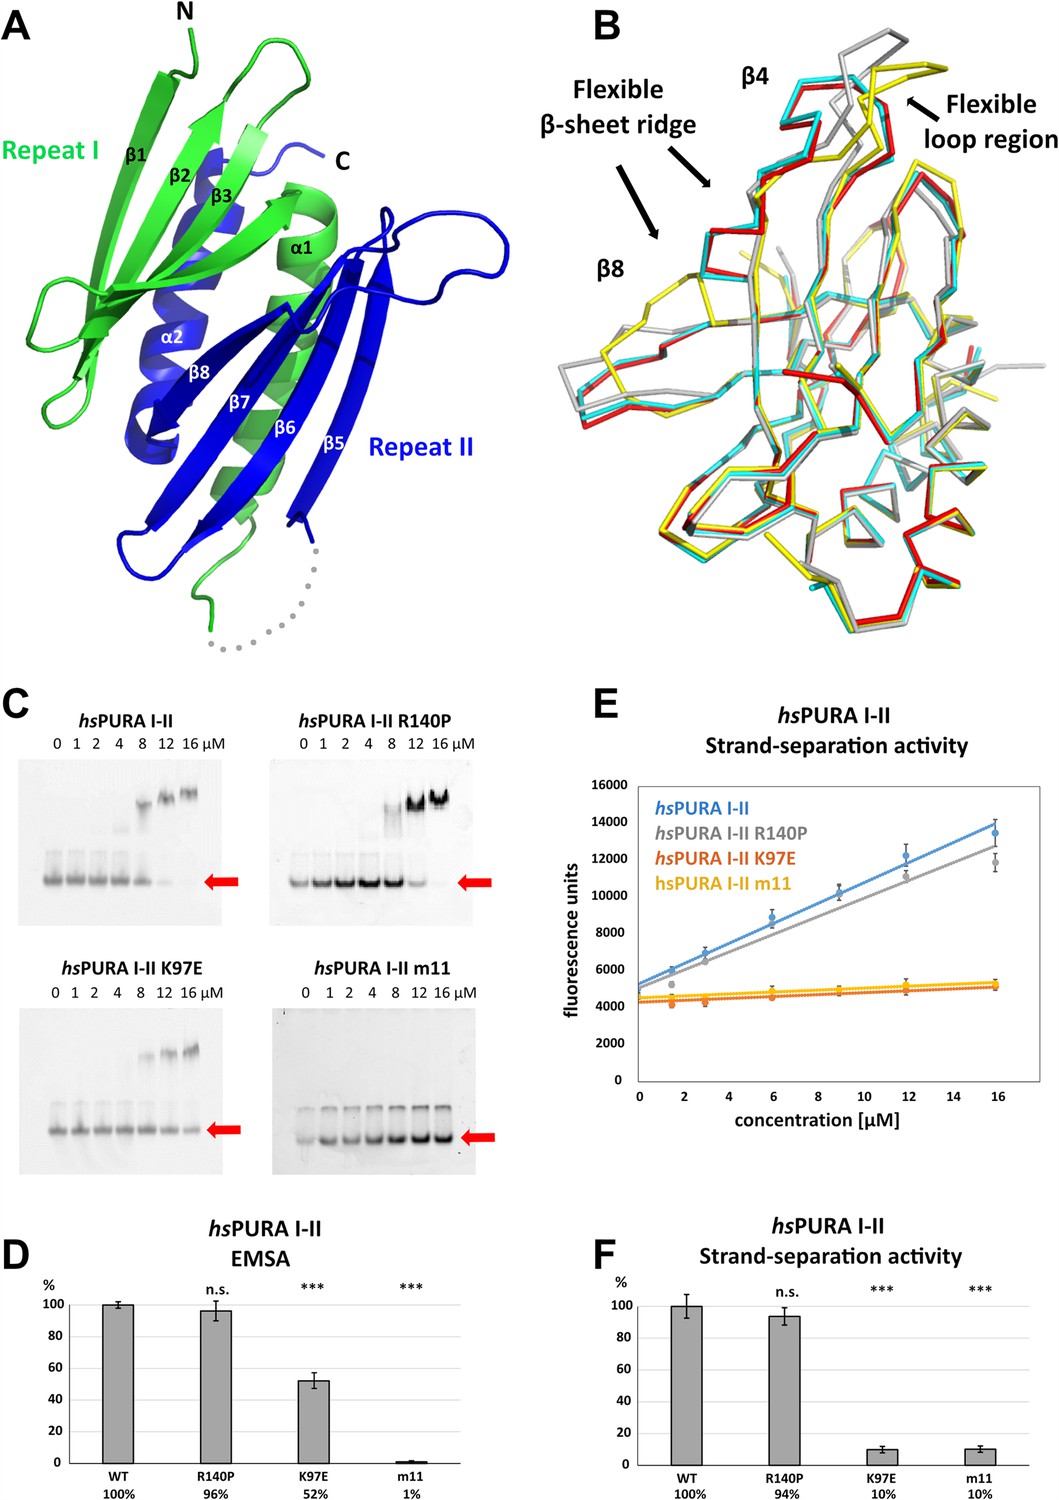
Structure and nucleic acids interaction of the N-terminal PUR domain.
(A) Crystal structure of wild-type hsPURA repeats I (green) and II (blue) at 1.95 Å resolution. Protein fragment for which no electron density was visible is shown as a gray dotted line. (B) Ribbon presentation of the overlay of all four chains (shown in different colors) of hsPURA I–II in the asymmetric unit of the crystal. There are three regions showing greater differences in folding between these individual molecules, indicating that they are flexible and likely adopt several conformations also in solution. (C) In electrophoretic mobility shift assays (EMSAs), the interaction of different hsPURA I–II variants with 24-mer RNA (CGG)8 labeled with Cy5-fluorophore was observed. The amount of labeled RNA was kept constant at 8 nM while the protein concentration increased from 0 to 16 μM. The unbound RNA was used for quantification (see D) and is indicated with the red arrow. Above the unbound RNA a second band of free RNA is visible, which might constitute a different conformation or RNA dimer. (D) Quantification of the RNA interactions of different hsPURA I–II variants from EMSAs shown in (C). The RNA-binding affinity of wild-type hsPURA was normalized to 100%. Pairwise t-test was used to assess differences in RNA binding compared to the hsPURA I–II. The variants K97E and m11 showed significantly lower relative affinities (p = 1.5E−05 and p = 4.6E−09, respectively). In contrast, the variant R140P did not alter binding affinity (p = 0.5). (E) Strand-separation activity of different hsPURA variants. For each hsPURA sample at least three measurements has been performed. The graphs show the averaged values as points as well as the standard deviations as error bars. The strand-separation activity shows linear increase within the used concentration range. (F) Quantitative representation of strand-separating activity of the hsPURA I–II variants. The strand-separating activity of hsPURA I–II was quantified from the slope in (E) and normalized to 100%. Except for R140P (p = 0.07), pairwise t-tests of the hsPURA I–II variants showed significantly lower relative activity (K97E p = 3.9E−16 and m11 p = 9.2E−16) than hsPURA I–II. For each experiment and each protein variant three replicates were measured, the standard deviations were calculated and are shown as bars. Asterisks in (D) and (F) indicate significance level: *** for p ≤ 0.001; n.s. for p > 0.05.
-
Figure 4—source data 1
Electrophoretic mobility shift assays (EMSAs) for the interaction of hsPURA variants with a 24-mer (CGG)8 RNA fluorescently labeled with Cy5 fluorophore at 5′-end.
Uncropped, raw EMSA gel image for hsPURA I–II.
- https://cdn.elifesciences.org/articles/93561/elife-93561-fig4-data1-v1.pdf
-
Figure 4—source data 2
Electrophoretic mobility shift assays (EMSAs) for the interaction of hsPURA variants with a 24-mer (CGG)8 RNA fluorescently labeled with Cy5 fluorophore at 5′-end.
Uncropped, labeled EMSA gel image for hsPURA I–II.
- https://cdn.elifesciences.org/articles/93561/elife-93561-fig4-data2-v1.zip
-
Figure 4—source data 3
Electrophoretic mobility shift assays (EMSAs) for the interaction of hsPURA variants with a 24-mer (CGG)8 RNA fluorescently labeled with Cy5 fluorophore at 5′-end.
Uncropped, raw EMSA gel image for hsPURA I–II R140P.
- https://cdn.elifesciences.org/articles/93561/elife-93561-fig4-data3-v1.zip
-
Figure 4—source data 4
Electrophoretic mobility shift assays (EMSAs) for the interaction of hsPURA variants with a 24-mer (CGG)8 RNA fluorescently labeled with Cy5 fluorophore at 5′-end.
Uncropped, labeled EMSA gel image for hsPURA I–II R140P.
- https://cdn.elifesciences.org/articles/93561/elife-93561-fig4-data4-v1.zip
-
Figure 4—source data 5
Electrophoretic mobility shift assays (EMSAs) for the interaction of hsPURA variants with a 24-mer (CGG)8 RNA fluorescently labeled with Cy5 fluorophore at 5′-end.
Uncropped, raw EMSA gel image for hsPURA I–II K97E.
- https://cdn.elifesciences.org/articles/93561/elife-93561-fig4-data5-v1.zip
-
Figure 4—source data 6
Electrophoretic mobility shift assays (EMSAs) for the interaction of hsPURA variants with a 24-mer (CGG)8 RNA fluorescently labeled with Cy5 fluorophore at 5′-end.
Uncropped, labeled EMSA gel image for hsPURA I–II K97E.
- https://cdn.elifesciences.org/articles/93561/elife-93561-fig4-data6-v1.zip
-
Figure 4—source data 7
Electrophoretic mobility shift assays (EMSAs) for the interaction of hsPURA variants with a 24-mer (CGG)8 RNA fluorescently labeled with Cy5 fluorophore at 5′-end.
Uncropped, raw EMSA gel image for hsPURA I–II m11.
- https://cdn.elifesciences.org/articles/93561/elife-93561-fig4-data7-v1.zip
-
Figure 4—source data 8
Electrophoretic mobility shift assays (EMSAs) for the interaction of hsPURA variants with a 24-mer (CGG)8 RNA fluorescently labeled with Cy5 fluorophore at 5′-end.
Uncropped, labeled EMSA gel image for hsPURA I–II m11.
- https://cdn.elifesciences.org/articles/93561/elife-93561-fig4-data8-v1.zip
Figure 4—figure supplement 1
Superposition of human and Drosophila PURA I–II structure.
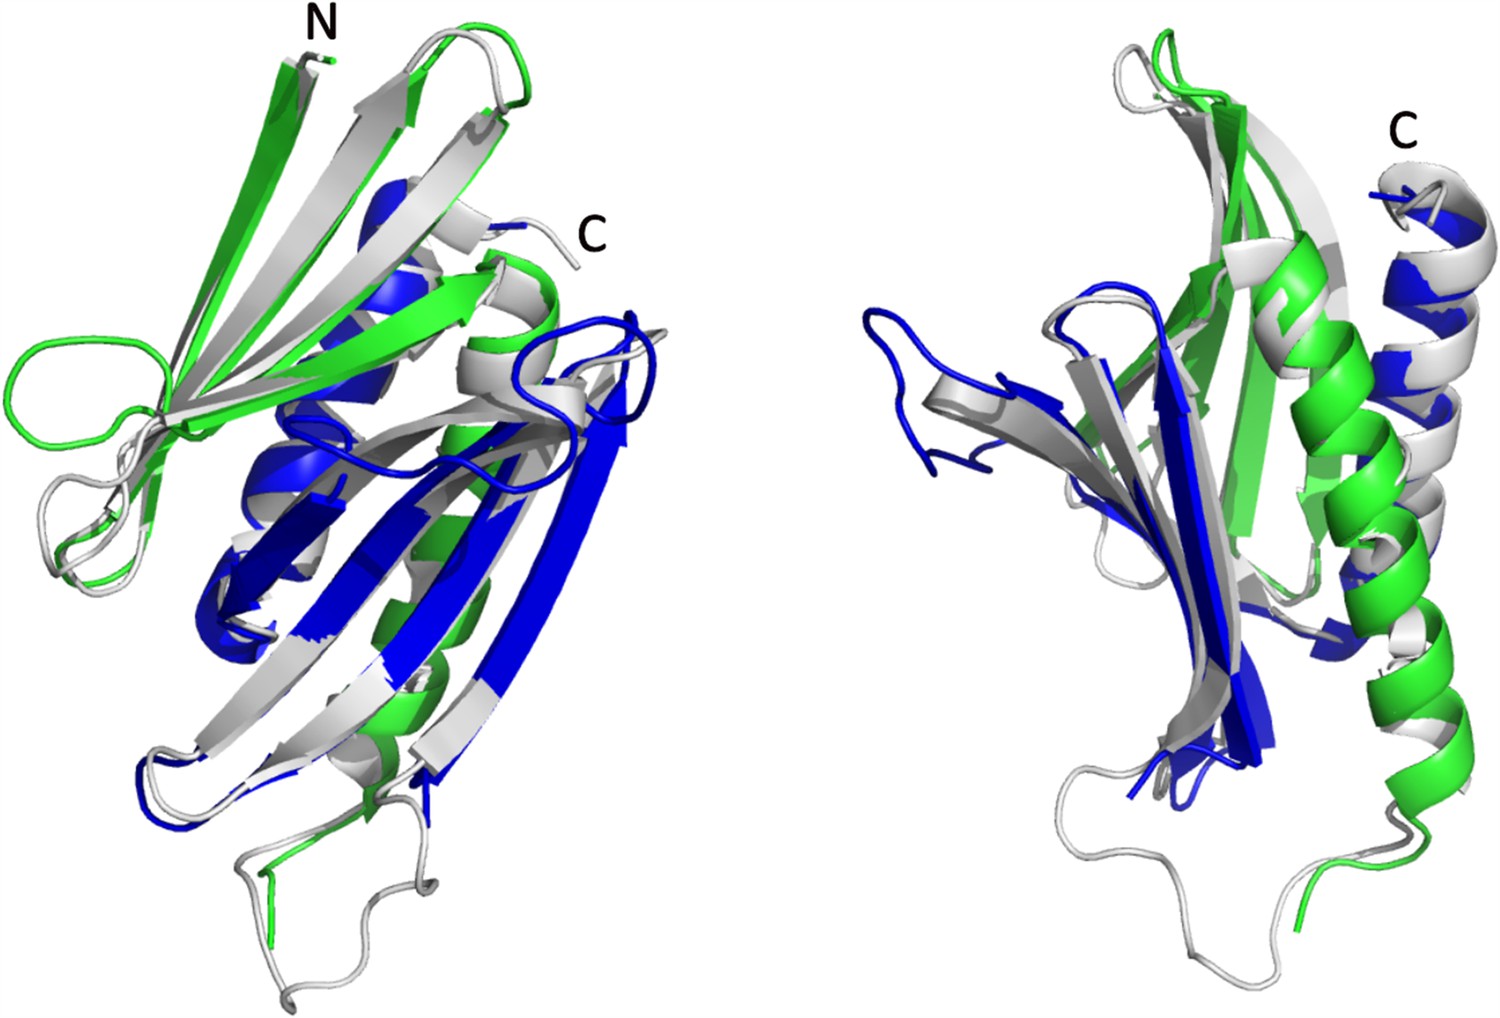
Superposition of hsPURA I–II structure (PDB ID: 8CHT; color code as in Figure 4A) with the previously published structure from Drosophila melanogaster (dmPURA I–II; PDB ID: 3K44; gray ribbon model), with a root mean square deviation (r.m.s.d.) of 0.97 Å for 131 superimposed Cα atoms. Superposition is shown in two different orientations.
Figure 5 with 3 supplements
Structural analysis of hsPURA I–II bearing the K97E patient-derived variant.
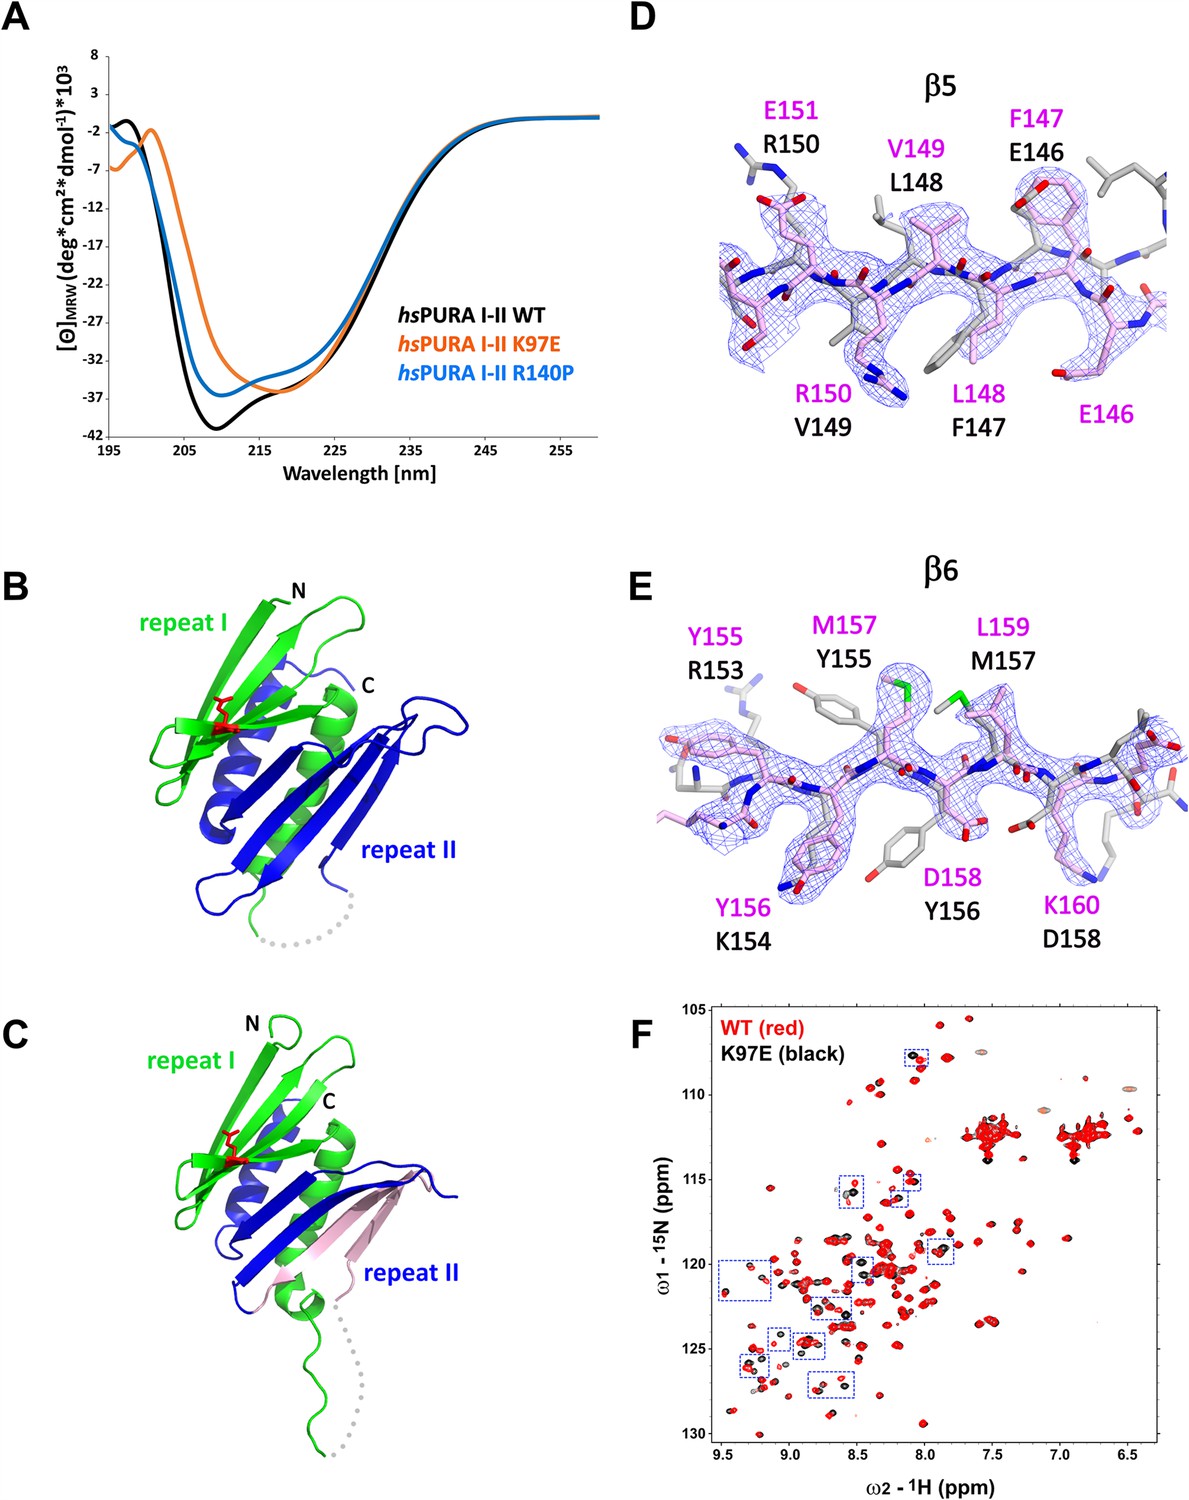
(A) Circular dichroism (CD) spectroscopic analyses of hsPURA I–II, K97E, and R140P variants. Shown are the mean of three CD measurements for each of the proteins (n = 3). The spectra of hsPURA I–II K97E show a very different profile, indicating an altered fold of this variant compared to the wild-type form. (B, C) Crystal structures of hsPURA K97E repeats I (green) and II (blue) at 2.45 Å resolution, showing a high overall similarity to hsPURA (Figure 4A). Two independent hsPURA I–II K97E chains (A, B) in the asymmetric unit are shown in (B) and (C), respectively. The mutated amino acid K97E is indicated as red sticks. Positional shifts of amino acids in β5 (D) and β6 (E) strands of the chain B in the crystal structure of hsPURA I–II K97E. 2Fo–Fc electron density map (contour 1σ) is shown for the selected fragment of β5 and β6 strands in chain B (light pink). The superimposed chain A (gray) shows a register shift in chain B by +1 amino acid in the β5 strand and by +2 in the β6 strand. (F) Nuclear magnetic resonance (NMR) experiment with wild-type hsPURA I–II and hsPURA I–II K97E. Overlay of the 1H, 15N-HSQC spectra of hsPURA I–II (red) and K97E (black). Blue boxes indicate examples of changes between both spectra.
Figure 5—figure supplement 1

Structure of hsPURA I–II R140P variant.
(A, B) An overlay of chains A (red), B (green), C (blue), D (magenta) from the asymmetric unit of the crystals of hsPURA I–II R140P, and the wild-type hsPURA I–II chains A, B, C, D shown in gray. The structures are shown in two different orientations as ribbons, residue P140 is shown as red sticks. The missing fragment of the loop is shown as gray dots. The most variable part of the secondary structure elements, strands β4 and β8, have been labeled accordingly. (C) Comparison of all independent chains in the asymmetric unit of hsPURA I–II R140P structure (PDB ID: 8CHV) with the wild-type hsPURA I–II (PDB ID: 8CHT). Root mean square deviation (r.m.s.d.) values are expressed in Å; the number of superimposed Cα atoms is indicated.
Figure 5—figure supplement 2
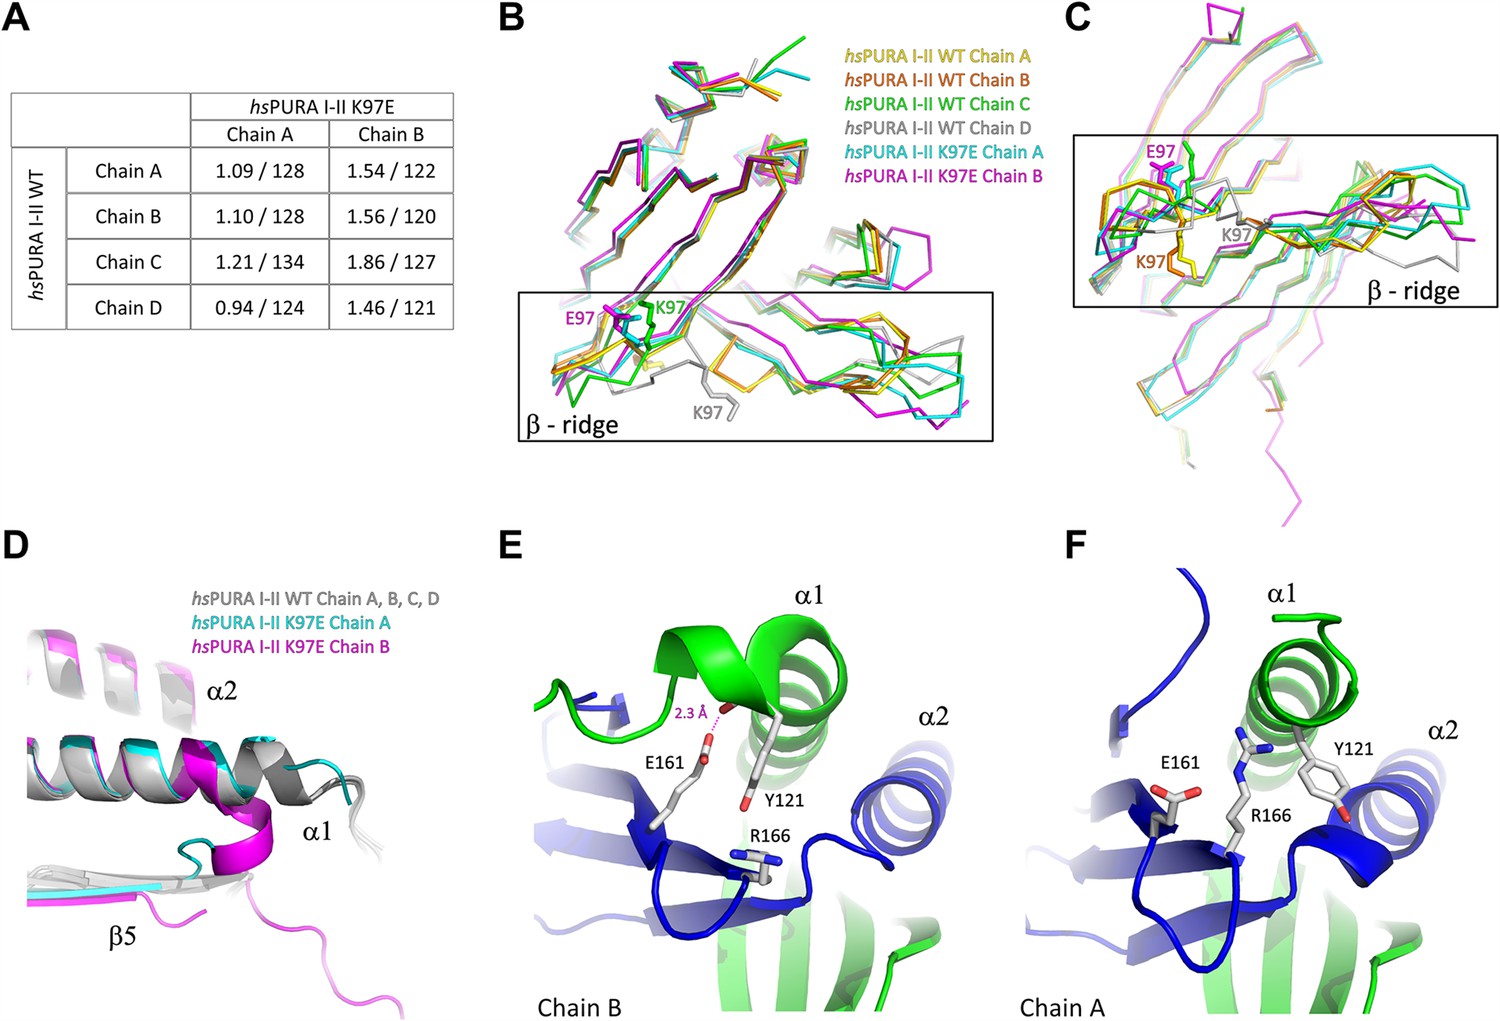
Comparison of structural features between wild-type and K97E-variant hsPURA protein.
(A) Comparison of all independent chains in the asymmetric unit of hsPURA I–II WT structure (PDB ID: 8CHT) with hsPURA I–II K97E (PDB ID: 8CHU). Root mean square deviation (r.m.s.d.) values are shown in Å; the number of superimposed Cα atoms has been indicated. (B, C) The β-ridge in the hsPURA I–II crystal structure. The superposition of all four human hsPURA I–II chains from the asymmetric unit of the wild-type structure as well as the two chains from the asymmetric unit of the K97E variant. The structure is shown as ribbons in two different orientations, K97 in the wild-type structure and E97 in the mutated form is shown as sticks. (D) The overlay of crystal structures of hsPURA I–II shown in gray (chains A, B, C, D), hsPURA I–II K97E chain A shown in cyan, and hsPURA I–II K97E chain B shown in magenta. Comparison of the interaction of helix α1 in the chain B (E) and the chain A (F) in the crystal structure of hsPURA I–II K97E. The color code is repeat I: green, repeat II: blue. In chain B, the helix α1 bends and forms a new interaction between Y121 and E161 with 2.3 Å distance. This interaction is not present in chain A.
Figure 5—figure supplement 3

Comparison of structural features between wild-type and K97E-variant hsPURA protein.
(A) 15N-heteronuclear NOE experimental spectra for hsPURA I–II K97E, with blue frames indicating changes shown in Figure 5F. These peaks do not show any shifts compared to the WT control (black), which has no added NOEs, whereas in the experiment with K97E-variant protein (red) additional NOEs are observed. (B) Summary graph of molecular dynamics simulation for hsPURA I–II (blue) and hsPURA I–II K97E variant (orange). The graph shows root mean square fluctuation in Å (RMSF) for every residue (carbon alpha) of the investigated fragment. RMSF was computed using the average position of the carbon alpha during the simulation as the reference point. Asterisks indicate significance level: * for p ≤ 0.05, ** for p ≤ 0.01, *** for p ≤ 0.001, and **** for p ≤ 0.0001.
Videos
Video 1
Molecular dynamics simulations for the wild-type hsPURA I–II (chain B).
Red color indicates the residues with significantly higher fluctuation described as p-value computed using the average position of the carbon alpha during the simulation as the reference point. 10 production runs were performed at the temperature of 310 K, resulting in 20 simulations of 100 ns each (1000 frames), or a total aggregate time of 1 µs for each protein. The systems were analyzed using root means square fluctuations (RMSF). More precisely, the RMSF was computed for each Cα atom in each simulation, leaving 10 RMSF data points per residue.
Video 2
Molecular dynamics simulations for the hsPURA I–II K97E (chain B).
Red color indicates the residues with significantly higher fluctuation described as p-value computed using the average position of the carbon alpha during the simulation as the reference point. 10 production runs were performed at the temperature of 310 K, resulting in 20 simulations of 100 ns each (1000 frames), or a total aggregate time of 1 µs for each protein. The systems were analyzed using root means square fluctuations (RMSF). More precisely, the RMSF was computed for each Cα atom in each simulation, leaving 10 RMSF data points per residue.
Additional files
-
Supplementary file 1
Summary of the experiments performed for hsPURA.
(A) Summary of the experiments in this study for the selected human PURA variants. (B) Data collection and refinement statistics for crystal structures of human PURA variants. Values in parentheses are for the highest resolution shell.
- https://cdn.elifesciences.org/articles/93561/elife-93561-supp1-v1.docx
-
MDAR checklist
- https://cdn.elifesciences.org/articles/93561/elife-93561-mdarchecklist1-v1.docx
Download links
A two-part list of links to download the article, or parts of the article, in various formats.
Downloads (link to download the article as PDF)
Open citations (links to open the citations from this article in various online reference manager services)
Cite this article (links to download the citations from this article in formats compatible with various reference manager tools)
PURA syndrome-causing mutations impair PUR-domain integrity and affect P-body association
eLife 13:RP93561.
https://doi.org/10.7554/eLife.93561.3


