Dependence of nucleosome mechanical stability on DNA mismatches
- Department of Physics, Center for Physics in Living Cells University of Illinois Urbana-Champaign, United States
- Department of Molecular and Medical Genetics, Oregon Health and Science University, United States
- Cancer Early Detection Advanced Research Center (CEDAR), Knight Cancer Institute, Oregon Health and Science University, United States
- Department of Biomedical Engineering, Oregon Health and Science University, United States
- Division of Oncological Sciences, Oregon Health and Science University, United States
- Department of Biophysics, Johns Hopkins University, United States
- Laboratory of Biochemistry and Molecular Biology, Center for Cancer Research, National Cancer Institute, United States
- Department of Biophysics and Biophysical Chemistry, Johns Hopkins University, United States
- Department of Biosciences, Durham University, United Kingdom
- Department of Biology, Johns Hopkins University, United States
- Department of Molecular Biology and Genetics, Johns Hopkins University, United States
- Program in Cellular and Molecular Medicine, Boston Children’s Hospital, United States
- Department of Pediatrics, Harvard Medical School, United States
- Howard Hughes Medical Institute, United States
Figures
Figure 1 with 1 supplement
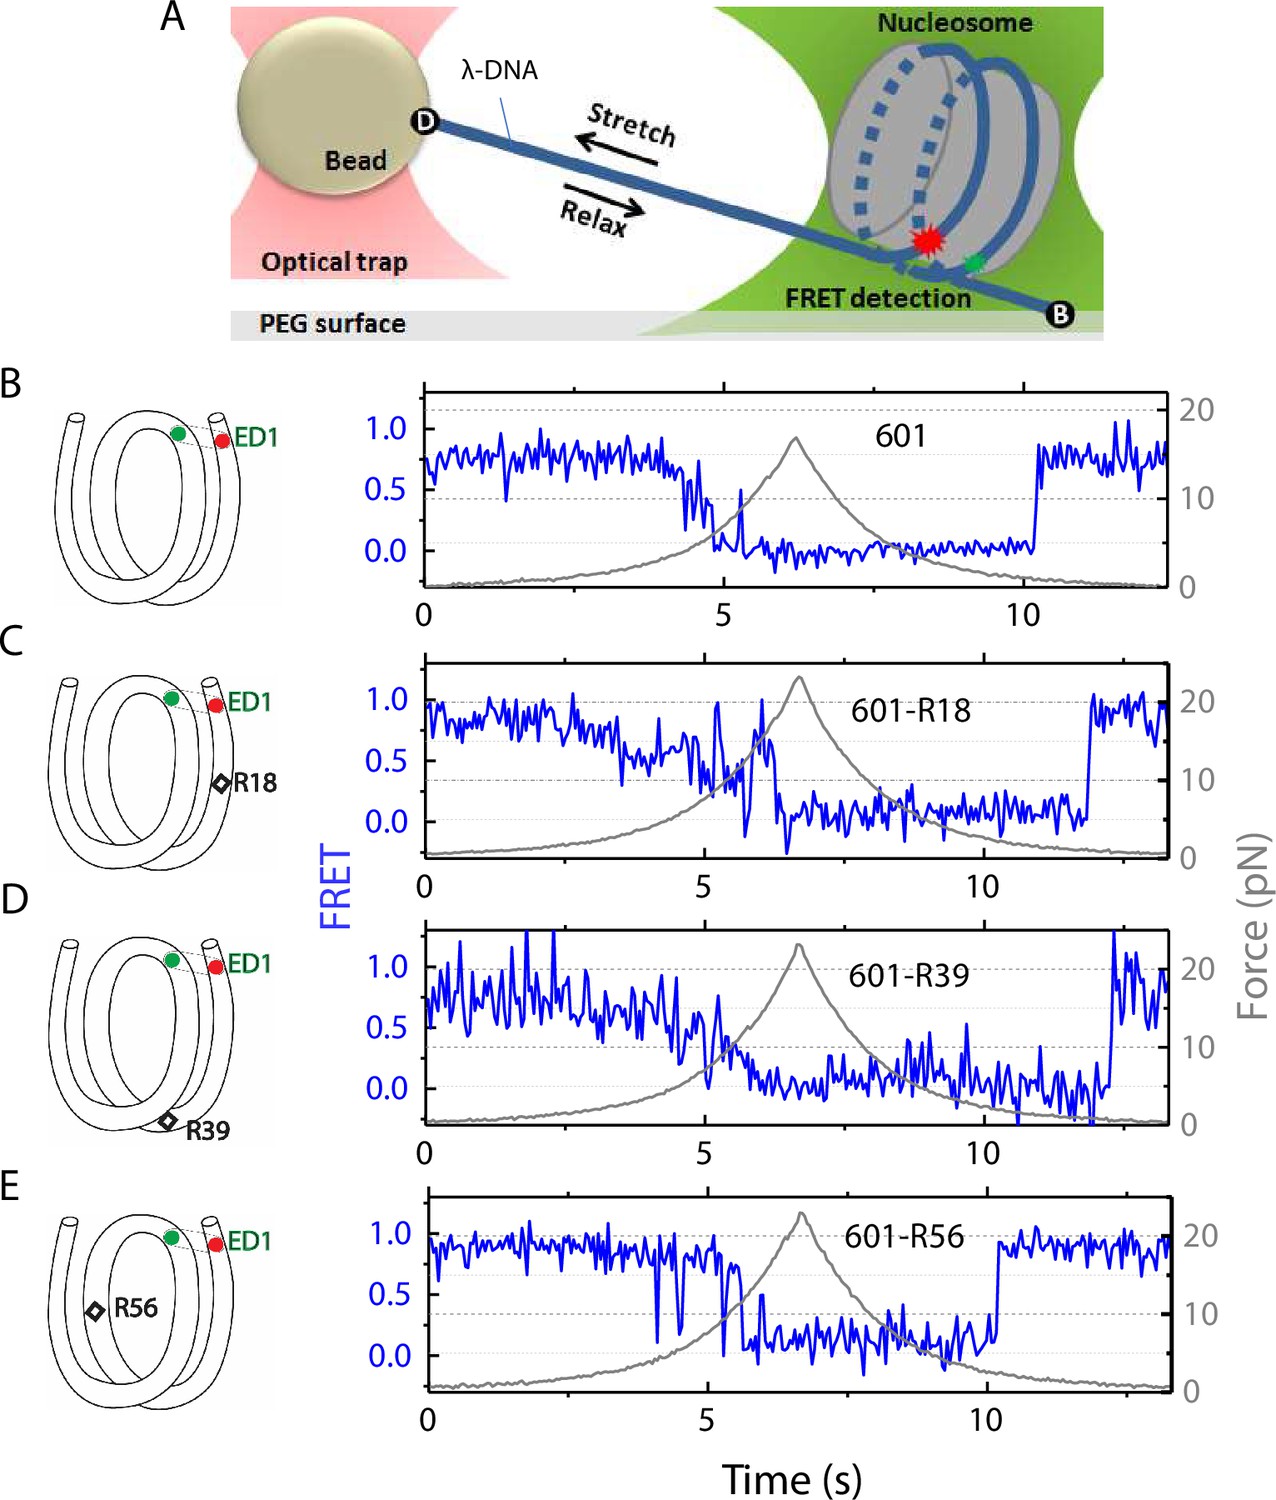
Nucleosome unwrapping measurement.
(A) Experimental scheme. The red and green stars represent labelled Cy5 (acceptor) and Cy3 (donor) fluorophores, respectively. Biotin, B, and digoxigenin, D, are used to tether the nucleosome-lambda DNA construct to the surface and the bead, respectively. (B, C, D, E): Representative stretching traces of the outer turn (ED1) for nucleosomes reconstituted from the 601 sequence (B) and from the 601 sequence with containing a mismatch at different positions: on the outer turn (C), at the junction of the outer turn and inner turn (D) and at the inner turn (E). The red and green dots on the DNA bends represent labelled Cy5 and Cy3 fluorophores. The elongated circles enclosing red and green dots represent the ED labeling position. The black diamonds on the DNA bends represent the mismatch position with R18 and R39 on histone = facing minor grooves and R56 on a histone-facing major groove.
-
Figure 1—source data 1
FRET efficiency and force vs time during force-induced unwrapping and rewrapping.
- https://cdn.elifesciences.org/articles/95514/elife-95514-fig1-data1-v1.xlsx
Figure 1—figure supplement 1
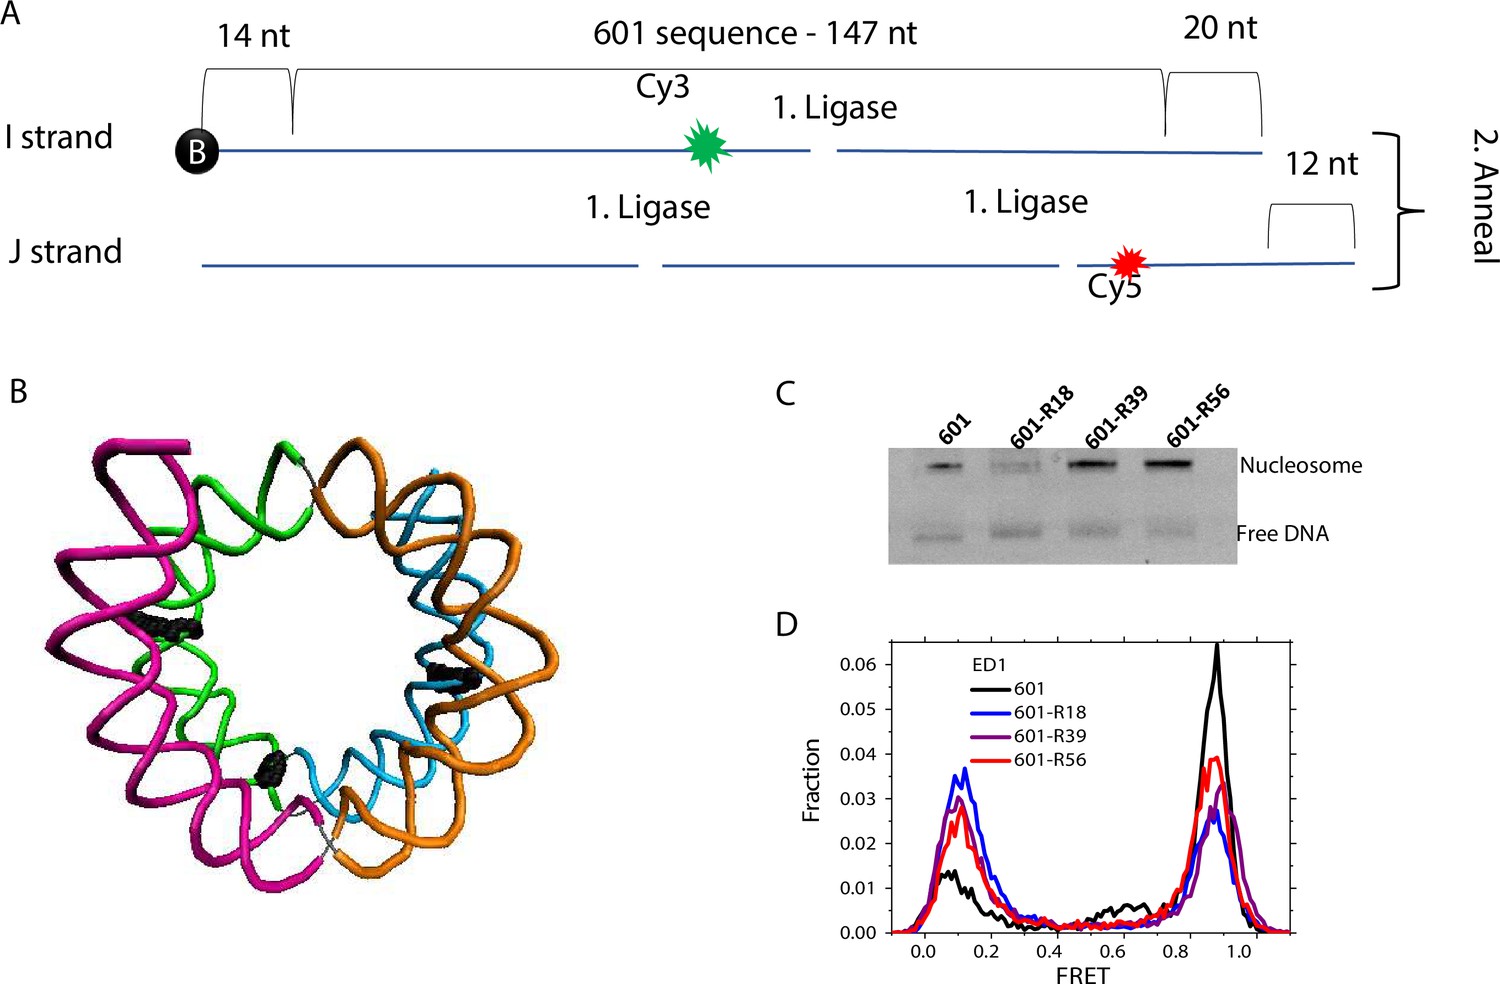
Nucleosome preparation.
(A) Scheme of the DNA template prepared by ligation of short, labeled oligos. (B) DNA structure marking three sites of mismatch insertion (R56, R39, and R18, running from left to right). (C) Migration of the 601 nucleosome mismatch containing nucleosomes on 5% native PAGE. (D) FRET histogram of the 601 nucleosome mismatch containing nucleosomes with ED1 labeling scheme. The low FRET peak contains nucleosomes without a fluorescently active acceptor.
-
Figure 1—figure supplement 1—source data 1
FRET efficiency distribution expressed as fraction per force bin.
- https://cdn.elifesciences.org/articles/95514/elife-95514-fig1-figsupp1-data1-v1.xlsx
Figure 2
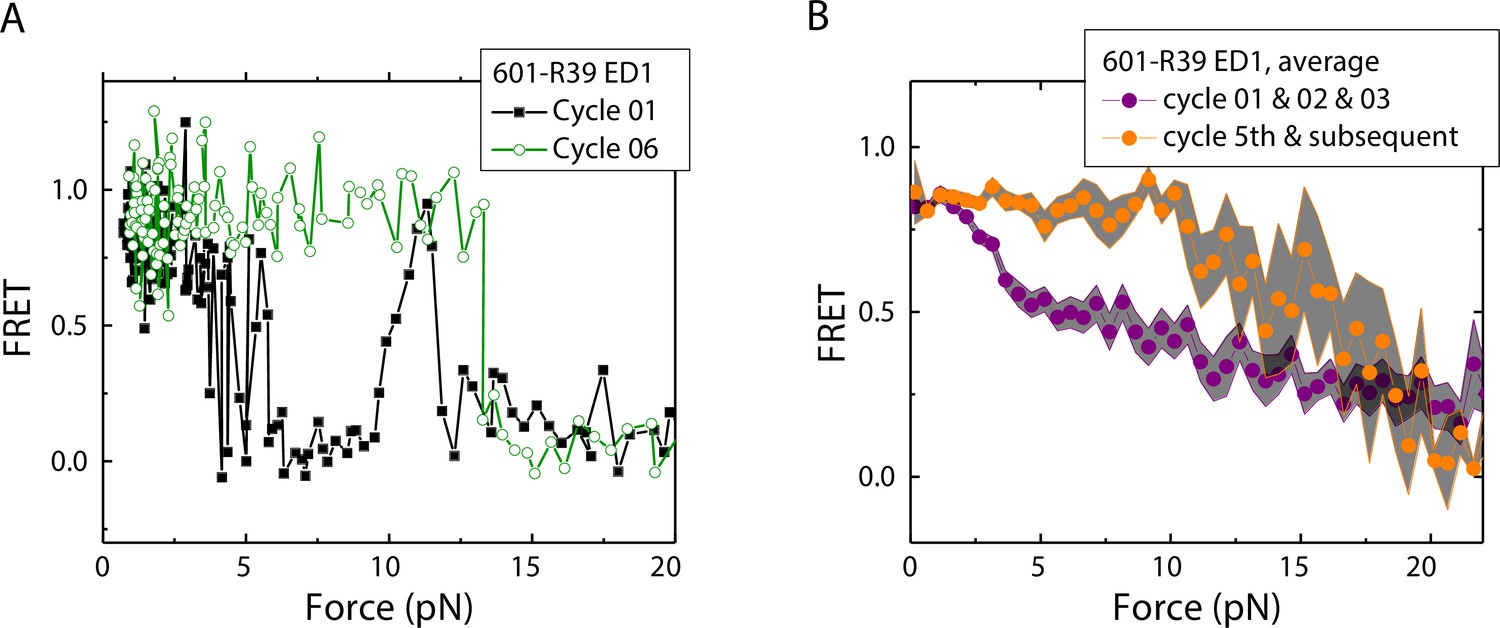
Unwrapping force of mismatch-containing nucleosomes is higher for subsequent stretching cycles.
(A) Representative single-molecule stretching traces at two stretching cycles from the sample molecule, probe by the ED1 FRET pair in the 601-R18 nucleosome. (B) Averaging FRET vs. Force for many molecules at the first three stretching cycles (purple) and the subsequent stretching cycles (orange). Histone proteins were expressed in Xenopus. The error bars represent S.D. of n=25 and 11 traces for the first three stretching cycles (purple) and for the cycle 5th and the subsequent stretching cycles (orange), respectively.
-
Figure 2—source data 1
FRET efficiency vs Force during force-induced nucleosomal DNA unwrapping.
- https://cdn.elifesciences.org/articles/95514/elife-95514-fig2-data1-v1.xlsx
Figure 3
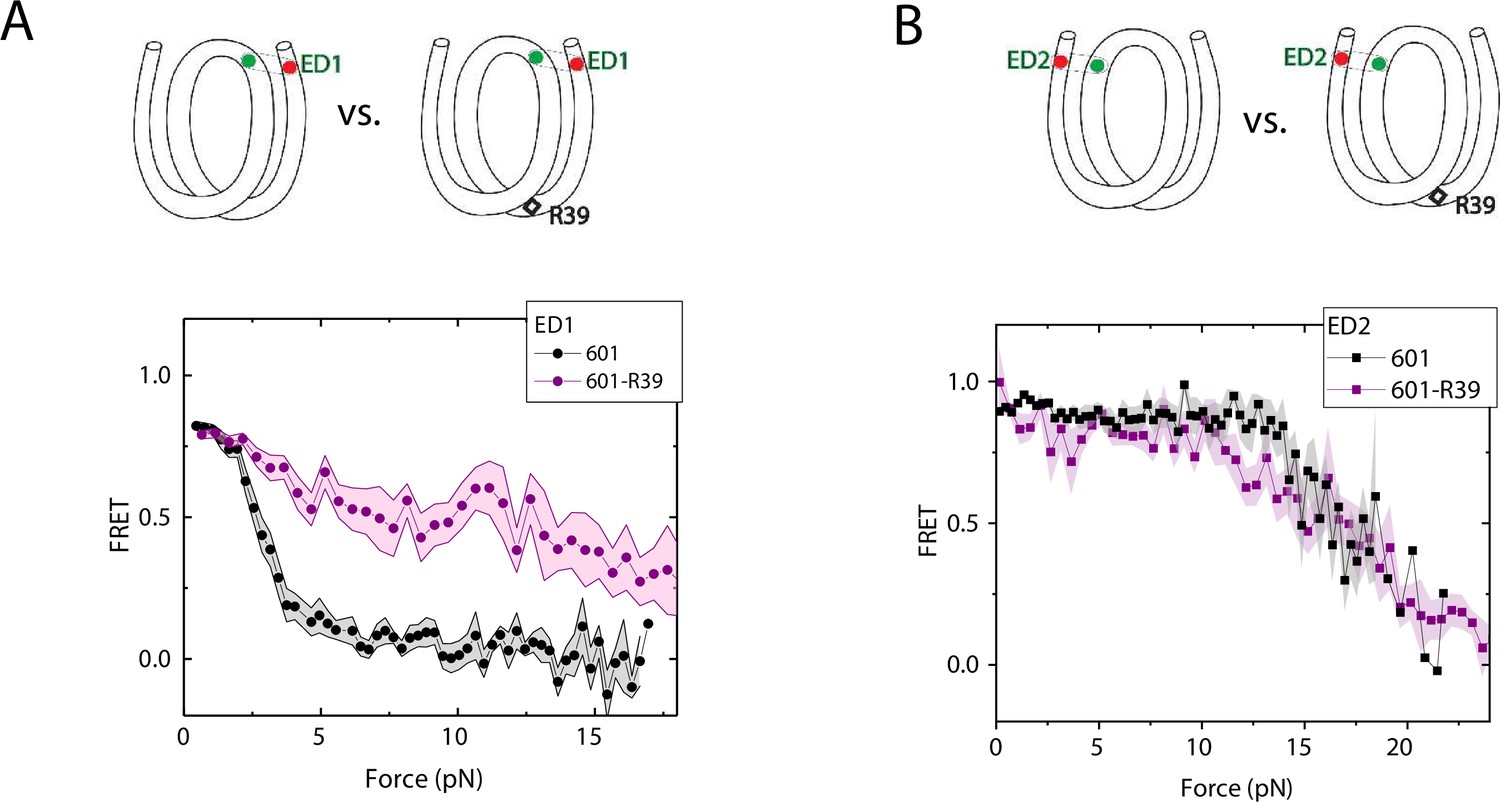
Enhancement of nucleosome mechanical stability by DNA mismatch.
Average of FRET vs. Force for ED1 probe (A) and ED2 probe (B) for the 601 nucleosome (black) and for the first stretching cycle of the mismatch containing nucleosome 601-R39 (purple). Histone proteins were expressed in Xenopus. The error bars represent S.D. of n=25 and 7 for the ED1 probe of the 601 and 601-R39 nucleosomes (A) and n=20 and 39 for the ED2 probe of the 601 and 601-R39 nucleosomes (B), respectively.
-
Figure 3—source data 1
FRET efficiency vs force during force-induced DNA unwrapping from a nucleosome.
- https://cdn.elifesciences.org/articles/95514/elife-95514-fig3-data1-v1.xlsx
Figure 4
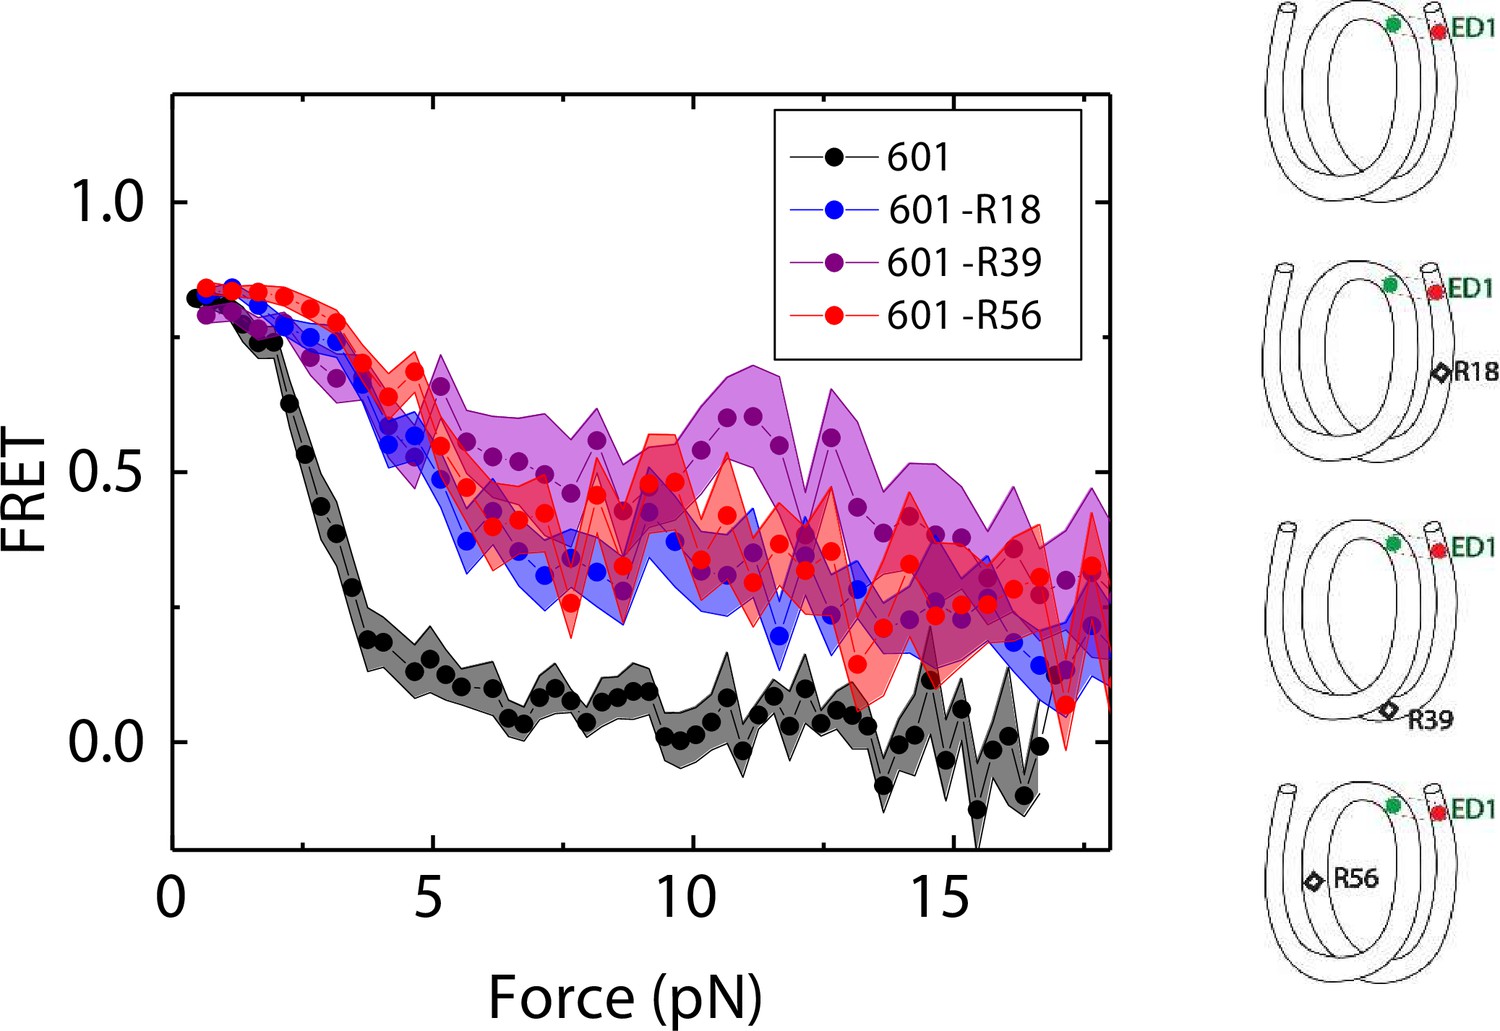
Mismatch position-dependence of nucleosome unwrapping.
Average of FRET vs. Force for ED1 probe for the 601 nucleosome (black) and the mismatch-containing nucleosome 601-R39 (purple), 601-R18 (blue) and 601-R56 (red). Histone proteins were expressed in Xenopus. The error bars represent S.D. of n=25, 11, 7, and 10 for the 601, 601-R18, 601-R39, and 601-R56 nucleosomes, respectively.
-
Figure 4—source data 1
FRET efficiency vs force during force-induced DNA unwrapping from a nucleosome.
- https://cdn.elifesciences.org/articles/95514/elife-95514-fig4-data1-v1.xlsx
Figure 5 with 1 supplement
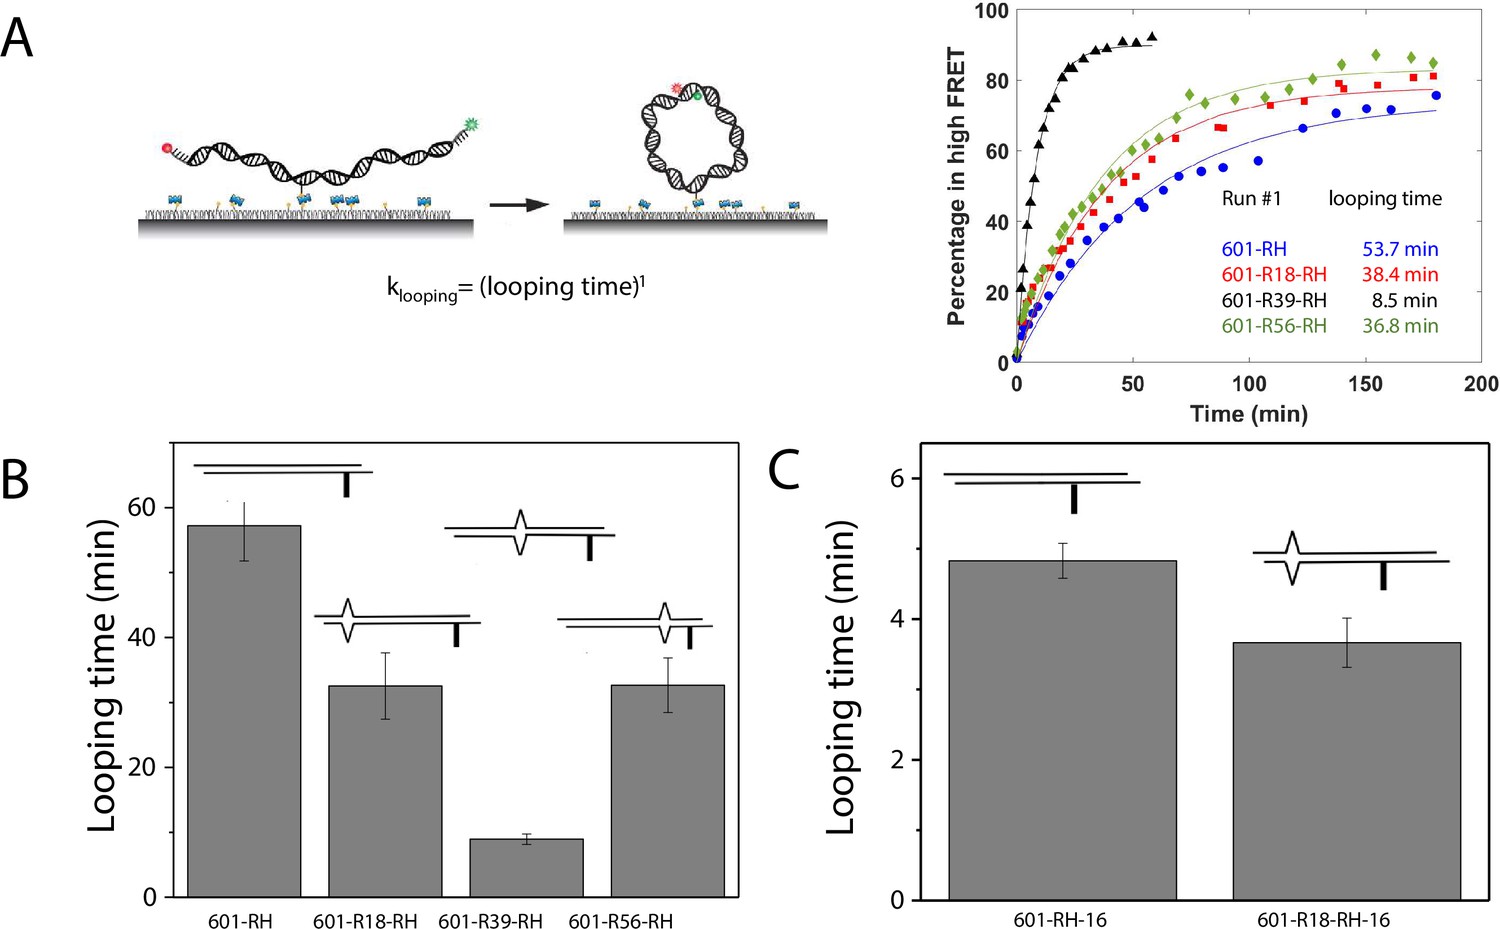
C-C mismatch enhances DNA flexibility.
(A) Single-molecule cyclization assay: The DNA construct with 10-nucleotide complementary sticky ends is immobilized on a PEG passivated imaging chamber. DNA looping is induced using the imaging buffer containing 1 M NaCl followed by time course TIRF imaging. To calculate the looping time, the fraction of looped molecules (high FRET) as a function of time is fitted to an exponential function, (right panel for one run of experiments). (B, C) Fitted looping time for the right half of the 601 construct without and with mismatches (B) and with the biotin position being moved by 16 nt (C). Error bars represented the S.E.M with n=3 technical replicates.
-
Figure 5—source data 1
Quantification of single molecule looping kinetics.
- https://cdn.elifesciences.org/articles/95514/elife-95514-fig5-data1-v1.xlsx
Figure 5—figure supplement 1

Single-molecule cyclization time course quantification.
Each run has four times courses of looped fraction (percentage in high FRET population) vs time. Approximately 2500–3500 molecules were quantified at each timestamp during the experiment, and three independent experiments (run 1, run 2, and run 3) were performed for each sequence. (A - C) Fraction of DNA molecules in high FRET over time for the 601 sequences with a C-C mismatch. Run 1 in panel A is also shown in Figure 5. (D - F) Fraction of DNA molecules in high FRET over time for the 601 sequences with a C-C mismatch and biotin moved 16 nucleotides toward the center of the construct.
-
Figure 5—figure supplement 1—source data 1
High FRET fraction vs time for single molecule looping experiments.
- https://cdn.elifesciences.org/articles/95514/elife-95514-fig5-figsupp1-data1-v1.xlsx
Figure 6
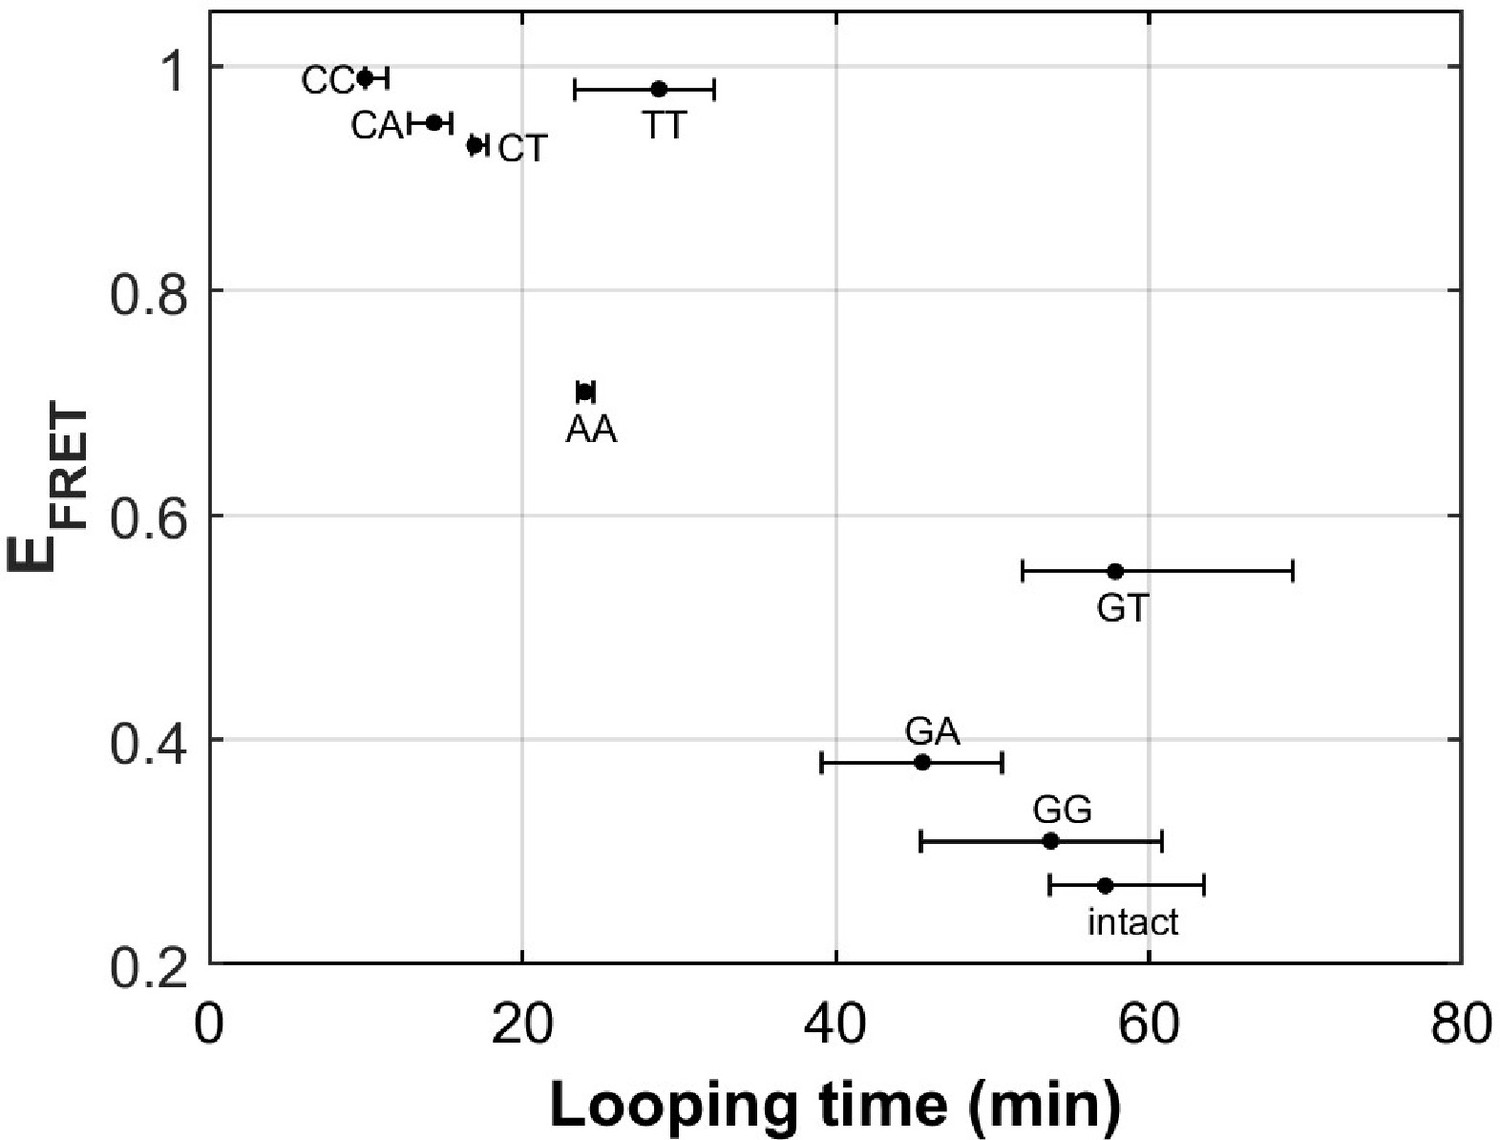
DNA flexibility enhancement is dependent on mismatch type.
Looping times for DNA containing a single mismatch (one of eight types each) and an intact DNA without a mismatch. Also shown are ensemble FRET efficiencies (EFRET) from Fields et al., 2013 as a measure of DNA buckling for the same type of mismatch.
-
Figure 6—source data 1
FRET efficiency (a measure of DNA buckling) vs looping time for various mismatches.
- https://cdn.elifesciences.org/articles/95514/elife-95514-fig6-data1-v1.xlsx
Figure 7
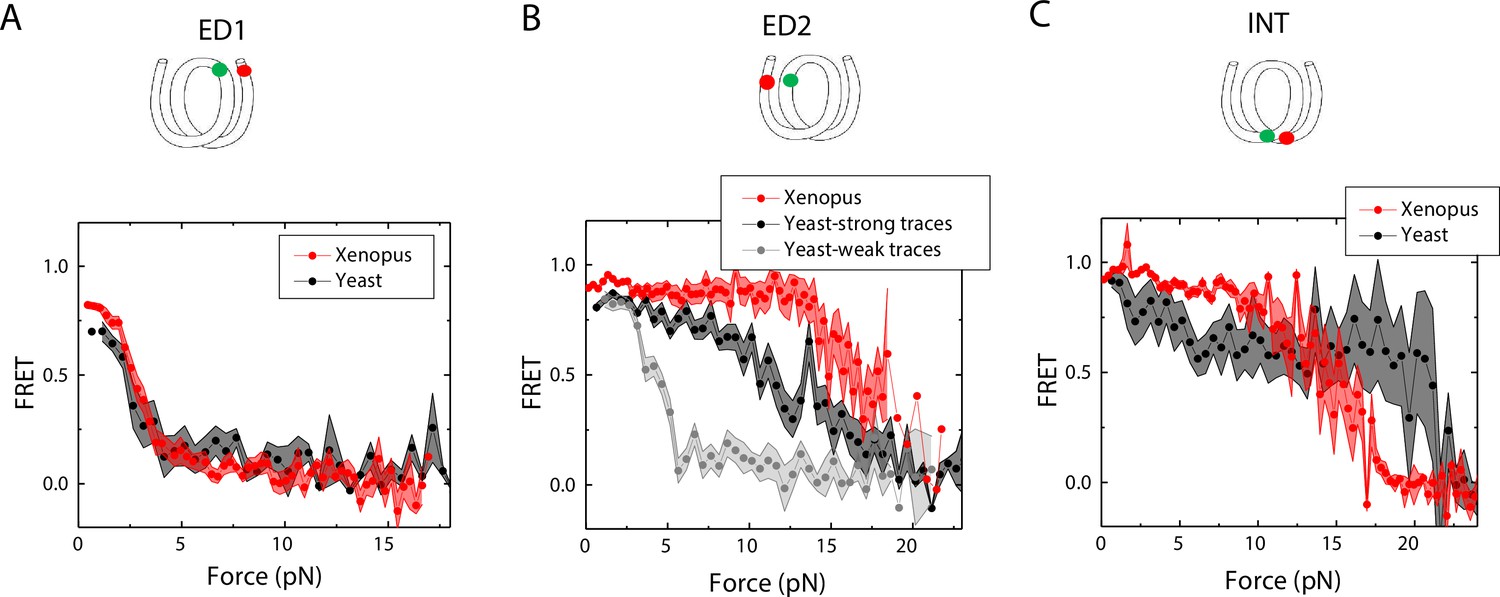
Unwrapping of yeast vs. Xenopus reconstituted nucleosomes.
Average of FRET vs. Force for nucleosomes reconstituted from Xenopus (red) vs yeast (black and gray) histone proteins with DNA labeled by outer turn probes ED1 (A), ED2 (B) and inner turn probe INT (C). The error bars represent S.D. of n=17 (Xenopus) and 5 (Yeast) nucleosomes with the ED1 probe (A), n=20 (Xenopus), 6 (Yeast – strong) and 4 (Yeast-weak) nucleosomes with the ED2 probe (B), and n=22 (Xenopus) and 6 (Yeast) nucleosomes with the INT probe (C), respectively.
-
Figure 7—source data 1
FRET efficiency vs force during force-induced DNA unwrapping from a nucleosome.
- https://cdn.elifesciences.org/articles/95514/elife-95514-fig7-data1-v1.xlsx
Additional files
-
Supplementary file 1
Sequences for nucleosome reconstitution for the fleezers measurements – made by annealing the top and bottom strands which was constructed by ligation of two short fragments.
Light gray shades denote sequences in the outer turn of the nucleosome and dark gray shares denote sequences in the inner turn of the nucleosome. Green and red ‘T’s denote the labeling sites for donor (Cy3) and acceptor (Cy5) fluorophores, conjugation done via amino-dT for the ED1 construct. For labeling sites for the ED2 construct, we refer to Li, 2008. Yellow highlights denote the positions of the mismatched bases. /idSp/ is the space added to prevent polymerization onto the 5’ overhang.
- https://cdn.elifesciences.org/articles/95514/elife-95514-supp1-v1.docx
-
MDAR checklist
- https://cdn.elifesciences.org/articles/95514/elife-95514-mdarchecklist1-v1.docx
Download links
A two-part list of links to download the article, or parts of the article, in various formats.
Downloads (link to download the article as PDF)
Open citations (links to open the citations from this article in various online reference manager services)
Cite this article (links to download the citations from this article in formats compatible with various reference manager tools)
Dependence of nucleosome mechanical stability on DNA mismatches
eLife 13:RP95514.
https://doi.org/10.7554/eLife.95514.3


