KIS counteracts PTBP2 and regulates alternative exon usage in neurons
- Molecular Biology Institute of Barcelona (IBMB), CSIC, Spain
- Barts Cancer Institute, Queen Mary University of London, United Kingdom
Figures
Figure 1 with 1 supplement

KIS promotes the inclusion of exons upregulated during neuronal differentiation.
(A) Immunofluorescence staining of endogenous speckle marker SRRM2 (magenta) and 4',6-diamidino-2-phenylindole (DAPI) (bue) in HEK293T cells transfected with GFP-KIS (green). Scale bar, 2 μm. (B) Differential expression of UHMK1, the gene encoding KIS, in cultured cortical neurons from E17.5 mouse embryos. Samples were collected at different days in vitro (DIV), analyzed by qRT-PCR and made relative to day 0. Mean ± standard error of the mean (SEM) (n = 3) are plotted. (C) Experimental design of exon usage analysis. Cultured cortical neurons from E17.5 mice were collected at 7 or 18 DIV (left experimental set). Cortical neurons were transduced at 7 DIV with lentiviral vectors expressing shCtrl or shKIS and collected at 18 DIV (right experimental set). (D) UHMK1 mRNA levels in primary cortical neurons transduced at 7 DIV with lentiviral vectors expressing shCtrl or shKIS and collected at 18 DIV. Bars represent mean ± SEM (n = 3) (E) MA-plot shows splicing index (SI) fold change (log2FC) as a function of gene expression in rpkm (reads per kilobase million) in control neurons (shCtrl) compared to KIS knockdown neurons (shKIS) as in panel D. The percentage of exons displaying a log2FC above 0.5 or below −0.5 is indicated. (F) RNA-seq analysis from cortical neurons expressing shCtrl or shKIS as in panel D and from cortical neurons collected at 7 and 18 DIV for neuronal differentiation (n = 3). Barcode plot shows the position of exons upregulated by KIS, that is downregulated by KIS knockdown, within the transcriptomic dataset of exons upregulated during neuronal differentiation. Normalized enrichment scores (NES) and the corresponding false-discovery rate (FDR) values are shown. (G) Volcano plot shows t-test significance (−log2p) as a function of SI fold change (log2FC) in control neurons (shCtrl) compared to KIS knockdown neurons (shKIS). Significantly (FDR <0.05) downregulated (n = 1106, green) or upregulated (n = 1141, red) exons are highlighted. Inset shows the dependence of FDR on exon rank from experimental and randomized datasets. (H) Gene ontology (GO) term enrichment analysis of genes with exons upregulated by KIS. FDR value is shown.
Figure 1—figure supplement 1
KIS promotes exon inclusion in genes encoding proteins related to synaptogenesis and neurogenesis.
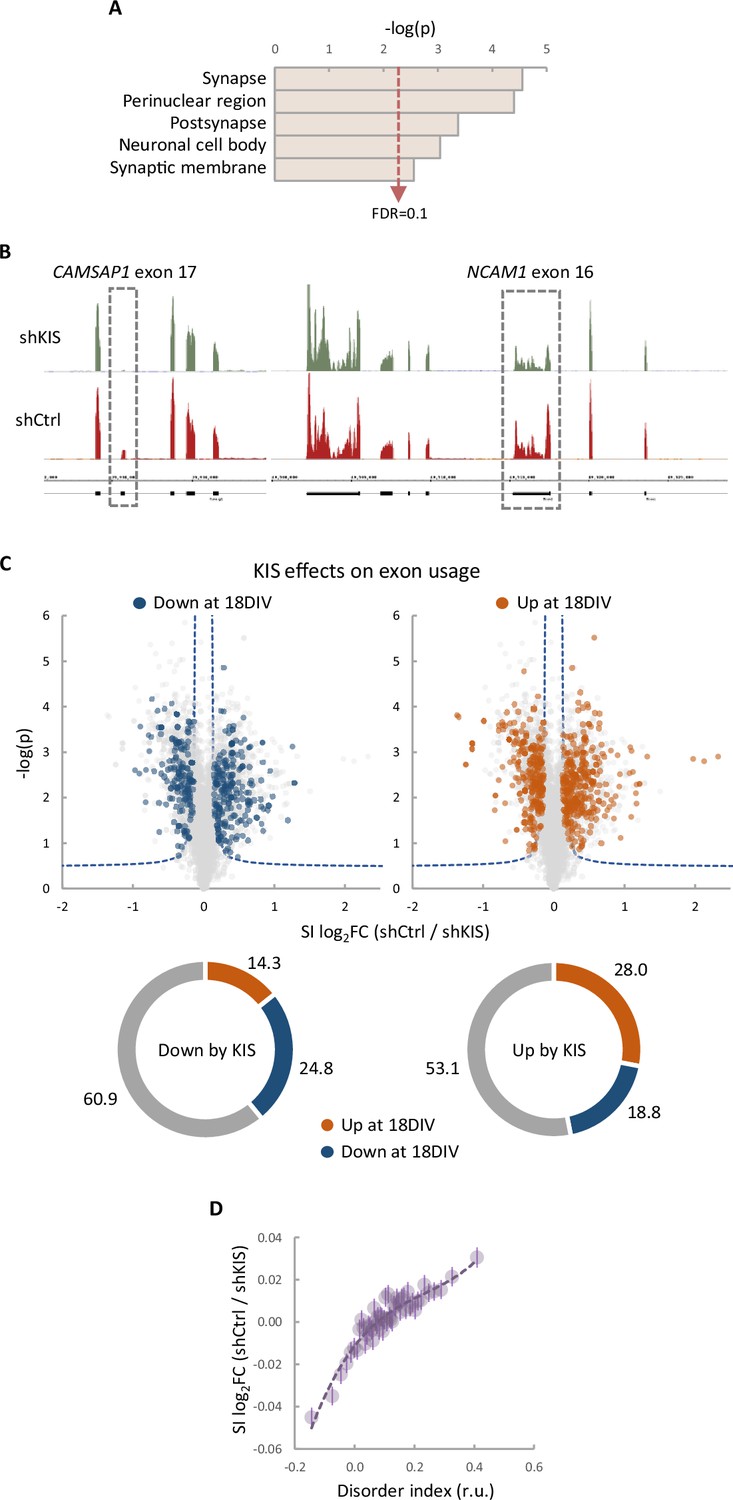
(A) Gene ontology (GO) term enrichment analysis of genes with more than one exon upregulated by KIS. False-discovery rate (FDR) value is shown. (B) Representative read profiles showing KIS-dependent exons in CAMSAP1 and NCAM1 genes (dashed-line rectangles). (C) Volcano plots show t-test significance (−log2p) as a function of splicing index (SI) fold change (log2FC) in control neurons (shCtrl) compared to KIS knockdown neurons (shKIS). Significantly (FDR <0.05) downregulated (blue) and upregulated (orange) exons during neuronal differentiation are highlighted. Sunburst charts show the percentage of exons differentially modulated during differentiation in sets downregulated (left) and upregulated (right) by KIS. (D) Exon usage fold change (log2FC) in control neurons (shCtrl) compared to KIS knockdown neurons (shKIS) as a function of peptide disorder index (see Methods). Mean values of binned data (bin size = 2500 exons, purple circles) with confidence limits for the mean (α = 0.05) and a regression line are shown.
Figure 2 with 1 supplement
The phosphoproteome of KIS identifies splicing regulators.
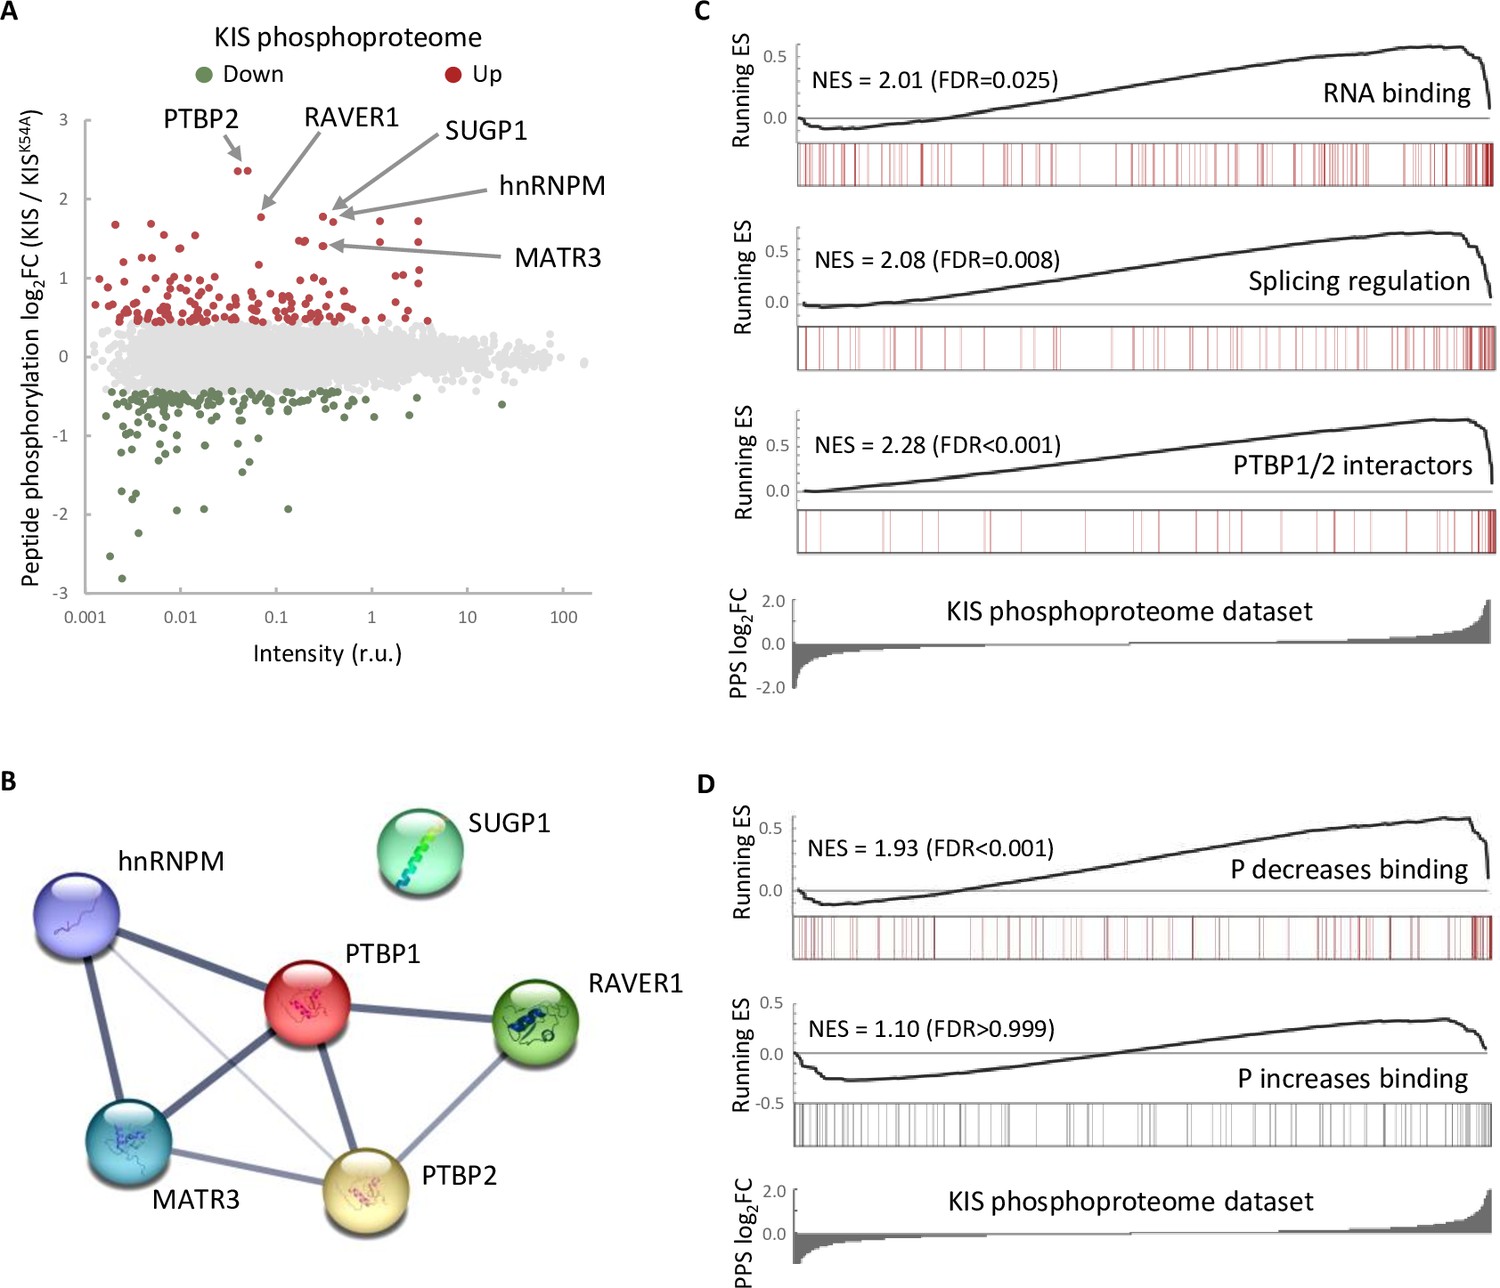
(A) MA-plot of phospho-sites found in the proteome of HEK293T cells transfected with KIS and KISK54A mutant (see also Supplementary file 3 for details). (B) STRING interaction map of top KIS-phosphorylated proteins. (C, D) Gene enrichment analysis of the KIS phosphoproteomic dataset. Barcode plots indicate the rank position of genes from (C) Gene ontology (GO) terms and PTBP1/2 interactors and (D) phosphorylated RNA-binding proteins (Vieira-Vieira et al., 2022) that were found significantly enriched within the KIS phosphoproteomic dataset. Normalized enrichment scores (NES) and the corresponding false-discovery rate (FDR) values are shown.
Figure 2—figure supplement 1
In vitro phosphorylation of PTBP2 by KIS.
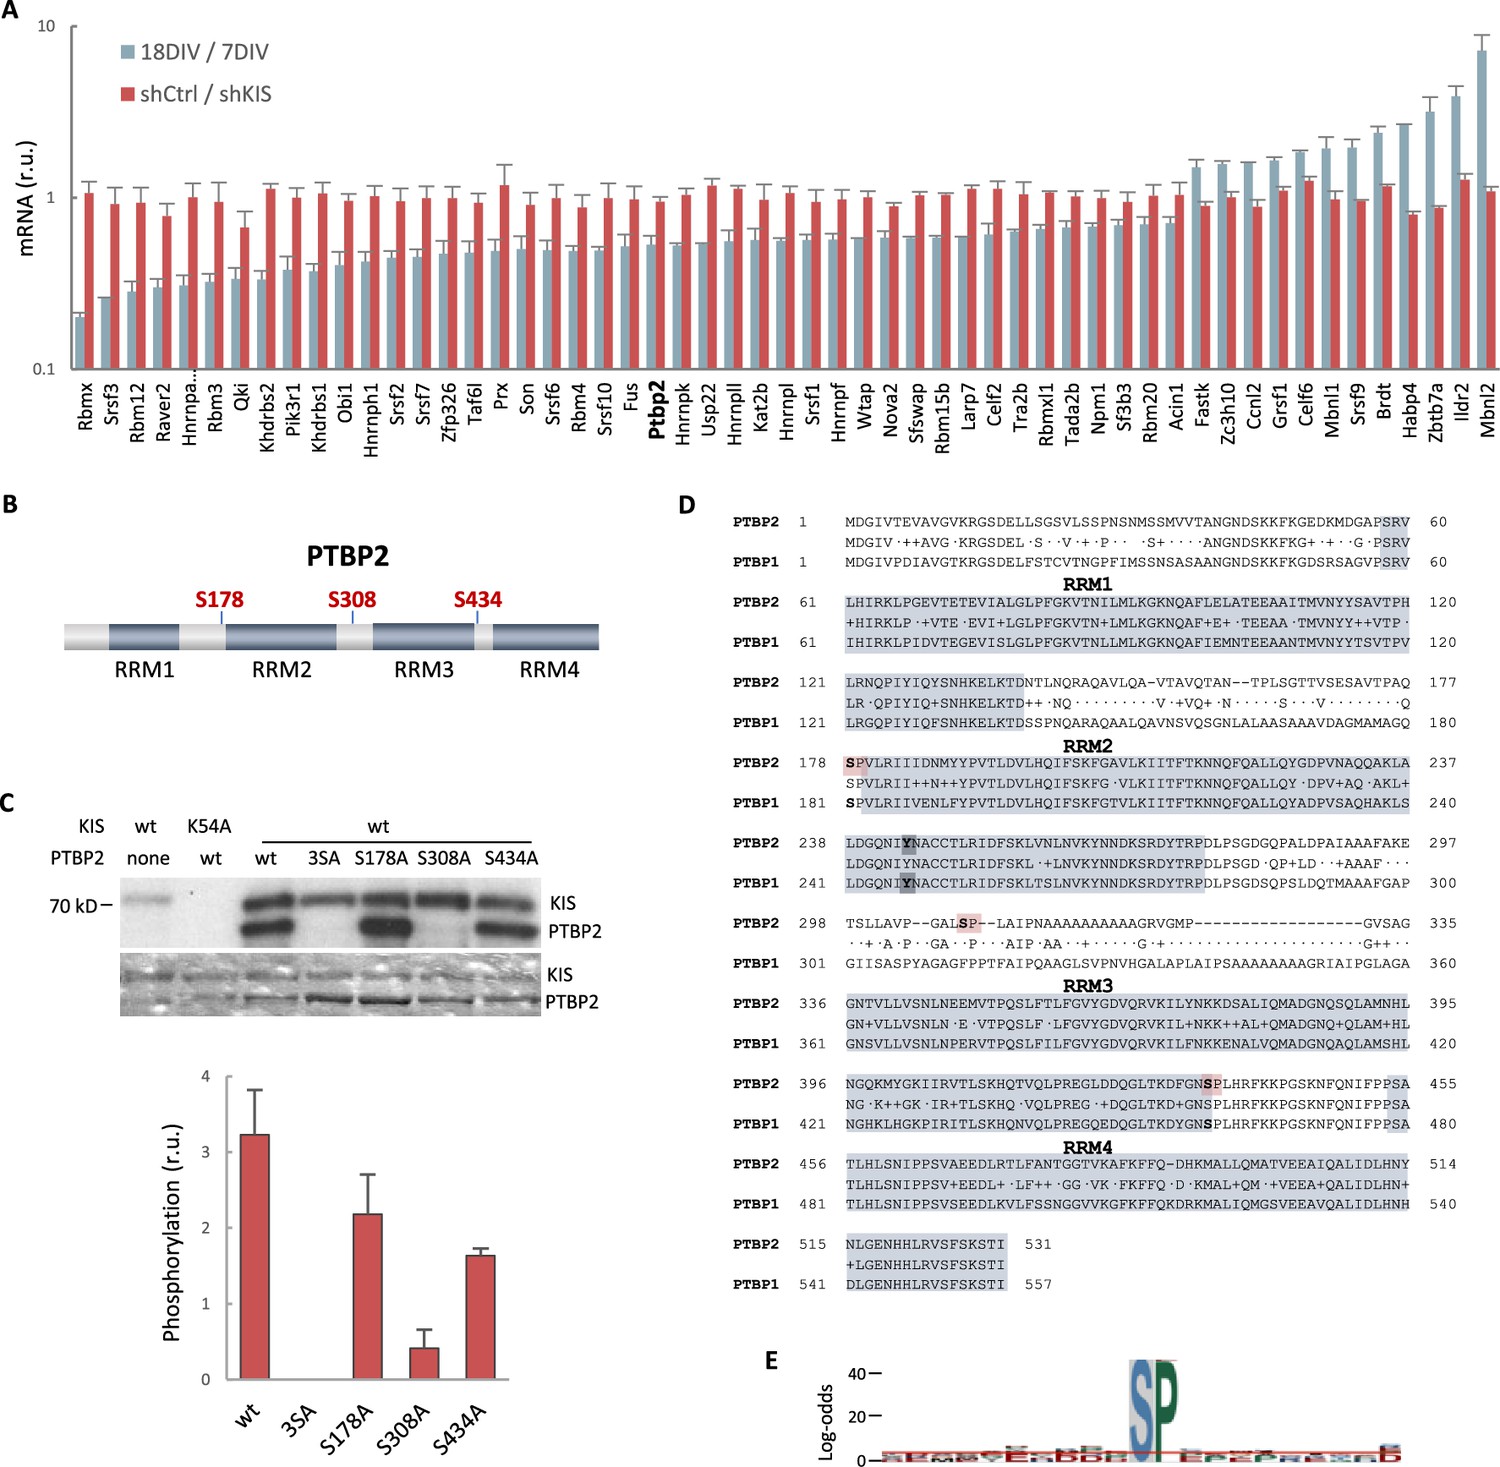
(A) mRNA levels of splicing regulators from gene ontology (GO) biological process in cortical neurons at 18 DIV relative to 7 DIV (blue) or expressing shKIS relative to shCtrl (red). Mean ± standard error of the mean (SEM) (n = 3) values from genes with log2FC >0.5 and false-discovery rate (FDR) <0.1 are shown. (B) PTBP2 protein scheme showing RNA recognition motifs (RRMs) and localization of KIS-phosphorylated serines within linker regions. (C) KIS in vitro kinase assay of indicated GST recombinant proteins purified from E. coli. In the phospho-null triple mutant (3SA), Ser178, Ser308, and Ser434 have been mutated to alanine. Representative autoradiography (top) and Coomassie staining (bottom) images are shown. The plot shows the quantification of phosphorylation signals as mean ± SEM (n = 3) values. (D) Aligned amino acid sequences of mouse PTBP2 and PTBP1. RRMs are highlighted in gray and KIS-phosphorylated serines in red. Tyr244 in RRM2 is highlighted in bold type. (E) pLogo analysis (O’Shea et al., 2013). KIS preferentially phosphorylates serines (S) with high frequency (89.38%) followed by proline (P) at position +1 with a frequency of 41.67% and statistical significance (p < 0.05). Input sequences = 143.
-
Figure 2—figure supplement 1—source data 1
KIS in vitro kinase assays.
- https://cdn.elifesciences.org/articles/96048/elife-96048-fig2-figsupp1-data1-v2.zip
Figure 3 with 1 supplement
KIS kinase activity inhibits Ptbp2-exon-dependent exclusion.
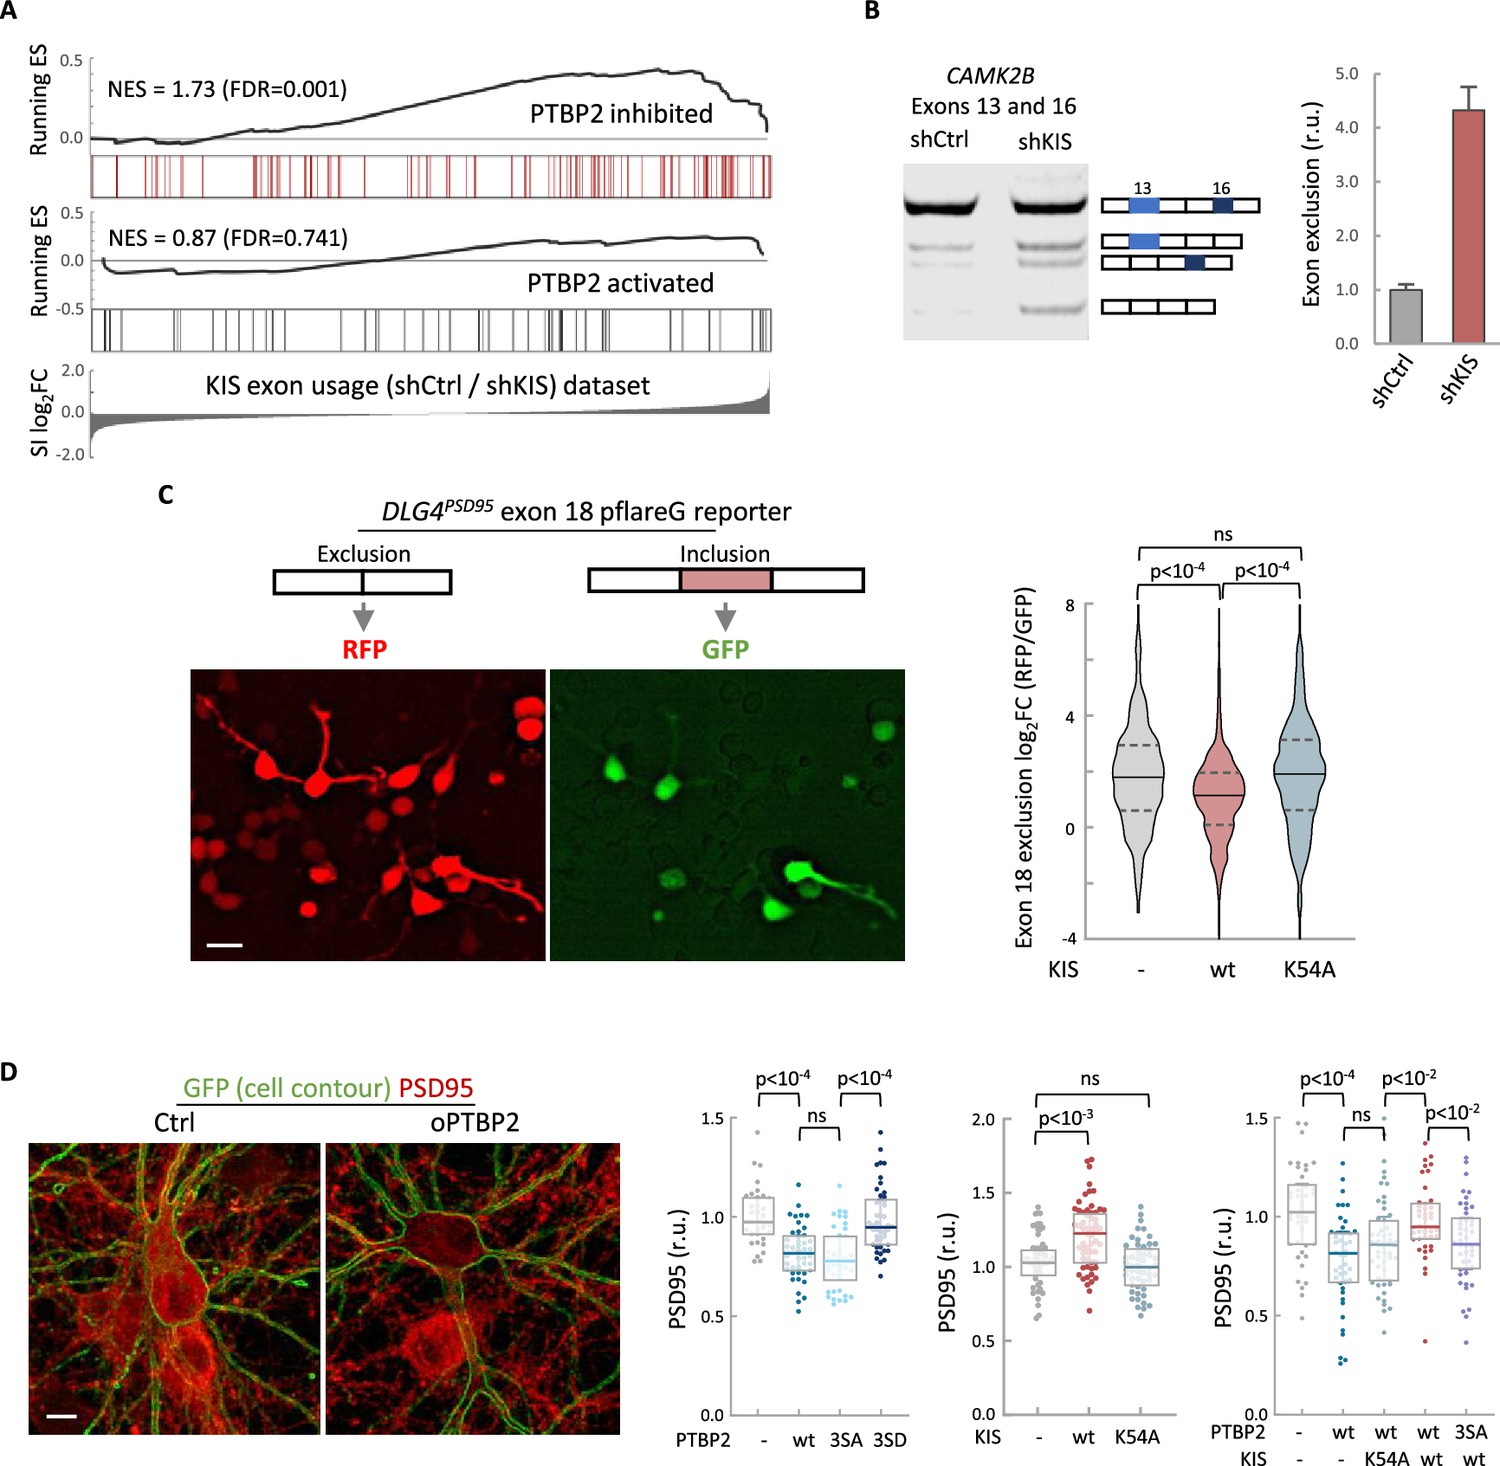
(A) Gene enrichment analysis of PTBP2-regulated exons. Barcode plots show the position of exons excluded (red) or included (gray) by PTBP2 within the transcriptomic dataset of exons upregulated by KIS. Normalized enrichment scores (NES) and the corresponding false-discovery rate (FDR) values are shown. (B) Semiquantitative RT-PCR of CAMK2B from control (shCtrl) and KIS knockdown neurons (shKIS). The level of isoforms displaying exon exclusion relative to the full-length isoform is plotted as mean ± standard error of the mean (SEM) (n = 3). (C) Neuroblastoma N2A cells co-transfected with dual-fluorescent reporter (Zheng et al., 2013) and KIS or KISK54A. DLG4 exon 18 exclusion is plotted as a function of the RFP to GFP fold change (log2FC) from ctrl (n = 672), KIS (n = 1054), or KISK54A (n = 970) expressing cells. Median ± Q values and the results of Mann–Whitney test are also shown. Scale bar, 20 µm. (D) PSD95 immunofluorescence of hippocampal neurons transfected at 5 DIV with vectors expressing PTBP2 and GFP as reporter, and fixed at 12 DIV. Plots show the quantification of PSD95 endogenous levels in single cells transfected with the indicated wild type and mutant proteins in three sets of experiments. Median ± Q values (n > 40) and the results of Mann–Whitney tests are also shown. Scale bar, 10 µm.
-
Figure 3—source data 1
CAMK2B exon exclusion analysis.
- https://cdn.elifesciences.org/articles/96048/elife-96048-fig3-data1-v2.zip
Figure 3—figure supplement 1

PTBP2 RNA-seq analysis.
(A) Gene enrichment analysis of PTBP2-regulated exons. Barcode plots show the position of exons excluded by PTBP2 within a KIS randomized exon usage dataset. Normalized enrichment scores (NES) and the corresponding false-discovery rate (FDR) values are shown. (B) Gene enrichment analysis of PTBP2-regulated exons applying our exon usage analysis (see Methods). Barcode plots show the position of exons excluded and included by PTBP2 within the transcriptomic dataset from PTBP2 KO cells (Vuong et al., 2016a). NES and corresponding FDR values are indicated. (C) Quantification of mRNA levels from KIS knockdown cortical neurons relative to control neurons. Bars represent mean ± standard error of the mean (SEM) (n = 3).
Figure 4 with 1 supplement
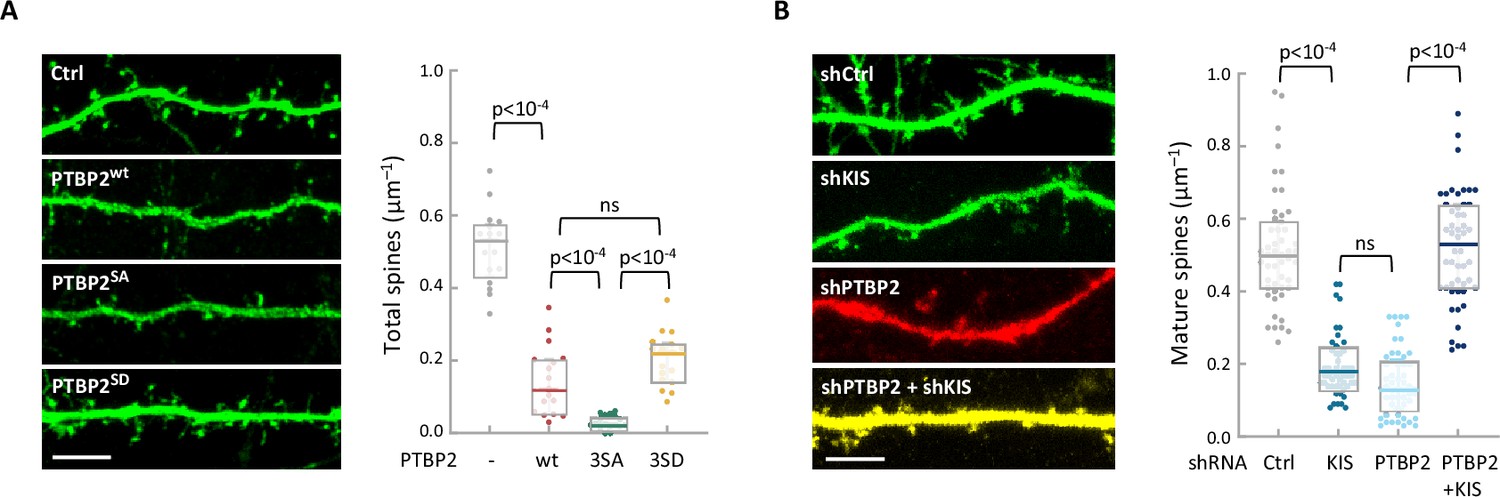
The functional interaction between KIS and PTBP2 has an essential role in regulating dendritic spine formation.
(A) Hippocampal neurons were co-transfected at 5 DIV with a GFP expression plasmid and either a control or PTBP2 expression plasmid. Spine morphology of transfected neurons at 14 DIV was visualized by GFP fluorescence (scale bar, 5 µm). Plot shows the number of spines/µm of 50 neurons per condition from three independent experiments. Median ± Q values and the results of Mann–Whitney tests are also shown. (B) Hippocampal neurons were transfected at 5 DIV with lentiviral vectors expressing GFP or RFP and control, KIS, or PTBP2 shRNAs. Spine morphology of transfected neurons at 14 DIV was visualized by GFP fluorescence (scale bar, 5 µm). Plot shows the number of mature spines/µm of 20 neurons/condition from three independent experiments. Median ± Q values and the results of Mann–Whitney tests are also shown.
Figure 4—figure supplement 1

The interplay between KIS and PTBP2 has an important role in neuronal development.
(A, B) Representative confocal images of neurons from the experiment shown in Figure 4. Hippocampal neurons were transfected at 5 DIV and analyzed at 14 DIV (scale bar, 20 µm). (C) PTBP2 mRNA levels in neuroblastoma N2A cells transfected with shCtrl or shPTBP2 and collected 4 days later. Bars represent mean ± standard error of the mean (SEM) (n = 3). Gene ontology (GO) terms significantly enriched (false-discovery rate [FDR] <0.05) of genes with exons upregulated by KIS and downregulated (D) or upregulated (E) by PTBP2.
Figure 5 with 1 supplement

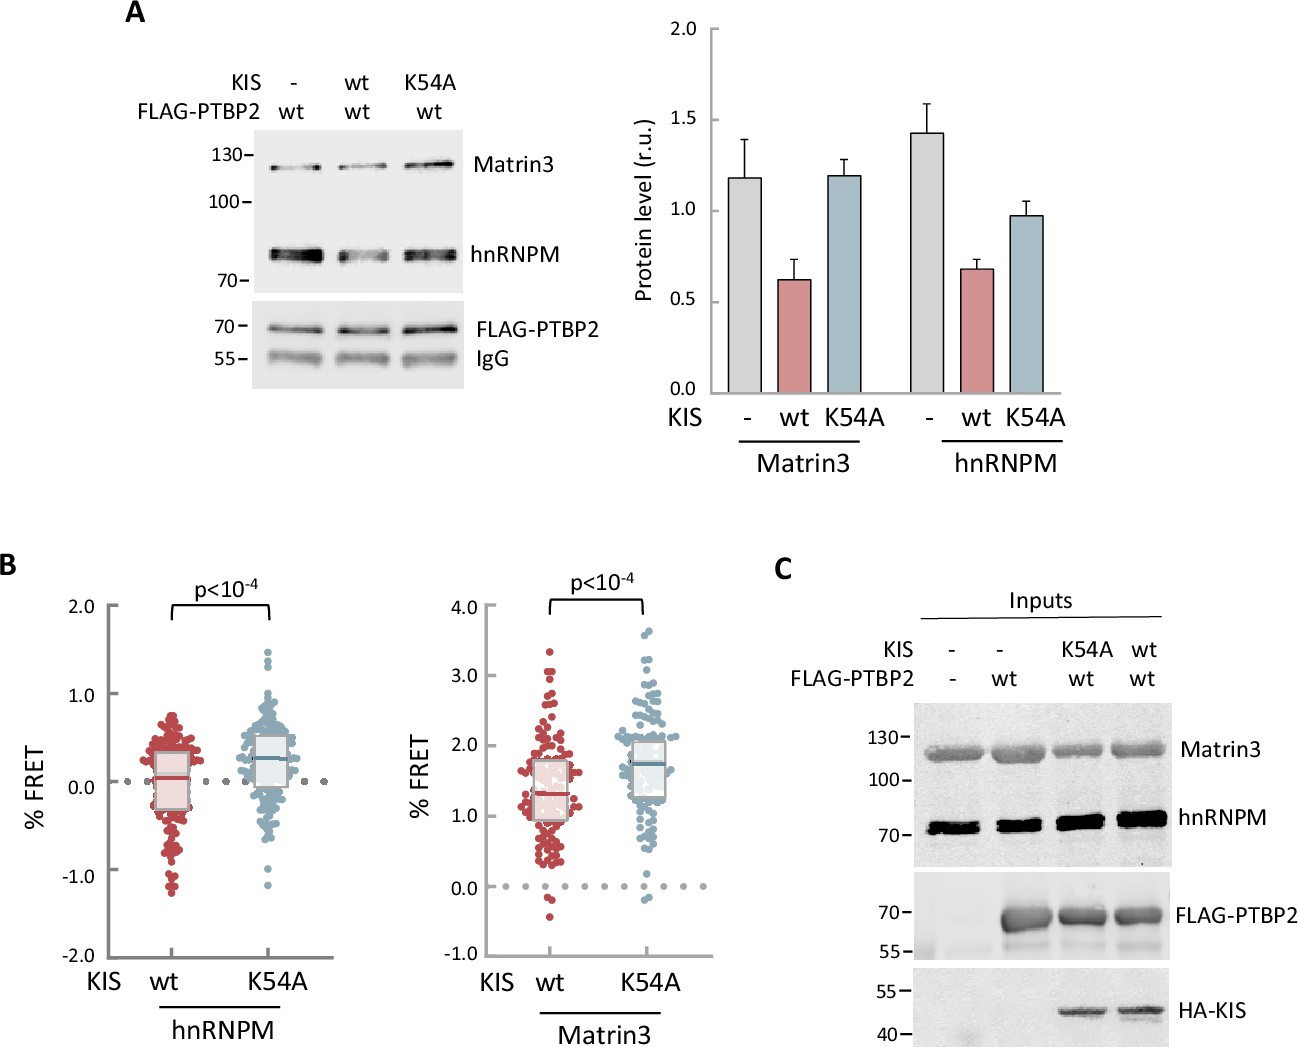
Phosphorylation by KIS disrupts PTBP2 protein complexes.
(A) Constructs expressing FLAG-PTBP2 and KIS, KISK54A were transiently transfected into HEK293T cells, and after 24 hr, cell lysates were subject to FLAG immunoprecipitation. Immunoprecipitates were analyzed by immunoblotting to detect endogenous Matrin3 and hnRNPM proteins. A representative blot is shown with empty vector as control (−). Plots show the quantification of endogenous protein levels relative to FLAG-PTBP2 in immunoprecipitates as mean ± standard error of the mean (SEM) (n = 3) values. (B) Bright-field (BF), fluorescence and Förster resonance energy transfer (FRET) images of representative nuclei from hippocampal neurons co-expressing GFP-PTBP2 and mScarlet-hnNRPM in combination with KIS or KISK54A proteins (scale bar, 5 µm). BF images are also shown (scale bar, 10 µm). Plot shows FRET levels from single neuron nuclei expressing KIS (n = 22) or KISK54A (n = 26) as median ± Q values. The results of Mann–Whitney test are also shown.
-
Figure 5—source data 1
hnRNPM and Matrin3 in FLAG-PTBP2 immunoprecipitates in vivo.
- https://cdn.elifesciences.org/articles/96048/elife-96048-fig5-data1-v2.zip
Figure 5—figure supplement 1
In vitro and in vivo experiments showing dissociation of splicing complexes by KIS kinase activity.
(A) Cell lysates from HEK293T cells expressing FLAG-PTBP2 protein were incubated with KIS recombinant proteins purified from bacteria as His fusions. FLAG immunoprecipitates were analyzed by immunoblotting to detect endogenous Matrin3 and hnRNPM proteins. A representative blot is shown with empty vector as control (−). Plots show the quantification of endogenous protein levels relative to FLAG-PTBP2 in immunoprecipitates as mean ± standard error of the mean (SEM) (n = 3). (B) HEK293T cells co-expressing GFP-PTBP2 and mScarlet-hnNRPM or mScarlet-Matrin3 in combination with HA-KIS or KISK54A proteins. Plots show the Förster resonance energy transfer (FRET) levels from single neuron nuclei as median ± Q values (n >100). The results of Mann–Whitney test are also shown. (C) A representative blot of input samples from the experiment shown in Figure 5A. Constructs expressing FLAG-PTBP2, HA-KIS, and HA-KISK54A were transiently co-transfected into HEK293T cells, and after 24 hr, cell lysates were subject to FLAG immunoprecipitation. Immunoprecipitates were analyzed by immunoblotting to detect endogenous Matrin3 and hnRNPM proteins.
-
Figure 5—figure supplement 1—source data 1
hnRNPM and Matrin3 in FLAG-PTBP2 immunoprecipitates in vitro.
- https://cdn.elifesciences.org/articles/96048/elife-96048-fig5-figsupp1-data1-v2.zip
-
Figure 5—figure supplement 1—source data 2
Representative blot of input samples from Figure 5A.
- https://cdn.elifesciences.org/articles/96048/elife-96048-fig5-figsupp1-data2-v2.zip
Figure 6 with 1 supplement
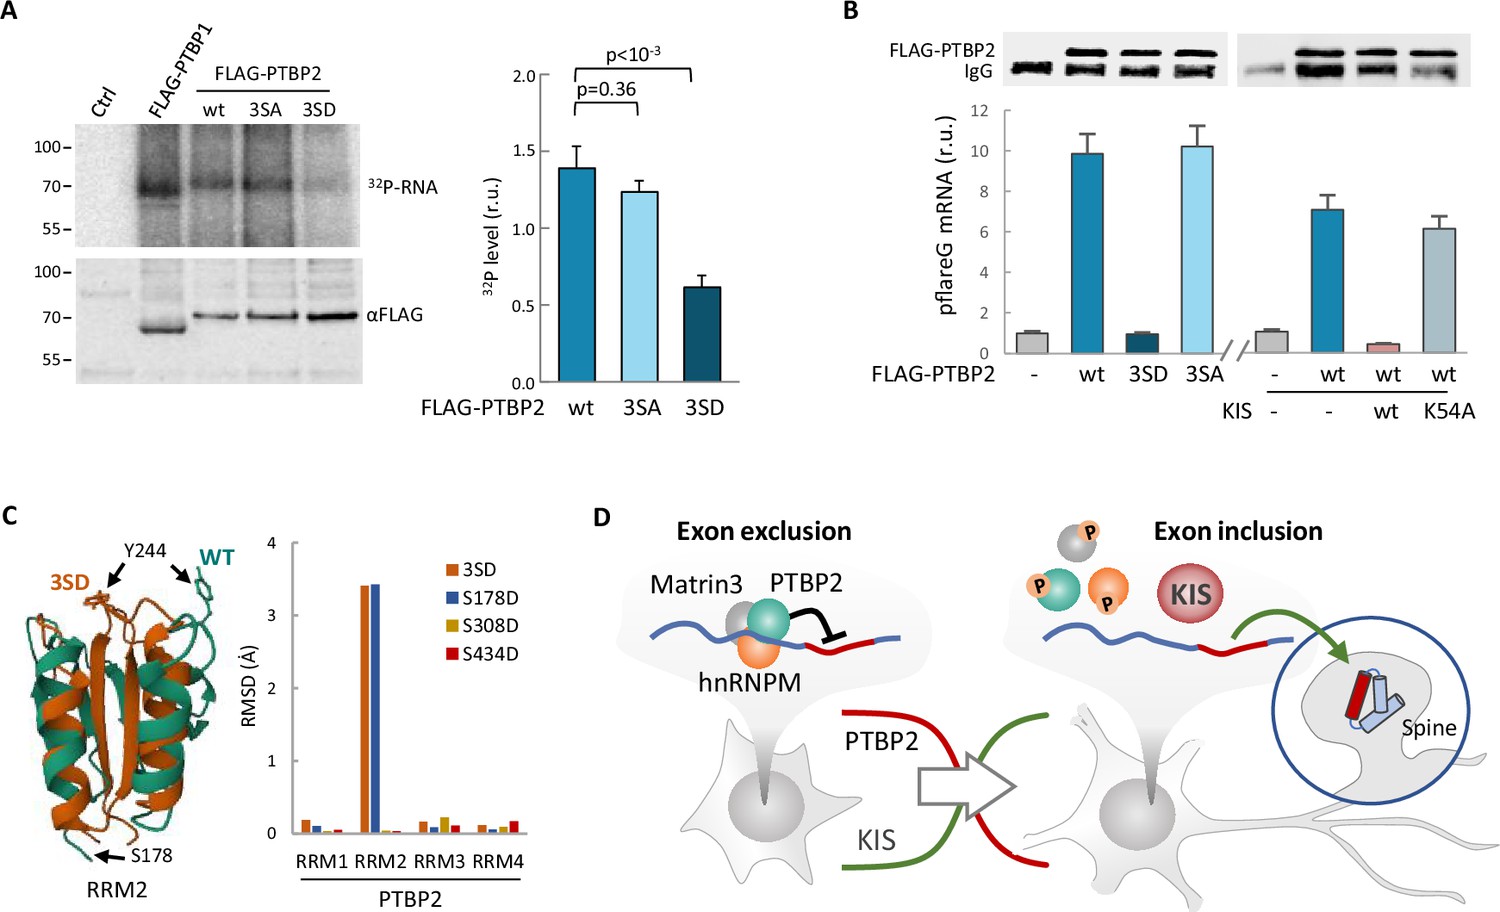
Phosphorylation by KIS compromises PTBP2 RNA-binding ability.
(A) PTBP1 and PTBP2 CLIPs were performed in HEK293T cells expressing FLAG-PTBP1 and FLAG-PTBPs proteins. UV RNA crosslinked and co-precipitated with FLAG-PTBP1 and FLAG-PTBP2s was labeled with 32P-ATP. A representative radiogram gel is shown in the upper image, while the FLAG immunoprecipitates blot is shown in the bottom image. Plot shows the quantification of 32P signal relative to FLAG-PTBP2 immunoprecipitates. Bars represent mean ± standard error of the mean (SEM) (n = 3). (B) PTBP2 CLIP was carried out in HEK293T cells transfected with the pFlareG-PSD95 reporter in combination with plasmid vectors expressing the indicated PTBP2 and KIS proteins. UV-crosslinked pFlareG mRNA co-precipitated with FLAG-PTBP2 was analyzed by RT-qPCR and normalized relative to FLAG-PTBP2 in immunoprecipitates (upper blots). Bars represent mean ± SEM (n = 3). (C) AlphaFold2 prediction of the RRM2 domain from wild-type (green) and 3SD (orange) PTBP2. The different orientation of Tyr244 is highlighted. Plot shows the root-mean-squared deviation (RMSD) values of the four RRM domains in the different phosphomimetic PTBP2 mutants. (D) PTBP2 protein complexes inhibit gene expression through exon exclusion in neuronal precursors whereas, in differentiated neurons, phosphorylation by KIS dissociates PTBP2 protein complexes, which, by being released from the pre-mRNA, allow inclusion of the exon. Since KIS and PTBP2 expression levels are relatively inverted during brain development, phosphorylation-dependent inhibition of PTPB2 by KIS would generate a molecular switch linking transcriptional and alternative exon usage programs during neuronal differentiation.
-
Figure 6—source data 1
PTBP2 RNA binding by CLIP.
- https://cdn.elifesciences.org/articles/96048/elife-96048-fig6-data1-v2.zip
-
Figure 6—source data 2
FLAG-PTBP2 immunoprecipitated levels for CLIP analysis in Figure 6B.
- https://cdn.elifesciences.org/articles/96048/elife-96048-fig6-data2-v2.zip
Figure 6—figure supplement 1

AlphaFold2 predicts structural alterations in the triple 3SD mutants mainly affecting RRM2.
(A) AlphaFold2 prediction of the four RRM domains from wild-type (green) and 3SD (orange) PTBP2. (B) Expression variability of KIS and PTBP2 in single-cell transcriptomic data from hippocampal neurons (Perez et al., 2021). The plot shows relative levels of ACTB, UHMK1, and PTBP2 mRNAs from single-cell somas. The coefficient of variation (CV) is indicated at the top.
Tables
Key resources table
| Reagent type (species) or resource | Designation | Source or reference | Identifiers | Additional information |
|---|---|---|---|---|
| Strain, strain background (M. musculus) | RjOrl:SWISS | Janvier Labs | Pregnant female | |
| Cell line (H. sapiens) | HEK 293T | ATCC | CRL-11268 | From human embryo kidney tissue |
| Cell line (M. musculus) | Neuro-2a | ATCC | CCL-131 | Mouse neuroblasts isolated from brain tissue |
| Recombinant DNA reagent | pcDNA3-FLAG-PTBP1 | This work | FLAG tag fused to PTBP1 in pcDNA3 | |
| Recombinant DNA reagent | pcDNA3-FLAG-PTBP2 | This work | FLAG tag fused to PTBP2 in pcDNA3 | |
| Recombinant DNA reagent | pEGFP-C3 | Addgene | 6082-1 | N-terminal tagging vector with GFP |
| Recombinant DNA reagent | pEGFP-PTBP2 | This work | PTBP2 fused to EGFP | |
| Recombinant DNA reagent | mScarlet-C1 | Addgene | 85044 | N-terminal tagging vector with Scarlet |
| Recombinant DNA reagent | mScarlet-Matr3 | This work | Matr3 fused to Scarlet | |
| Recombinant DNA reagent | mScarlet-hnRNPM | This work | hnRNPM fused to Scarlet | |
| Recombinant DNA reagent | pGEX-KG | ATCC | 77103 | Bacterial expression vector expressing GST tag |
| Recombinant DNA reagent | pET28a | Novagen | 69864-3 | Bacterial expression vector expressing His tag |
| Recombinant DNA reagent | pcDNA3-FLAG-PTBP1 | This work | PTBP1 fused to FLAG tag | |
| Recombinant DNA reagent | pcDNA3-FLAG-PTBP2 | This work | PTBP2 fused to FLAG tag | |
| Recombinant DNA reagent | pFlareG-PSD95 exon 18 | Addgene | 90266 | Minigene reporter for alternative splicing analysis |
| Recombinant DNA reagent | pCMV-dR8.2 dvpr | Addgene | 8455 | 2nd generation lentiviral packaging plasmid |
| Recombinant DNA reagent | pCMV-VSV-G | Addgene | 8454 | Lentiviral packaging plasmid expressing envelope protein |
| Recombinant DNA reagent | pLKO.3G | Addgene | 14748 | Lentiviral plasmid expressing GFP |
| Recombinant DNA reagent | pLKO.3-DsRed shPTBP2 | This work | Lentiviral vector expressing DsRed and shRNA sequence against PTBP2 | |
| Chemical compound, drug | α-FLAG M2 (monoclonal mouse) affinity gel beads | Merck-Sigma | A2220 | |
| Antibody | α-FLAG M2 (monoclonal mouse) | Merck-Sigma | F3165 | 1:500 (WB) |
| Antibody | α-Matr3 (rabbit polyclonal) | Bionova | A300-591A-T | 1:500 (WB) |
| Antibody | α-hnRNP M3/4 (rabbit polyclonal) | Bionova | A303-910A-T | 1:500 (WB) |
| Antibody | α-mouse IRDye 680RD (goat polyclonal) | LI-COR Biosciences | 926-68070 | 1:1000 (WB) |
| Antibody | α-rabbit HRP (goat polyclonal) | Thermo Fisher | 31460 | 1:1000 (WB) |
| Antibody | α-PSD95 (mouse monoclonal) | Millipore | MABN68 | 1:400 (IF) |
| Antibody | α-SRRM2 (rabbit polyclonal) | Merck-Sigma | HPA066181 | 1:250 (IF) |
| Antibody | α-GFP Alexa 488 (rabbit polyclonal) | Thermo Fisher | A21311 | 1:1000 (IF) |
| Antibody | α-mouse Alexa 568 (donkey polyclonal) | Life Technologies | A10037 | 1:1000 (IF) |
| Antibody | α-rabbit Alexa 568 (rabbit polyclonal) | Life Technologies | A10042 | 1:1000 (IF) |
| Antibody | α-rat Alexa 568 (goat polyclonal) | Invitrogen | A11077 | 1:1000 (IF) |
| Commercial assay or kit | CalPhos mammalian transfection kit | Clontech | 631312 | |
| Commercial assay or kit | Lipofectamine 2000 | Invitrogen | 11668030 | |
| Commercial assay or kit | FuGene HD | Promega | E2311 | |
| Commercial assay or kit | NucleoSpin Plasmid Kit | Macherey-Nagel | 740588 | |
| Commercial assay or kit | NucleoBond Xtra Midi Plus EF Kit | Macherey-Nagel | 740422 | |
| Commercial assay or kit | EZNA total RNA purification Kit | Omega | R6834-01 | |
| Software, algorithm | FRETmapJ | This work | https://www.ibmb.csic.es/en/department-of-cells-and-tissues/control-of-local-mrna-expression/ | |
| Software, algorithm | SpineJ | Pedraza et al., 2014 | https://www.ibmb.csic.es/en/department-of-cells-and-tissues/control-of-local-mrna-expression/ | |
| Software, algorithm | Prism (version 9.5.1) | GraphPad | RRID: SCR_002798 | https://graphpad.com/features |
Additional files
-
Supplementary file 1
RNA-seq datasets from cortical neurons.
- https://cdn.elifesciences.org/articles/96048/elife-96048-supp1-v2.xlsx
-
Supplementary file 2
Phosphoproteomic data from HEK293T expressing KIS and KISK54A.
- https://cdn.elifesciences.org/articles/96048/elife-96048-supp2-v2.xlsx
-
Supplementary file 3
Primers and vectors used in this study.
- https://cdn.elifesciences.org/articles/96048/elife-96048-supp3-v2.xlsx
-
MDAR checklist
- https://cdn.elifesciences.org/articles/96048/elife-96048-mdarchecklist1-v2.pdf
Download links
A two-part list of links to download the article, or parts of the article, in various formats.
Downloads (link to download the article as PDF)
Open citations (links to open the citations from this article in various online reference manager services)
Cite this article (links to download the citations from this article in formats compatible with various reference manager tools)
KIS counteracts PTBP2 and regulates alternative exon usage in neurons
eLife 13:e96048.
https://doi.org/10.7554/eLife.96048


