Clustered gamma-protocadherins regulate cortical interneuron programmed cell death
- Department of Neurological Surgery and The Eli and Edythe Broad Center of Regeneration Medicine and Stem Cell Research, University of California, San Francisco, United States
- Department of Physiology and Center for Integrative Neuroscience, University of California, San Francisco, United States
- Department of Biochemistry and Molecular Biophysics, Columbia University, United States
- Department of Otolaryngology-Head and Neck Surgery, University of California, San Francisco, United States
- Kavli Institute for Fundamental Neuroscience, University of California, San Francisco, United States
Figures
Figure 1 with 1 supplement
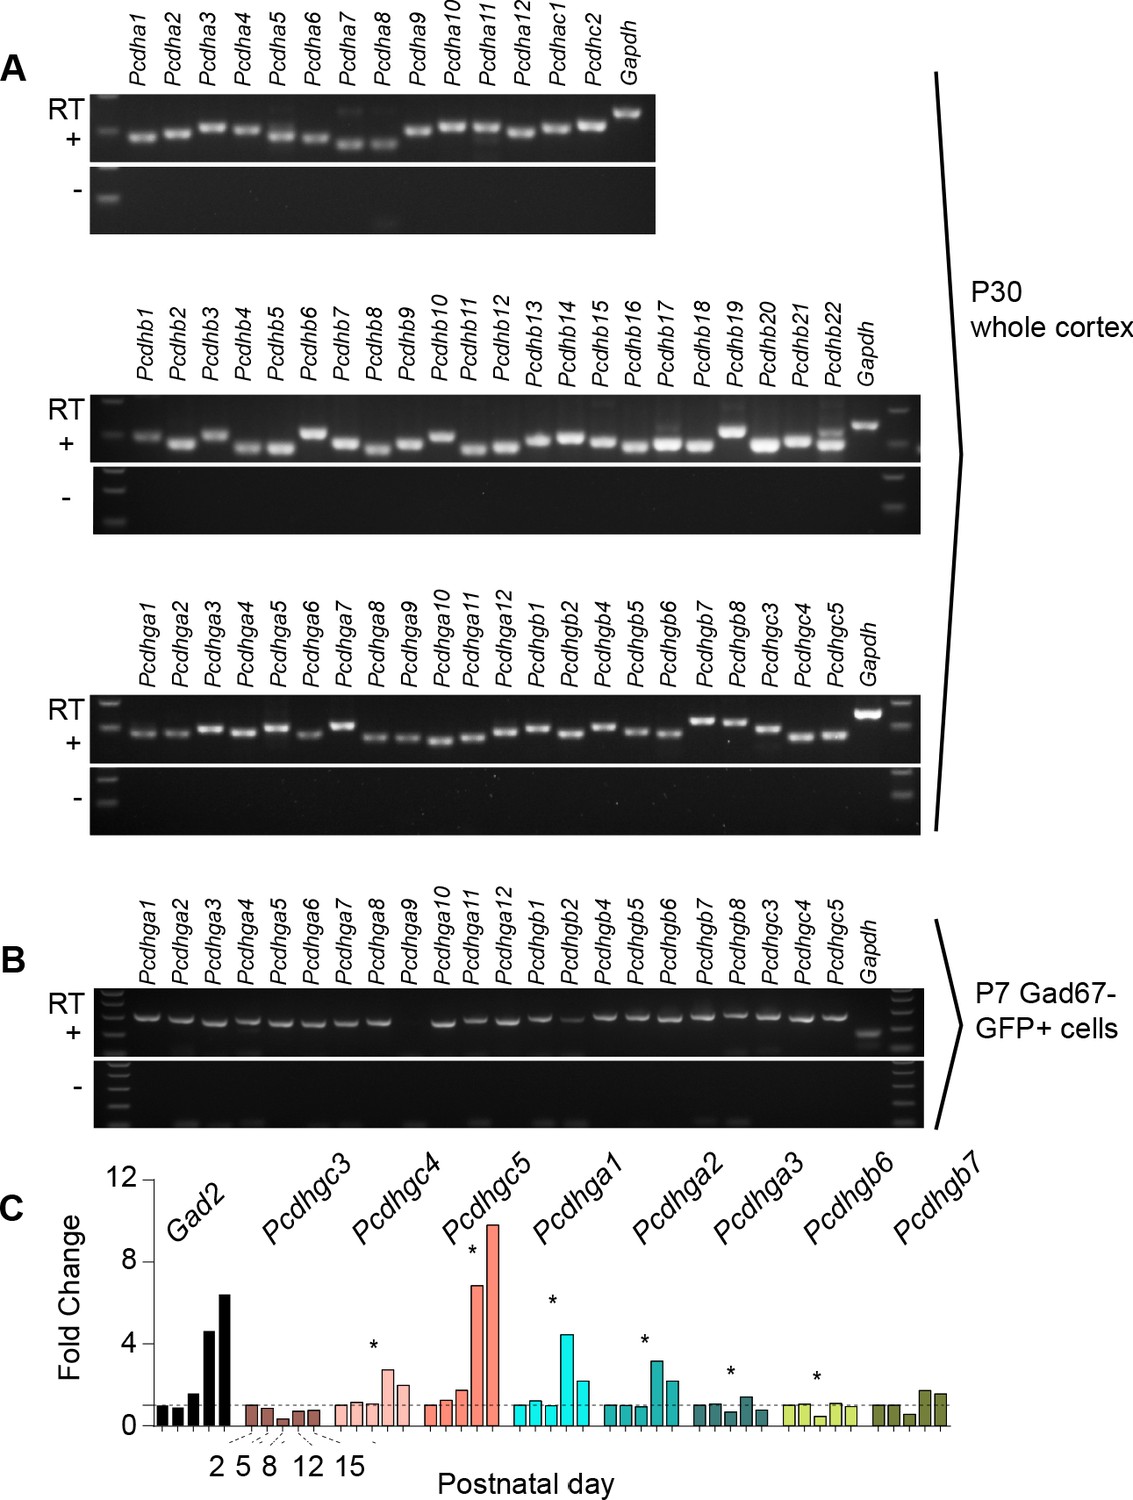
Expression of clustered Pcdhs in the mouse cortex and purified cortical GABAergic cells.
( A) PCR analysis of clustered Pcdh and Gapdh gene expression in P30 whole cortex extracts. (B) PCR analysis of Pcdhg and Gapdh gene expression in purified P7 cortical GABAergic cells. (C) Quantification of target gene mRNA levels at various postnatal stages (P2, P5, P8, P12, P15) in purified cortical GABAergic cells. P2 mRNA levels used as a reference for each gene (Kruskal-Wallis test, P value = 0.0007 [ Pcdhgc4], P value < 0.0001 [Pcdhgc5], P value = 0.015 [Pcdhga1], P value = 0.024[Pcdhga2], P value = 0.003[Pcdhga3], P value = 0.038[Pcdhgb6]; n = 3 technical replicas]. Significant p values are marked with*. See Figure 1—source data 1 for followup of comparisons.
-
Figure 1—source data 1
Pcdhg expression in cortex.
- https://cdn.elifesciences.org/articles/55374/elife-55374-fig1-data1-v2.xlsx
Figure 1—figure supplement 1
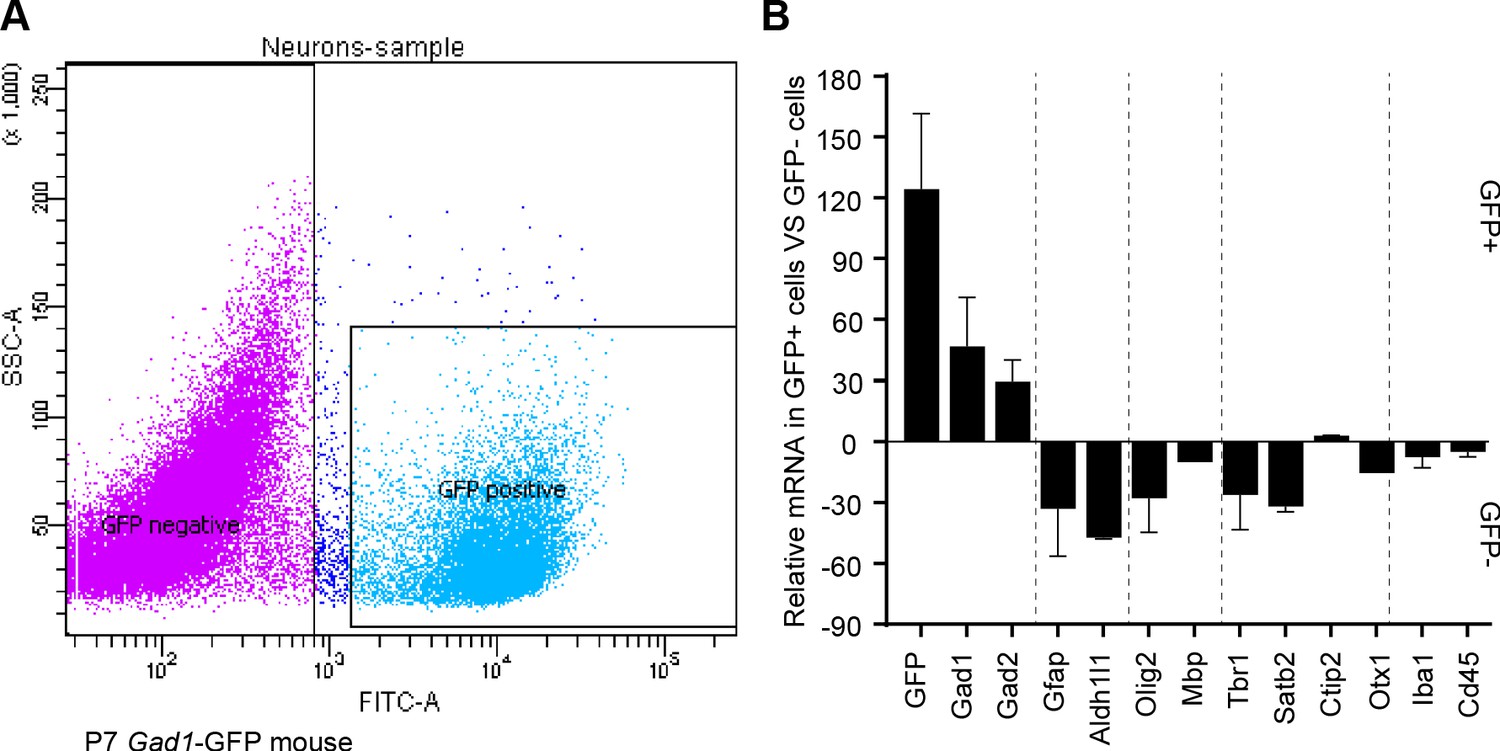
GABAergic markers are enriched in GFP positive FACS-sorted cells from Gad1-GFP mice.
(A) Representative flow cytometry plot, sorting GFP+ cIN from Gad1-GFP mice. (B) Real-time RT-PCR analysis of GABAergic and non- GABAergic markers in positive and negative FACS-sorted GFP cells from P7 Gad1-GFP mice.
Figure 2 with 2 supplements
Reduced number of GABAergic cINs in Pcdhg-deficient mice.
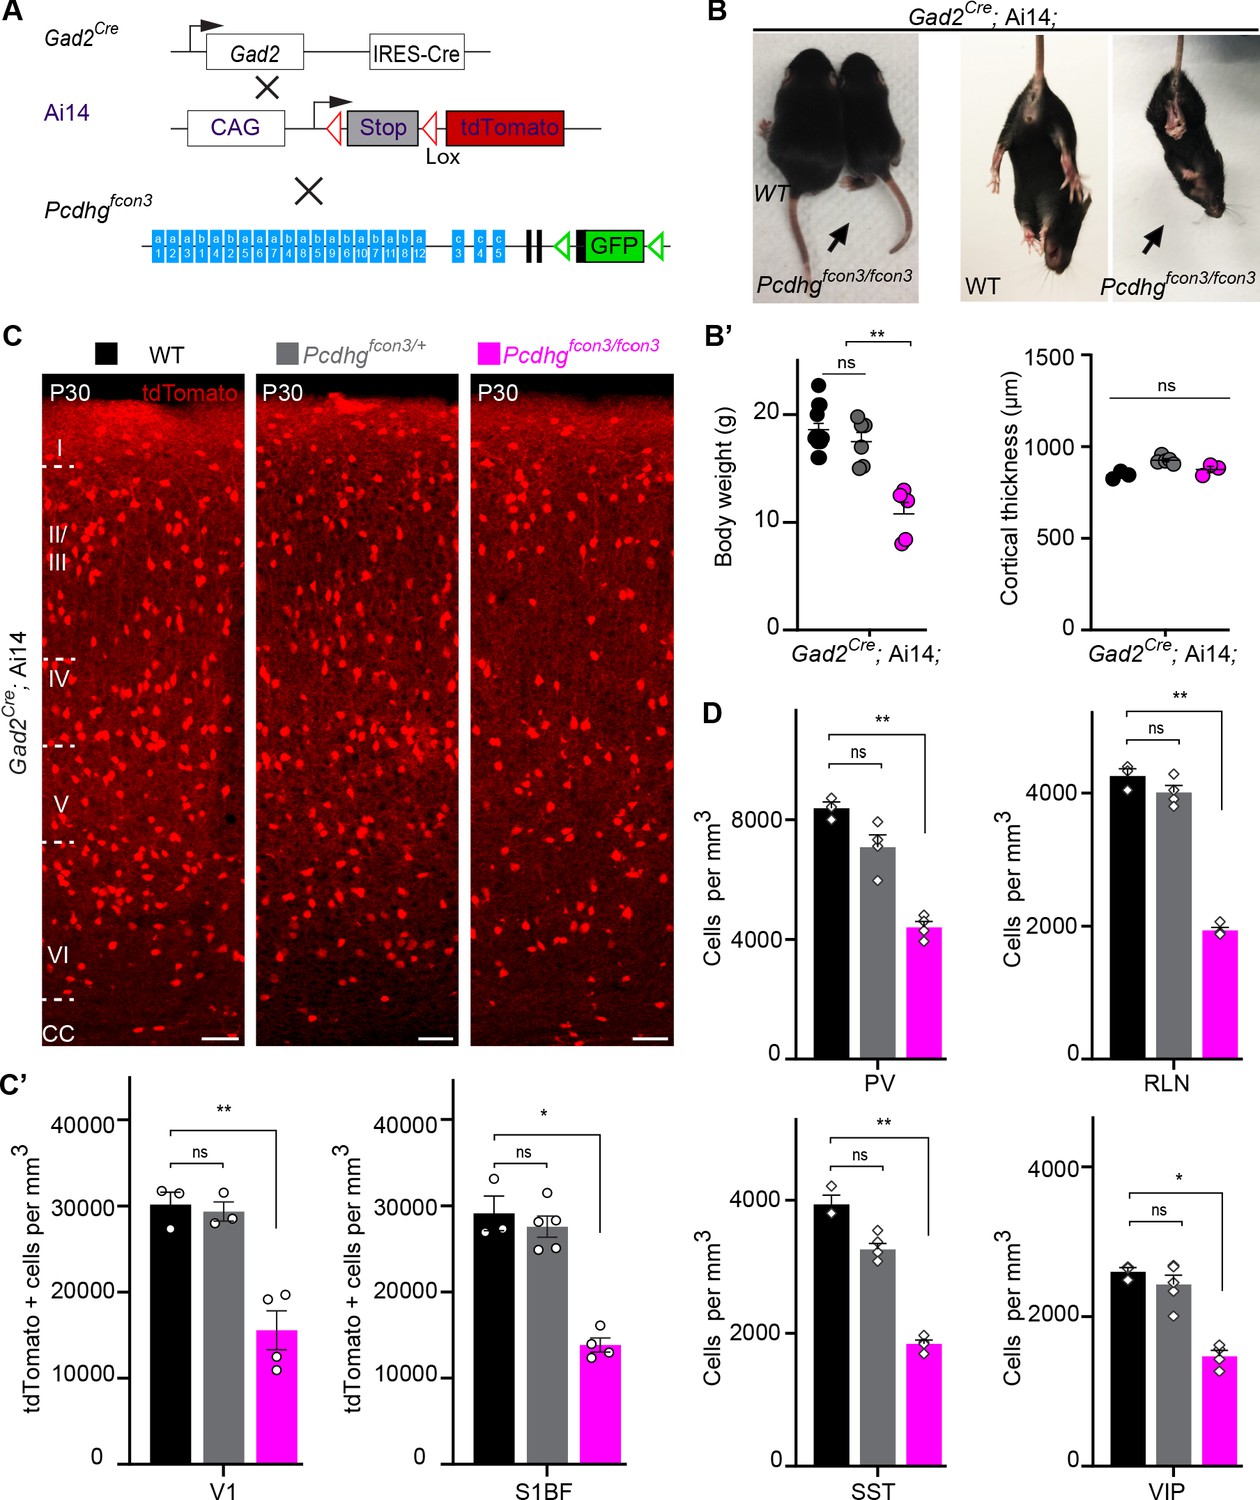
(A) Mutant mice with loss of Pcdhg in GABAergic neurons were generated by crossing conditional Pcdhgfcon3 mice to Pan-GABAergic Cre driver (Gad2) mice. The conditional Ai14 reporter was used to fluorescently label Gad2-expressing cells. (B) Photographs of P21 Gad2Cre;Ai14 mice that are wild type (WT) or mutant (Pcdhgfcon3/fcon3) for Pcdhg. (B’) Body weight and cortical thickness measurements in P30 Gad2Cre;Ai14;Pcdhg+/+ (Pcdhg WT), Gad2Cre;Ai14;Pcdhgfcon3/+ (Pcdhg HET), and Gad2Cre;Ai14;Pcdhgfcon3/fcon3 (Pcdhg mutant) mice(Kruskal-Wallis test, P value=0.0027, adjusted p values **p=0.0017, n = 12 mice [Pcdhg WT], n = 7 mice [Pcdhg HET] and n = 5 mice [Pcdhg mutant]). (C) Photographs of coronal sections in primary visual cortex (V1) of P30 Gad2Cre;Ai14; Pcdhg WT (left), Pcdhg HET (middle) and Pcdhg mutant (right) mice. All cortical layers are similarly affected (Figure 2—figure supplement 2). Scale bar, 100 μm. (C’) Quantifications of tdTomato+ cell density in V1 and somatosensory (S1BF) cortex of P30 Gad2Cre;Ai14 Pcdhg WT(black), Pcdhg HET (grey), and Pcdhg mutant (magenta) mice (Kruskal-Wallis test; for V1 (P value = 0.006), for S1BF (P value = 0.009); adjusted p values **p=0.0180, *p=0.036, n = 3–5 mice of each genotype). (D) Quantifications of cIN subtype density in V1 cortex at P30. All four non-overlapping cIN subtypes (PV, SST, RLN, and VIP) were similarly reduced in numbers in Gad2Cre;Ai14;Pcdhgfcon3/fcon3 mice (Pcdhg mutant, magenta) compared to WT controls (Kruskal-Wallis test; for PV (P value = 0.0002), for SST (P value=0.0021), for RLN (P value = 0.0012), and for VIP (P value=0.0093); adjusted p values **p=0.004 (PV), **p=0.0073(SST), **p=0.0093(RLN), *p=0.0365 (VIP), n = 3–5 mice of each genotype).
-
Figure 2—source data 1
Quantification of GABAergic cINs, body weight and cortical thickness measurements in controls and Pcdhg deficient mice.
- https://cdn.elifesciences.org/articles/55374/elife-55374-fig2-data1-v2.xlsx
Figure 2—figure supplement 1

Reduced number of GABAergic cIN subtypes in Pcdhg-deficient mice.
(A) Representative photographs of the primary visual cortex (V1) in Gad2Cre;Ai14;Pcdhg WT, Pcdhg heterozygote and Pcdhg mutant mice. Gad2Cre;Ai14 sections were stained for PV, SST, RLN or VIP. Scale bars, 50 μm.
Figure 2—figure supplement 2

Reduced number of GABAergic cINs across cortical layers in Pcdhg-deficient mice.
(A) Representative photographs of the primary visual cortex (V1) in Gad2Cre;Ai14;Pcdhg+/+ (Pcdhg WT) and Gad2Cre;Ai14;Pcdhgfcon3/fcon3 (Pcdhg mutant) mice. Sections stained for tdTomato and DAPI. Scale bars, 50 μm. (B) Quantification of tdTomato+ Gad2Cre-derived cINs in layers I-VI of visual cortex (V1) in Pcdhg WT (black bars) and Pcdhg mutant mice(magenta bars) (2-way ANOVA, Fgenotype = 244.83, P value<0.001; adjusted p values *p=0.02, **p=0.01, ***p<0.0001; n = 3 mice per genotype). (B’) Layer distribution of tdTomato+ Gad2Cre-derived cINs shown as percentage from total tdTomato+ cells in V1 of Pcdhg WT and Pcdhg mutant mice(2-way ANOVA, Fgenotype = 0.01, P value = 0.93, adjusted p values **p=0.01; n = 3 mice per genotype).
-
Figure 2—figure supplement 2—source data 1
Quantification of all GABAergic cINs by cortical layer in the visual cortex of controls and Pcdhg-deficient mice.
- https://cdn.elifesciences.org/articles/55374/elife-55374-fig2-figsupp2-data1-v2.xlsx
Figure 3 with 4 supplements
Loss of Pcdhg genes targeted to Nkx2.1 expressing cells results in selective loss of cIN derived from the MGE.
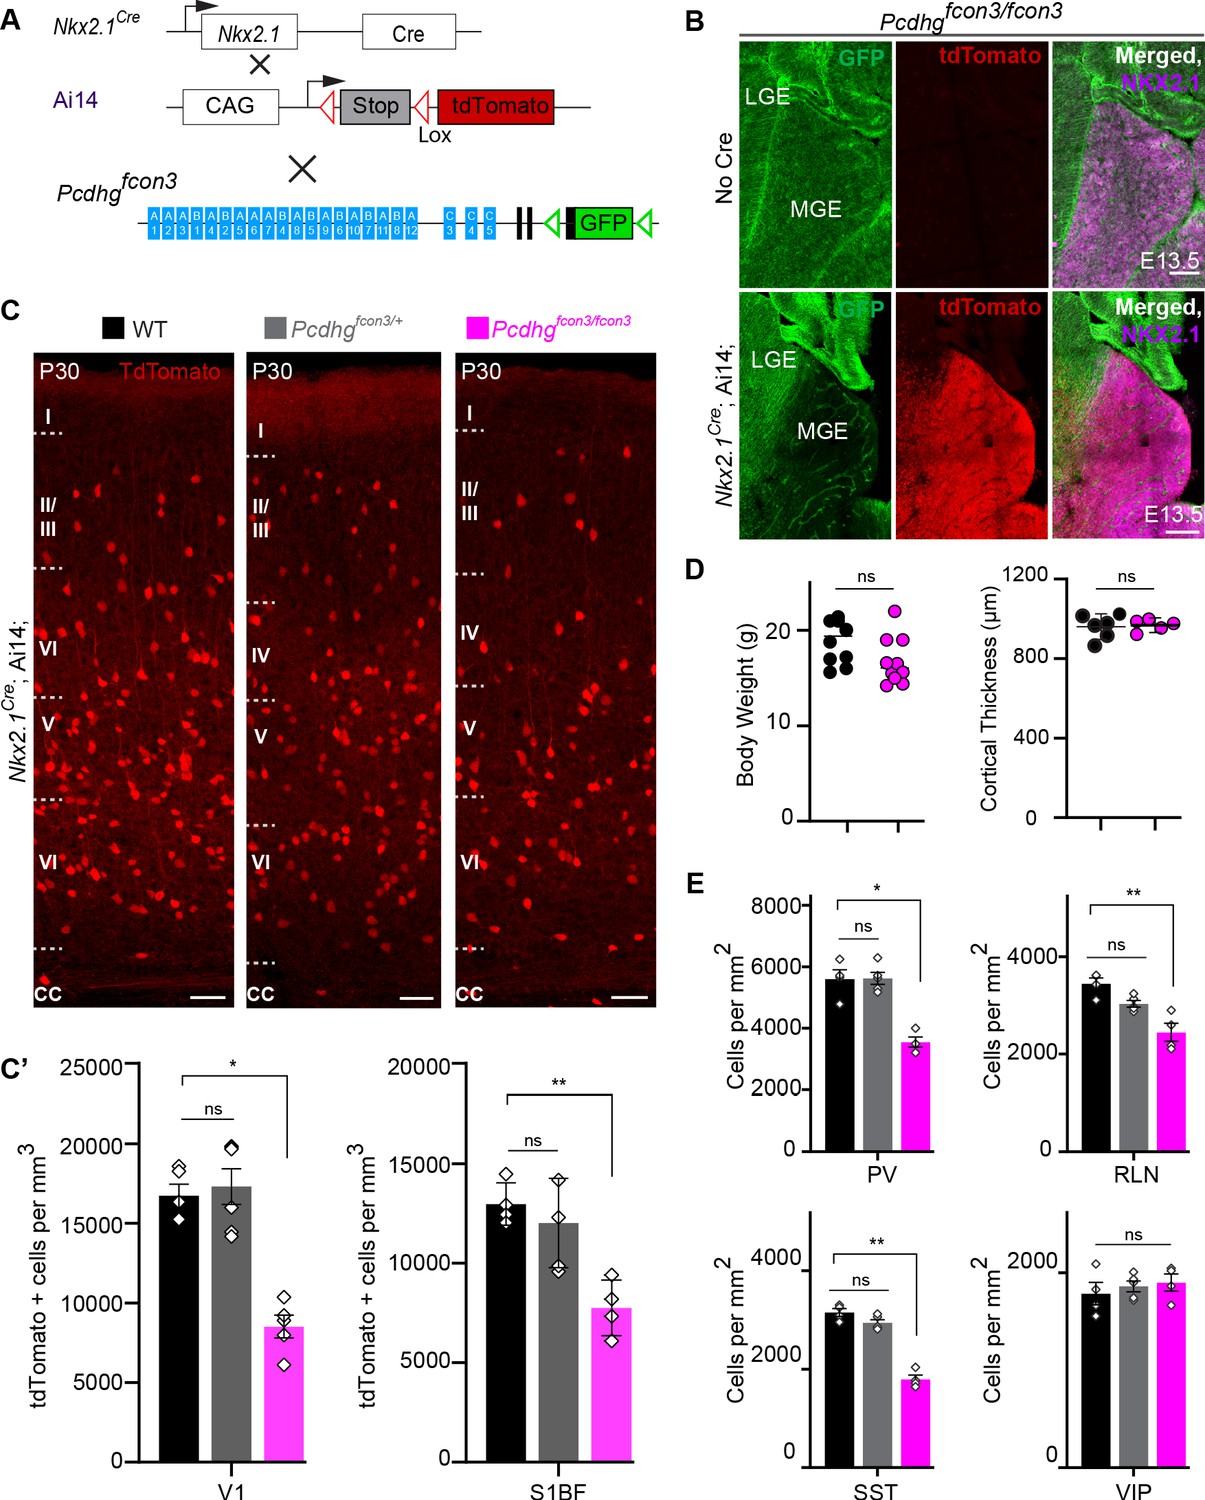
( A) Mutant mice with loss of Pcdhg in MGE-derived cIN were generated by crossing Pcdhgfcon3 mice to Nkx2.1Cre mice. The conditional Ai14 line was used to fluorescently label MGE-derived cells. (B) Pcdhgfcon3/fcon3 mice (at E13.5; top panels) carrying the Pcdhg mutant allele, but not Cre, show robust expression of GFP in the MGE. In contrast, in Nkx2.1Cre;Ai14;Pcdhgfcon3/fcon3 mice (at E13.5; bottom panels), carrying the Pcdhg mutant allele and expressing Cre, GFP expression was eliminated from the MGE. Note NKX2.1 staining (magenta) in the panels on the right delineates MGE/POA (preoptic area). The few cells left expressing GFP in the MGE are blood vessels and are tdTomato negative. (C) Photographs of coronal sections of the primary visual cortex (V1) in Nkx2.1Cre;Ai14;Pcdhg+/+ (Pcdhg WT), Nkx2.1Cre;Ai14;Pcdhgfcon3/+ (Pcdhg HET) and Nkx2.1Cre;Ai14;Pcdhgfcon3/fcon3 (Pcdhg mutant). Scale bar, 100 μm. (C’) Quantification of the density of tdTomato+ cells in V1 and S1BF cortex of P30 Nkx2.1Cre;Ai14;Pcdhg WT (black), Pcdhg HET (grey) and Pcdhg mutant (magenta) mice. The number of Nkx2.1-derived cells was significantly reduced in Nkx2.1Cre;Ai14;Pcdhg mutant mice compared to WT controls(Kruskal-Wallis test; for V1(P value=0.002), for S1BF (P value=0.0065), adjusted p values *p=0.0232, **p=0.0168 (S1), n = 4–6 mice of each genotype). (D) Body weight and cortex thickness measurements in Nkx2.1Cre;Ai14;Pcdhg WT (black) and Pcdhg mutant (magenta) mice at P30. Body weight and cortical thickness were not significantly affected by loss of Pcdhg (Mann-Whitney test, body weight (p=0.0547, n = 10 mice of each genotype), cortical thickness (p=0.2857, n = 4–5 mice of each genotype). (E) Quantification of tdTomato+ cIN subtypes in V1 mouse cortex at P30. Nkx2.1Cre;Ai14;Pcdhg mutant mice (magenta) had significantly reduced numbers of MGE-derived parvalbumin (PV)+, somatostatin (SST)+, and Reelin (RLN)+ cells compared to WT controls. In contrast VIP+ cells, which are derived from the CGE, were not significantly affected (Kruskal-Wallis test; for PV (P value = 0.0113), for SST (P value=0.0009), for RLN (P value = 0.0014), and for VIP (P value=0.636); adjusted p values *p=0.0113 (PV), **p=0.0055 (SST), **p=0.0055 (RLN), n = 4–5 mice of each genotype).
-
Figure 3—source data 1
Quantification of Nkx2.1-derived cINs, body weight and cortical thickness measurements in controls and Pcdhg-deficient mice.
- https://cdn.elifesciences.org/articles/55374/elife-55374-fig3-data1-v2.xlsx
Figure 3—figure supplement 1
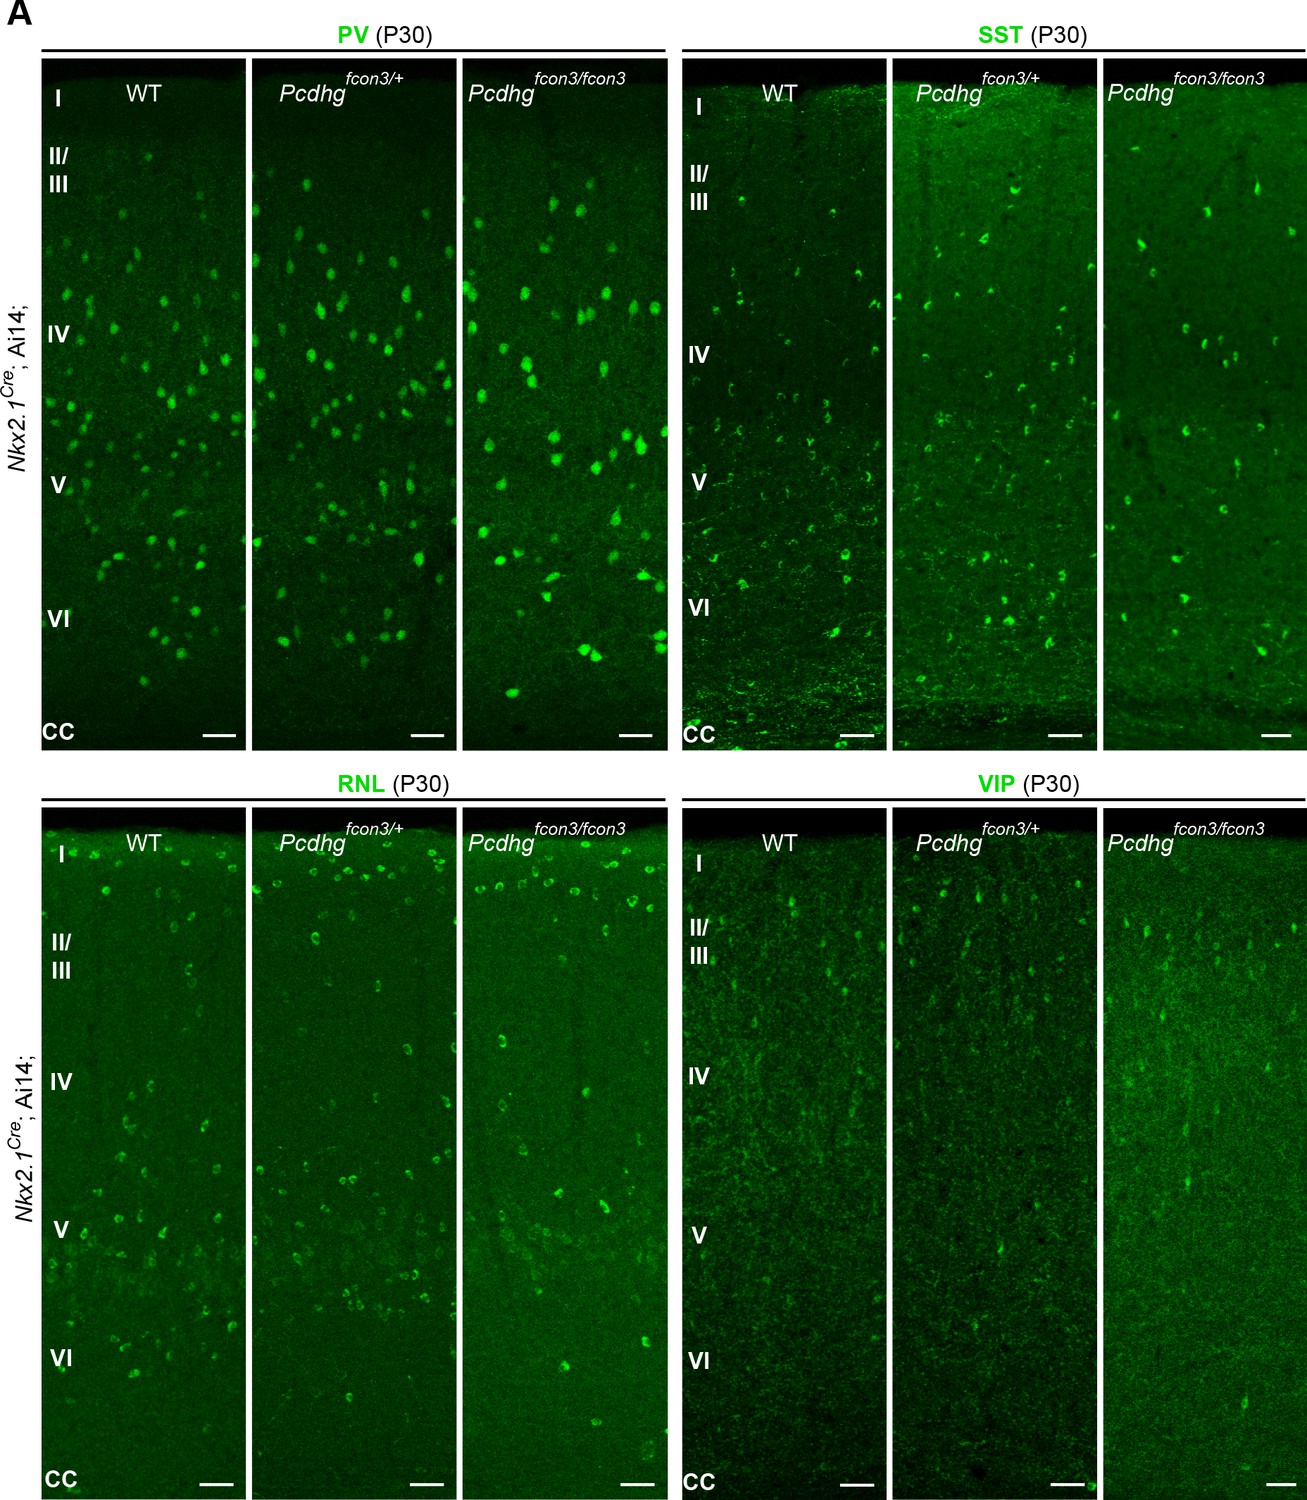
Reduced number of MGE cIN subtypes after loss of Pcdhg in Nkx2.1-derived cells.
(A) Representative photographs of visual cortex (V1) in Nkx2.1Cre;Ai14;Pcdhg WT, Pcdhg heterozygote or Pcdhg mutant mice. Sections were stained for PV, SST, RLN or VIP. Scale bars, 50 μm.
Figure 3—figure supplement 2
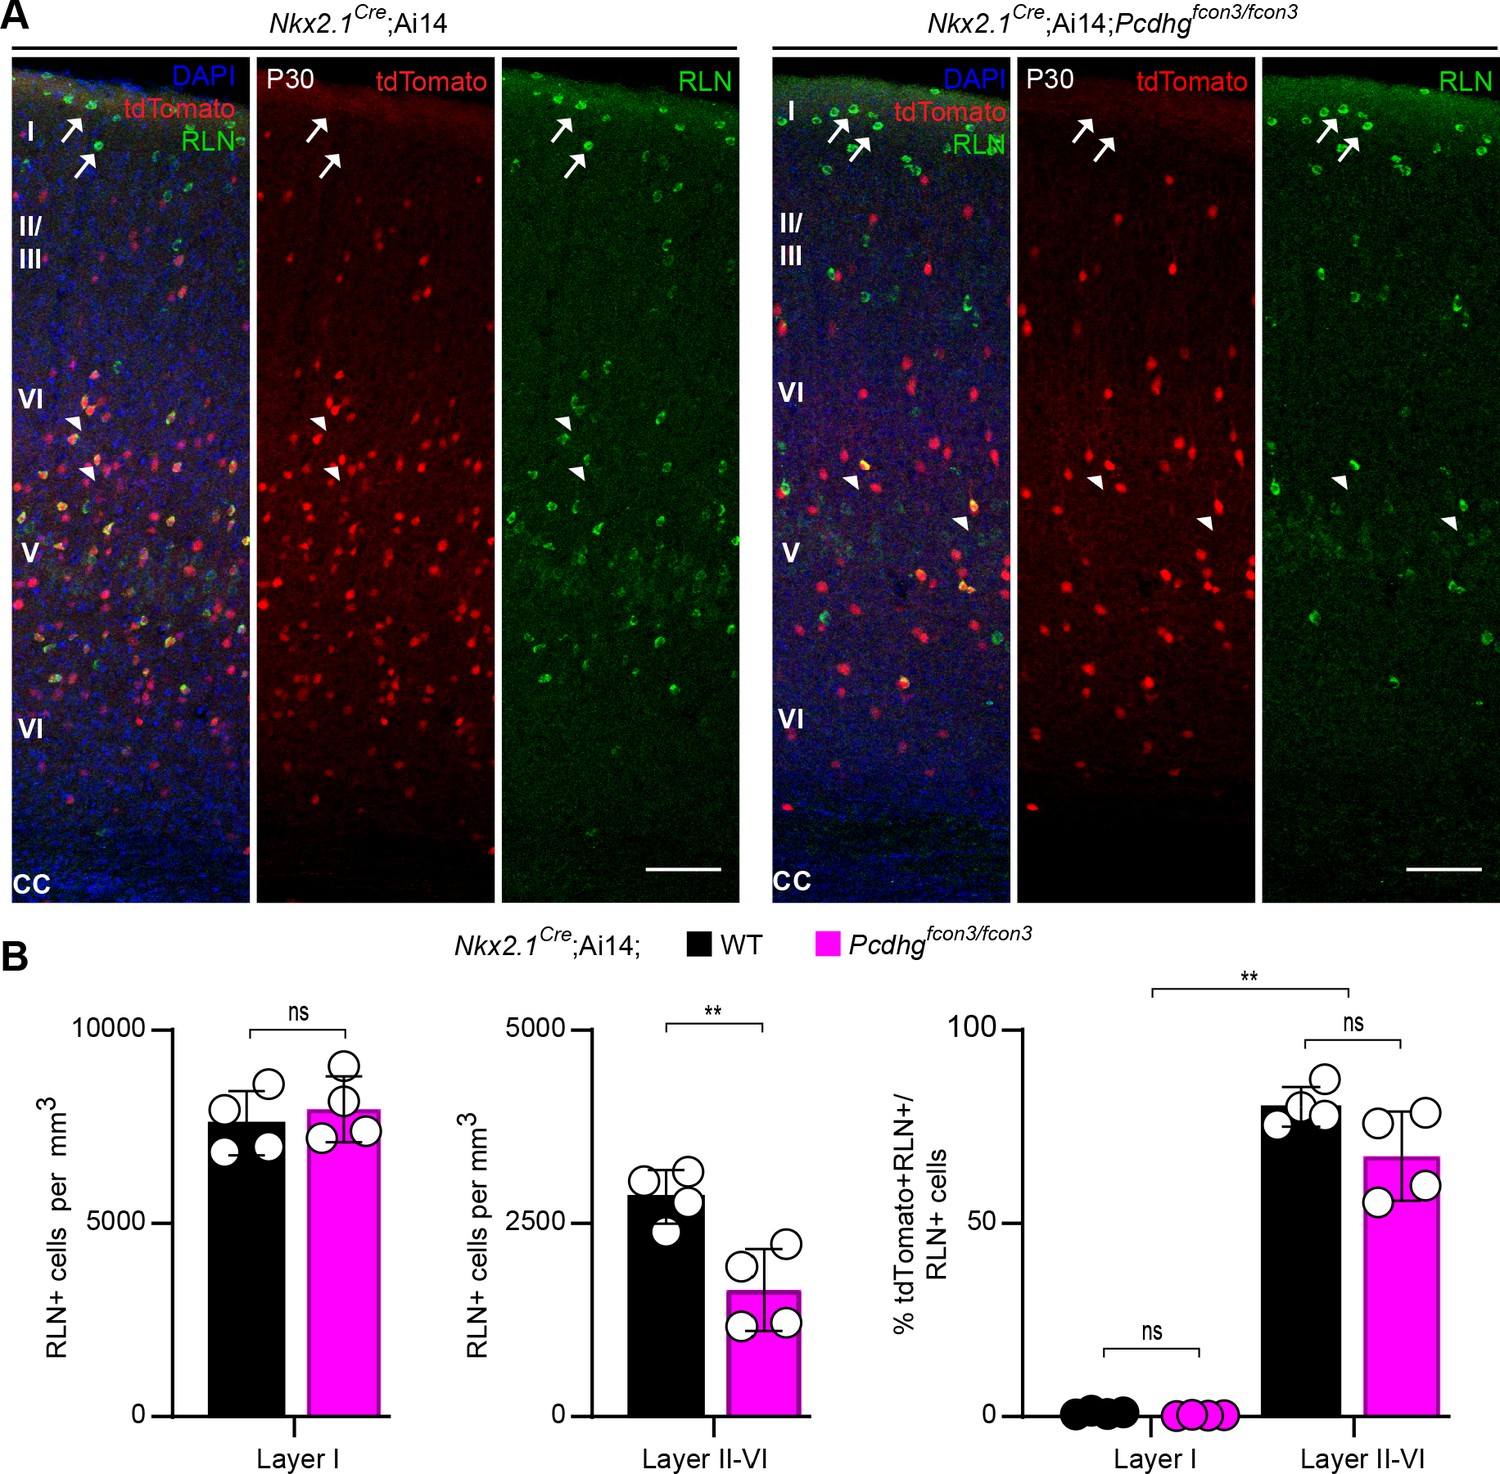
Numbers of Nkx2.1-derived RLN positive cINs are reduced in layers II-VI in Pcdhg-deficient mice.
(A) Representative photographs of visual cortex (V1) in Nkx2.1Cre;Ai14;Pcdhg+/+ (Pcdhg WT, left panels) and Nkx2.1Cre;Ai14;Pcdhgfcon3/fcon3 (Pcdhg mutant, right panels) mice. Sections were stained for RLN, tdTomato, and DAPI. Arrows point to RLN+/tdTomato- cells and arrowhead points to RLN+/tdTomato+ positive cells. Scale bars 100 μm. (B) Quantifications of RLN+ cells in layer I and layers II-VI represented as density (left and middle graphs) and as percentage of Nkx2.1-derived cells by cortical layer (right graph) in the primary visual cortex (Mann-Whitney, p=0.4857 (Layer I, left graph), **p=0.0286 (Layers II-VI, middle graph); Kruskal-Wallis test P value<0.0001, adjusted p values **p=0.005 (right graph); n = 4 mice of each genotype).
-
Figure 3—figure supplement 2—source data 1
Quantification of Reelin positive cINs by cortical layer in the visual cortex of controls and Pcdhg loss of function mice.
- https://cdn.elifesciences.org/articles/55374/elife-55374-fig3-figsupp2-data1-v2.xlsx
Figure 3—figure supplement 3
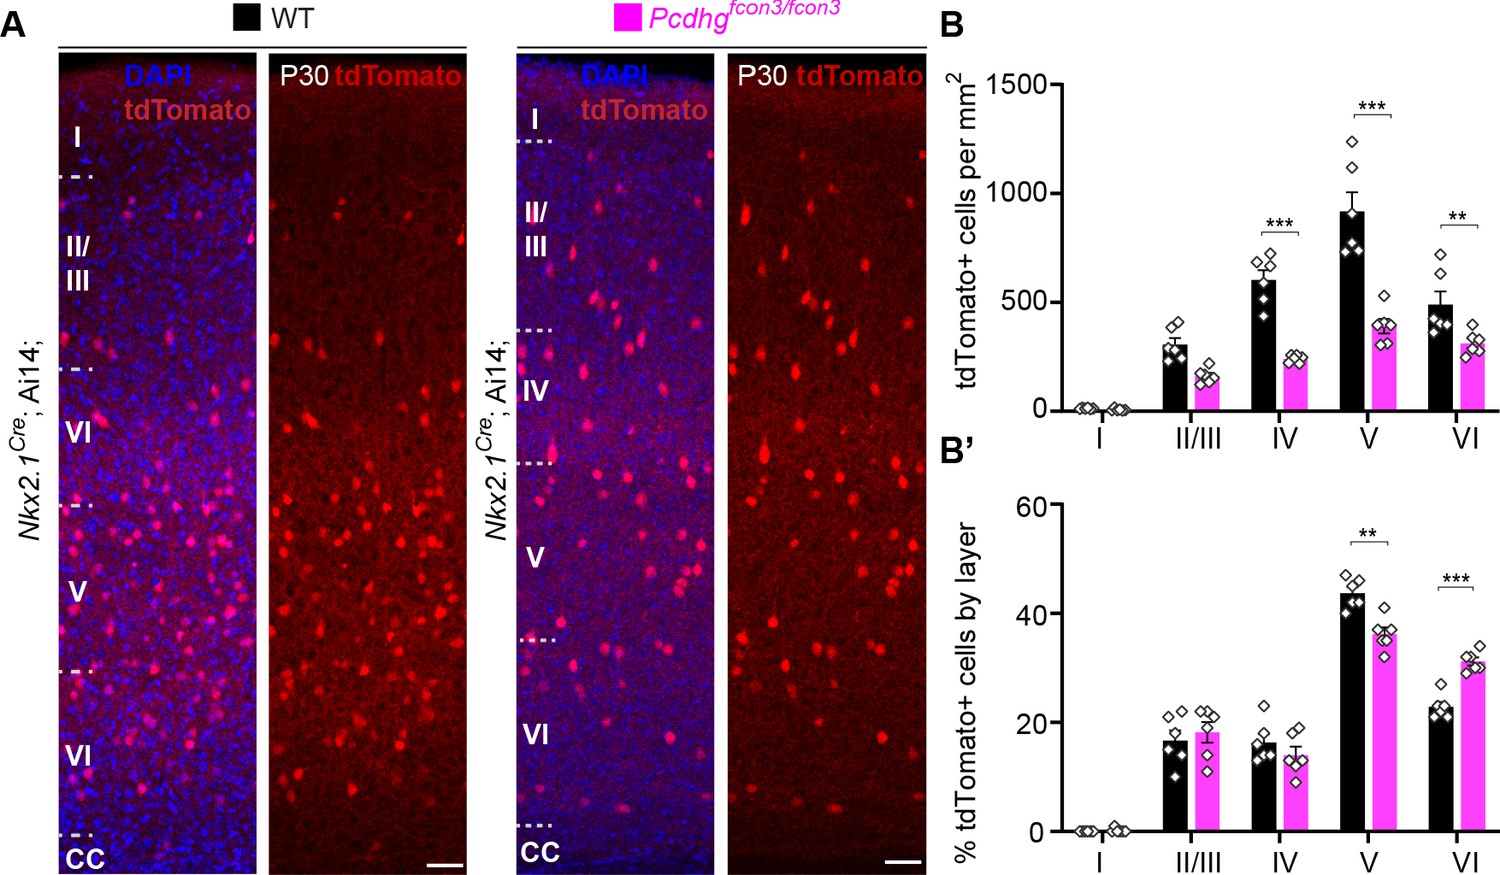
Cortical layer distribution of Nkx2.1-derived cINs in Pcdhg WT and mutant mice.
(A) Representative photographs of the primary visual cortex (V1) in Nkx2.1Cre;Ai14;Pcdhg+/+ (Pcdhg WT) and Nkx2.1Cre;Ai14;Pcdhgfcon3/fcon3 (Pcdhg mutant) mice at P30. Scale bar 50 μm. (B) Quantification of tdTomato+ Nkx2.1-derived cINs in layers I-VI of visual cortex of Pcdhg WT and mutant mice at P30 (2-way ANOVA, Fgenotype = 91.70, P value<0.0001, adjusted p values ***p<0.0001, **p=0.015, n = 6 mice of each genotype). (B’) Layer distribution of tdTomato+ Nkx2.1-derived cINs shown as percentage tdTomato+ cells per layer in V1 of Pcdhg WT and Pcdhg mutant mice at P30 (2-way ANOVA, Fgenotype = 1.75e-003, P value=0.95, adjusted p values ***p=0.0001, **p=0.0005, n = 6 mice of each genotype).
-
Figure 3—figure supplement 3—source data 1
Quantification of Nkx2.1-derived cINs by cortical layer in the visual cortex of controls and Pcdhg loss of function mice.
- https://cdn.elifesciences.org/articles/55374/elife-55374-fig3-figsupp3-data1-v2.xlsx
Figure 3—figure supplement 4
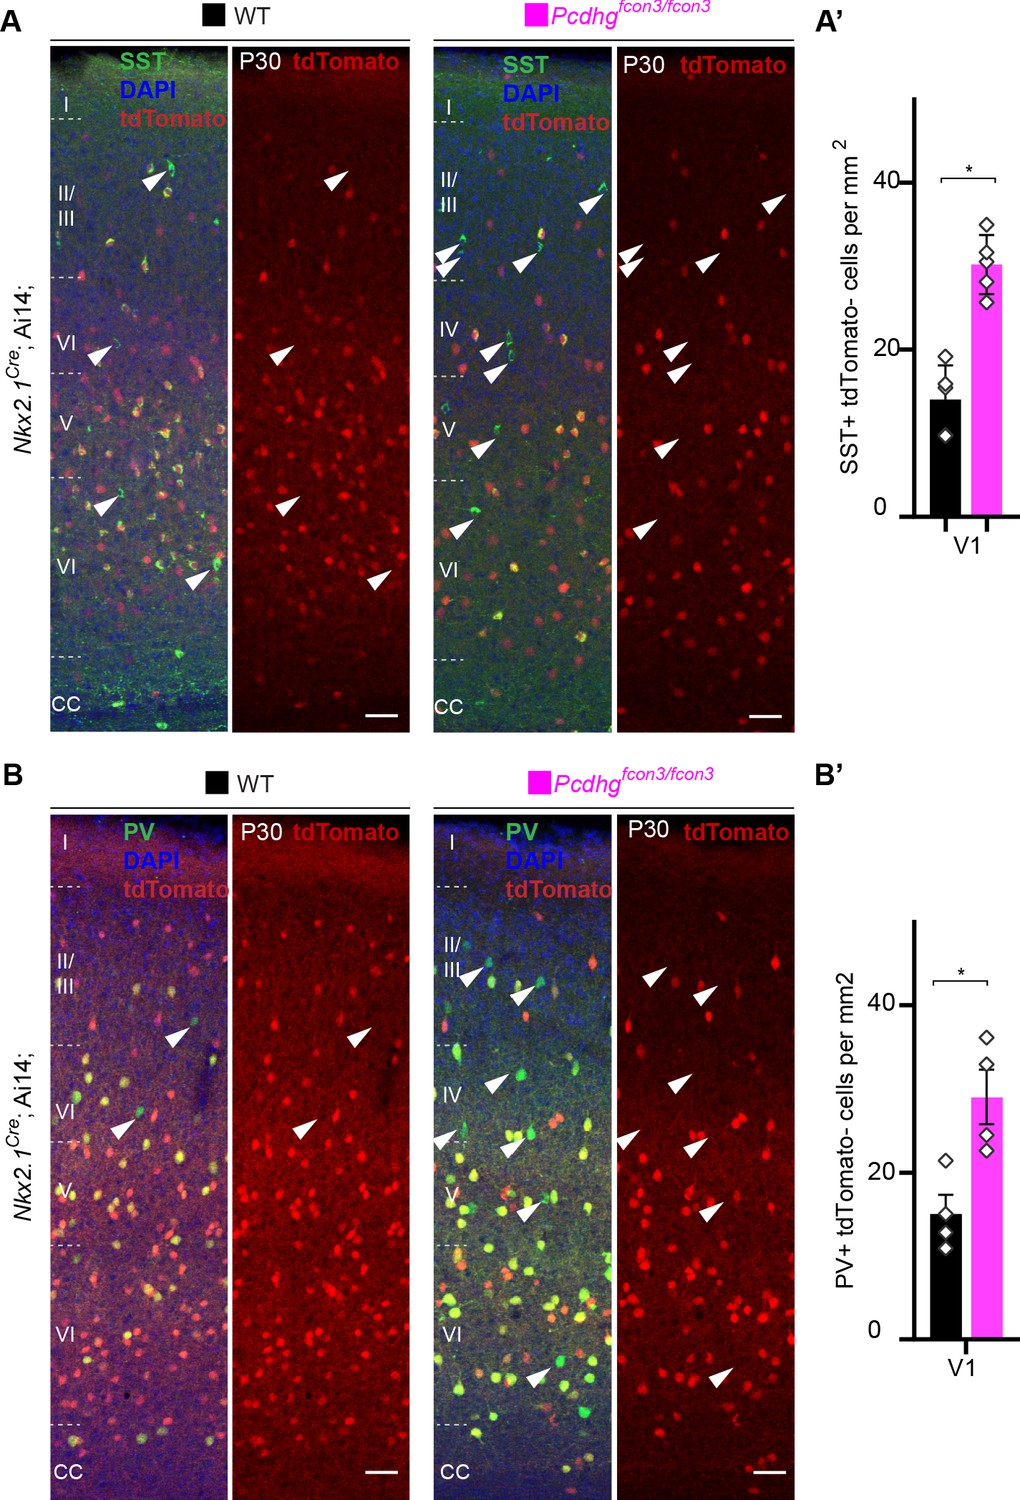
Increased survival of non-Nkx2.1-derived SST and PV cINs in Pcdhg-deficient mice.
(A,B) Representative photographs of the primary visual cortex (V1) in Nkx2.1Cre;Ai14;Pcdhg+/+ (Pcdhg WT) and Nkx2.1Cre;Ai14;Pcdhgfcon3/fcon3 (Pcdhg mutant) mice at P30. Sections were stained for SST and PV. Arrowheads (in A and B) indicate SST+ or PV+ unrecombined (tdTomato-) cINs. Scale bar 50 μm. (A’, B’) Quantifications of SST+/tdTomato- (A) and PV+/tdTomato- (B) cells in V1 of Pcdhg WT and Pcdhg mutant mice at P30 (Mann-Whitney test, for SST+/tdtomato- *p=0.0079, n = 5 mice of each genotype; for PV+/tdTomato- *p=0.0.0286, n = 4 mice of each genotype).
-
Figure 3—figure supplement 4—source data 1
Quantification of non-Nkx21-derived PV and SST positive cINs in the visual cortex of controls and Pcdhg loss of function mice.
- https://cdn.elifesciences.org/articles/55374/elife-55374-fig3-figsupp4-data1-v2.xlsx
Figure 4

Proliferation and migration are not affected by the loss of Pcdhg in NKX2.1 expressing cells.
( A) Photographs of coronal sections through the embryonic forebrains of E13.5 Nkx2.1Cre;Ai14;Pcdhg+/+ (Pcdhg WT, top panels) and Nkx2.1Cre;Ai14;Pcdhgfcon3/fcon3 (Pcdhg mutant, bottom panels). Close-up photographs of the MGE from Nkx2.1Cre;Ai14;Pcdhg WT (right panels) and Pcdhg mutant (bottom, right panels) embryos. Robust reporter activity (tdTomato) was observed in the MGE. Dividing cells were labeled using the mitotic marker PH3. Note that the size and number of PH3+ cells in the MGE was similar in the mutant and control brains. Scale bars, 50 μm. (B) Quantification of PH3+ cells from MGE ventricular (VZ) and subventricular zone (SVZ) in E13.5 (top) and E15.5 (bottom) Nkx2.1Cre;Ai14;Pcdhg WT (black bars) and Pcdhg mutant (magenta bars) embryos (Mann-Whitney test, p=0.4000 (E13.5 VZ), p=0.8571 (E13.5 SVZ), p=0.8571 (E15.5 VZ), p>0.999 (E15.5 SVZ), n = 3–4 embryos of each genotype). (C) Photographs of coronal sections of dorsal cortex at E15.5 showing the migrating MGE-derived cIN in Nkx2.1Cre;Ai14;Pcdhg WT (left) and Pcdhg mutant (right) embryos. Note the robust migratory streams of young neurons in the SVZ and in the marginal zone (MZ). From these regions, cells disperse into the intermediate zone (IZ) and cortical plate (CP). Similar numbers of migrating cIN were observed in mutants and controls. Scale bar, 100 μm. (D) Quantifications of number of migrating MGE-derived cINs in the CP and in the IZ/SVZ of Nkx2.1Cre;Ai14;Pcdhg WT (black) and Pcdhg mutant (magenta) mice. No significant differences were detected in the number of tdTomato+ migrating cells in Pcdhg mutant and WT controls (Mann-Whitney test, p>0.990 (E15.5 CP), p=0.7000 (E15.5 IZ-SVA), n = 3 embryos of each genotype).
-
Figure 4—source data 1
Quantification of PH3 positive cells in the embryonic MGE and number of Nkx2.1-derived cINs in the embryonic dorsal cortex of controls and Pcdhg loss of function mice.
- https://cdn.elifesciences.org/articles/55374/elife-55374-fig4-data1-v2.xlsx
Figure 5
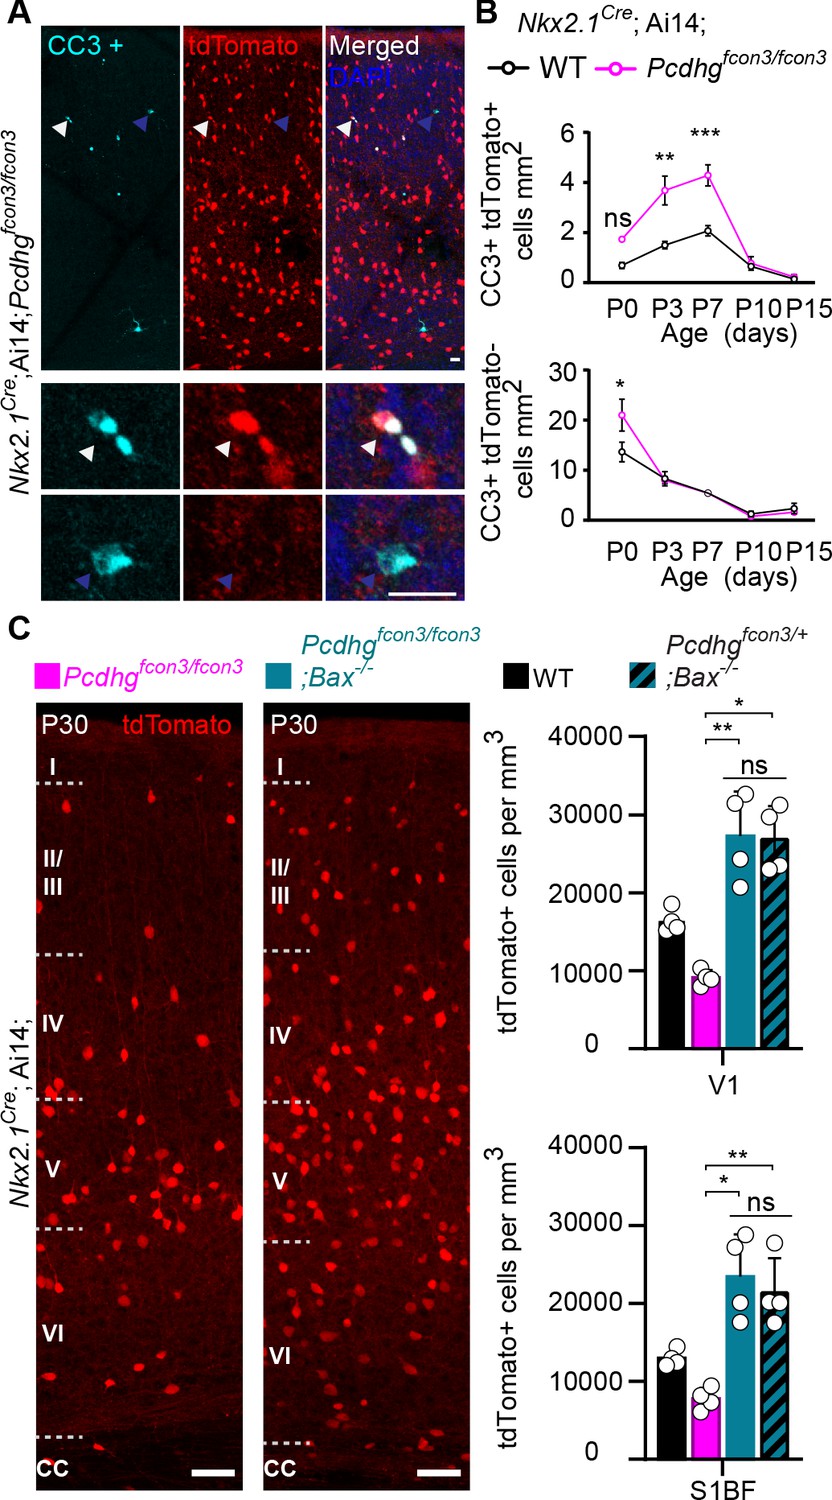
Increased programmed cell death in Pcdhg mutants is rescued in Pcdhg-bax null animals.
(A) Photographs of coronal sections through a Nkx2.1Cre;Ai14;Pcdhgfcon3/fcon3 (Pcdhg mutant) P7 mouse cortex (top), showing tdTomato+ cINs and cleaved caspase 3 positive cells (CC3+). Close-up photographs (bottom) of tdTomato+, CC3+ (white Arrowheads) and tdTomato-, CC3+ (blue Arrowheads) cells. Scale bar 25 μm. (B) Quantification of the density of tdTomato+,CC3+ (MGE-derived, top graph) cells from Nkx2.1Cre;Ai14;Pcdhg WT (black line) and Pcdhg mutant (magenta line) mice. Quantification of the density of tdTomato-,CC3+ (non-MGE-derived, bottom graph) cells from Nkx2.1Cre;Ai14;Pcdhg WT (black line) and Pcdhg mutant (magenta line) mice. Note that the number of CC3+ cells was significantly increased in the MGE-derived population in Pcdhg mutant mice, and coincides with the normal period of programmed cell death for cINs in WT mice (Each age was analyzed with a nested 1-way ANOVA (mouse ID nested within genotype), P value<0.0001. Significant comparisons are marked with *; *p=0.0004 **p=0.0014, ***p=0.0009, n = 3–5 mice of each genotype). (C) Coronal sections through the primary visual cortex (V1) of Nkx2.1Cre;Ai14;Pcdhgfcon3/fcon3 (Pcdhg mutant, left) and Nkx2.1Cre;Ai14;Pcdhgfcon3/fcon3;Bax-/- (Pcdhg mutant, Bax null, right) mice at P30. Quantifications of the density of cINs in V1 (top) and S1BF (bottom) cortex. Note that genetic removal of Bax in both Pcdhgfcon3/+ (Pcdhg HET) and Pcdhgfcon3/fcon3 (Pcdhg mutant) mice rescues cell death to similar levels (Kruskal-Wallis test, P value<0.001 (for V1 an S1BF), adjusted p values for V1 (*p=0.01 , **0.005 ) and for S1BF (**p=0.0109 , *p=0.0286); n = 4–5 mice of each genotype).
-
Figure 5—source data 1
Analysis of cIN programmed cell death in controls, Pcdhg mutant and Bax null mice.
- https://cdn.elifesciences.org/articles/55374/elife-55374-fig5-data1-v2.xlsx
Figure 6 with 1 supplement
Pcdhg function is not required for the survival of PV cINs after the period of programmed cell death.
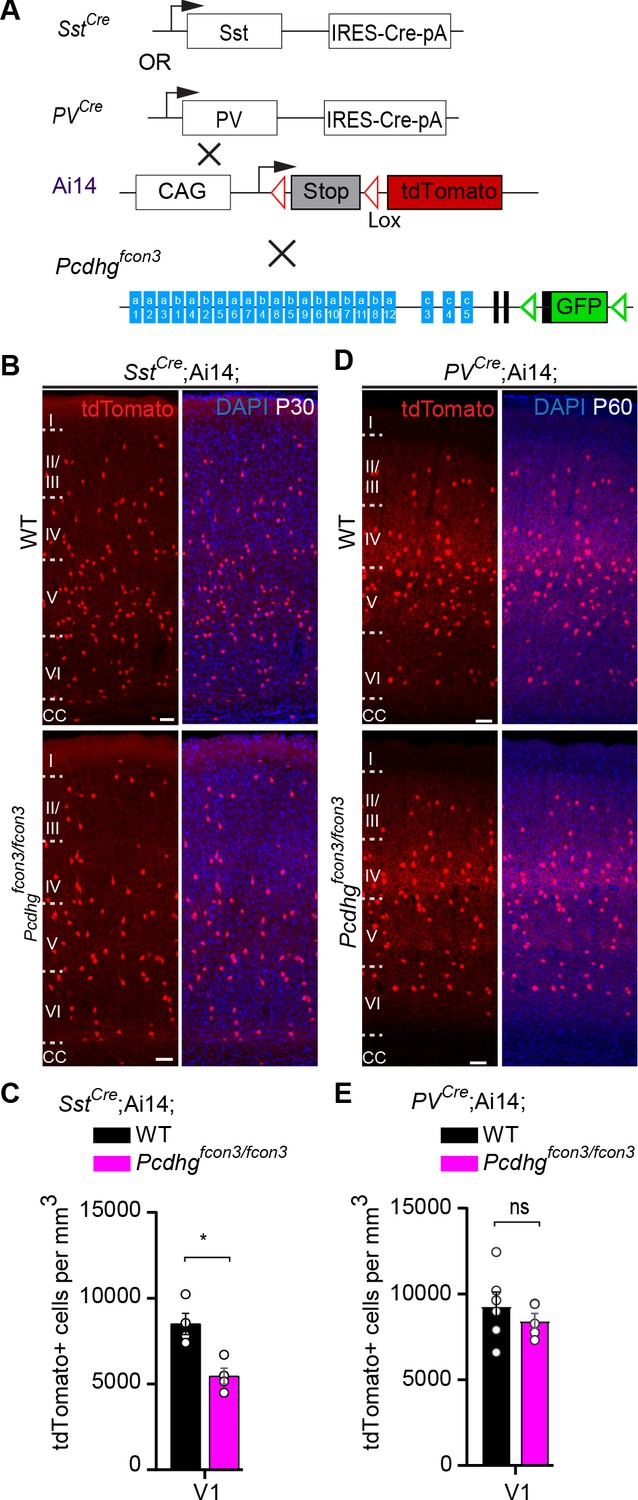
(A) Mutant mice with loss of Pcdhg in SST or PV cells were generated by crossing conditional Pcdhgfcon3 mice to mice carrying Cre under Sst (SstCre) or Pvalb (Parvalbumin, PVCre). The conditional Ai14 line was used to fluorescently label SST or PV cells. (B) Photographs of coronal sections of the primary visual cortex (V1) of P30 SstCre; Ai14;Pcdhg+/+ (Pcdhg WT, top left) and SstCre;Ai14;Pcdhgfcon3/fcon3 (Pcdhg mutant, bottom left) mice. Scale bars, 50 μm. (C) Quantifications of the density of tdTomato+ cINs in V1 cortex of Pcdhg WT (black) and Pcdhg mutant (magenta) SstCre;Ai14 mice at P30 (Mann-Whitney test, **p=0.0286, n = 4 mice of each genotype). (D) Photographs of coronal sections of V1 in PVCre;Ai14;Pcdhg+/+ (Pcdhg WT, top right) and PVCre;Ai14;Pcdhgfcon3/fcon3 (Pcdhg mutant, bottom right) mice at P60. Scale bars, 50 μm. (E) Quantifications of the density of tdTomato+ cIN in V1 cortex of Pcdhg WT and Pcdhg mutant PVCre;Ai14 mice at P60-100 (Mann-Whitney test, p=0.4206,n = 5 mice of each genotype).
-
Figure 6—source data 1
Analysis of PV and SST- derived cINs at P30 in controls and Pcdhg mice.
- https://cdn.elifesciences.org/articles/55374/elife-55374-fig6-data1-v2.xlsx
Figure 6—figure supplement 1

Late postnatal expression of Parvalbumin in cINs.
(A) PV reporter mice (PVCre) were crossed to conditional Ai14 mice to label PV expressing cINs. (B) Representative photographs of primary visual cortex (V1) in PVCre;Ai14 mice at P14, 16, 23 and 30. CC = corpus callosum. Scale bars, 100 μm.
Figure 7

Loss of Pcdha, Pcdhb, or Pcdhga1, Pcdhga2, and Pcdhga3 genes does not affect the survival of MGE-derived cINs.
(A) Mutant mice with loss of Pcdha, Pcdhb or Pcdhga1, Pcdhga2, and Pcdhga3 genes in MGE-derived cINs were generated by crossing Pcdhaacon, Pcdhbdel, and Pcdhgtako mice to the Nkx2.1Cre mouse line. The conditional Ai14 line was used to fluorescently label MGE-derived cells. (B) Measurements of body weight (top graph) in P30 Nkx2.1Cre;Ai14;Pcdha+/+ (Pcdha WT, black bar) and Nkx2.1Cre;Ai14;Pcdhaacon/acon (Pcdha mutant, grey bar) mice (Mann-Whitney test, p=0.545, n = 9–14 mice of each genotype). Quantification of the density of MGE-derived cINs (bottom graph) in primary visual cortex (V1) of Pcdha WT (black bar) and Pcdha mutant (grey bar) P30 mice (Mann-Whitney test, p=0.9603, n = 4–5 mice of each genotype). (C) Measurements of body weight (top bar) in P30 Nkx2.1Cre;Ai14;Pcdhb+/+ (Pcdhb WT, black bar) and Nkx2.1Cre;Ai14;Pcdhbdel/del (Pcdhb mutant, pink bar) mice (Mann-Whitney test, p=0.712, n = 4–9 mice of each genotype). Quantification of the density of MGE-derived cIN (bottom graph) in primary visual cortex (V1) of Pcdhb WT (black bar) and Pcdhb mutant (pink bar) P30 mice (Mann-Whitney test, p=0.1111, n = 4–5 mice of each genotype). (D) Measurements of body weight (top graph) in Nkx2.1Cre;Ai14;Pcdhg+/+ (Pcdhg WT, black) and Nkx2.1Cre;Ai14;Pcdhgtako/tako(Pcdhga1, Pcdhga2, and Pcdhga3 mutant, blue bar) P30 mice (Mann-Whitney test, p=0.175, n = 4–5 mice of each genotype). Quantification of the density of MGE-derived cINs (bottom graph) in in primary visual cortex (V1) of Pcdhg WT (black bar) and Pcdhga1, Pcdhga2, and Pcdhga3 mutant (blue bar) P30 mice (Mann-Whitney test, p=0.9048, n = 4–5 mice of each genotype).
-
Figure 7—source data 1
Analysis of Nkx2.1-derived cINs in P30 control, Pcdha, Pcdhb and Pcdhg mutant mice.
- https://cdn.elifesciences.org/articles/55374/elife-55374-fig7-data1-v2.xlsx
Figure 8 with 1 supplement

Pcdhg are required for cIN survival after transplantation.
(A) Schematic of co-transplantation of MGE-derived cIN precursors. MGE cells were derived from Nkx2.1Cre;Ai14;Pcdhg+/+ (Pcdhg WT) or Nkx2.1Cre;Ai14;Pcdhgfcon3/fcon3 (Pcdhg mutant) embryos. These cells were mixed in equal proportions with MGE cells from Gad1-GFP embryos (Pcdhg WT, green) and transplanted into WT black (Blk) six host recipient mice. Cell survival was analyzed before (3 DAT) and throughout the period of cell death (6–21 DAT). (B,B’) Survival fraction of co-transplanted MGE-derived cIN precursors. (B) MGE cells were derived from Gad1-GFP (green) and Nkx2.1Cre;Ai14; (magenta) embryos; both GFP+ and tdTomato+ cells carry WT Pcdhg. In this control experiment the survival fraction was similar for both genotypes carrying the different fluorescent reporters (2-way ANOVA, Fgenotype = 2.54, P value > 0.999; n = 4–6 mice per time point from two transplant cohorts). (B’) MGE cells were derived from Gad1-GFP WT (green) and Nkx2.1Cre;Ai14;Pcdhg mutant (magenta) embryos. GFP+ and tdTomato+ cells showed dramatic differences in their survival; the majority of cells carrying the Pcdhg mutant allele (magenta) were eliminated between 6 and 21 DAT (2-way ANOVA, Fgenotype = 2738.02, P value < 0.0001; adjusted p values ***p<0.0001; n = 4–5 mice per time point from two transplant cohorts. Quantifications in (B and B’) were done at 3, 6, 13 and 21 DAT and are represented as fractions of GFP+ or tdTomato+ cells from total cells (GFP + tdTomato+) per brain section. The increase in the proportion of WT cells during this period is not a reflection of increased cell numbers (WT cIN also undergo elimination by programmed cell death (See Figure 8—figure supplement 1), but rather that WT cells account for a larger fraction of all transplant-derived cells (WT + Pcdhg mutant). (C) Representative photographs of cortical sections from transplanted host mice at 6 (left) and 21 (right) DAT. Transplanted MGE cells were derived from Gad1-GFP (Pcdhg WT, green) and Nkx2.1Cre;Ai14;Pcdhgfcon3/fcon3 (Pcdhg mutant, red) embryos. Scale bars, 50 μm.
-
Figure 8—source data 1
Survival of transplanted MGE-derived cIN precursor cells carrying WT or mutant Pcdhg.
- https://cdn.elifesciences.org/articles/55374/elife-55374-fig8-data1-v2.xlsx
Figure 8—figure supplement 1
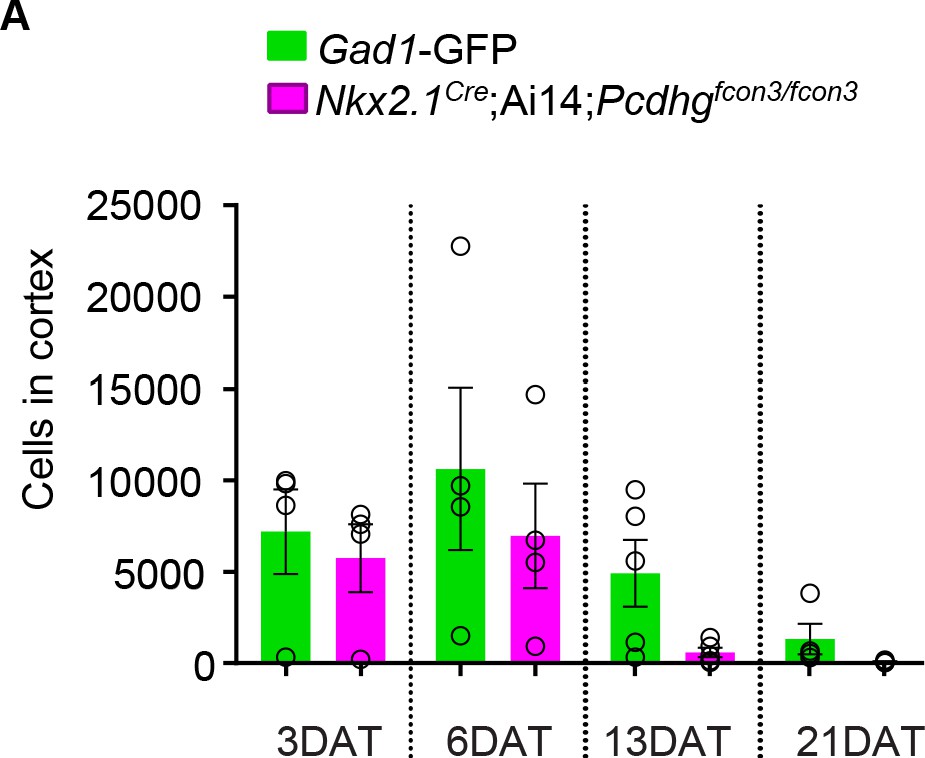
Number of cIN drops for both the Pcdhg WT and Pcdhg mutant transplanted population.
(A) Quantification of the GFP (green bars) and tdTomato (magenta bars) positive cells in the cortex of Blk six recipient mice at 3, 6, 13, and 21 DAT. The GFP and tdTomato-labeled cells were derived from E13.5 MGEs of Nkx2.1Cre;Ai14;Pcdhgfcon3/fcon3 (Pcdhg mutant) and Gad1-GFP (Pcdhg WT) embryos, and were co-transplanted in similar proportions into Blk6 WT recipients. Note that both WT and Pcdhg mutant cell numbers decrease over time.
-
Figure 8—figure supplement 1—source data 1
Quantification of transplanted MGE-derived cIN precursor cells carrying WT or mutant Pcdhg.
- https://cdn.elifesciences.org/articles/55374/elife-55374-fig8-figsupp1-data1-v2.xlsx
Figure 9
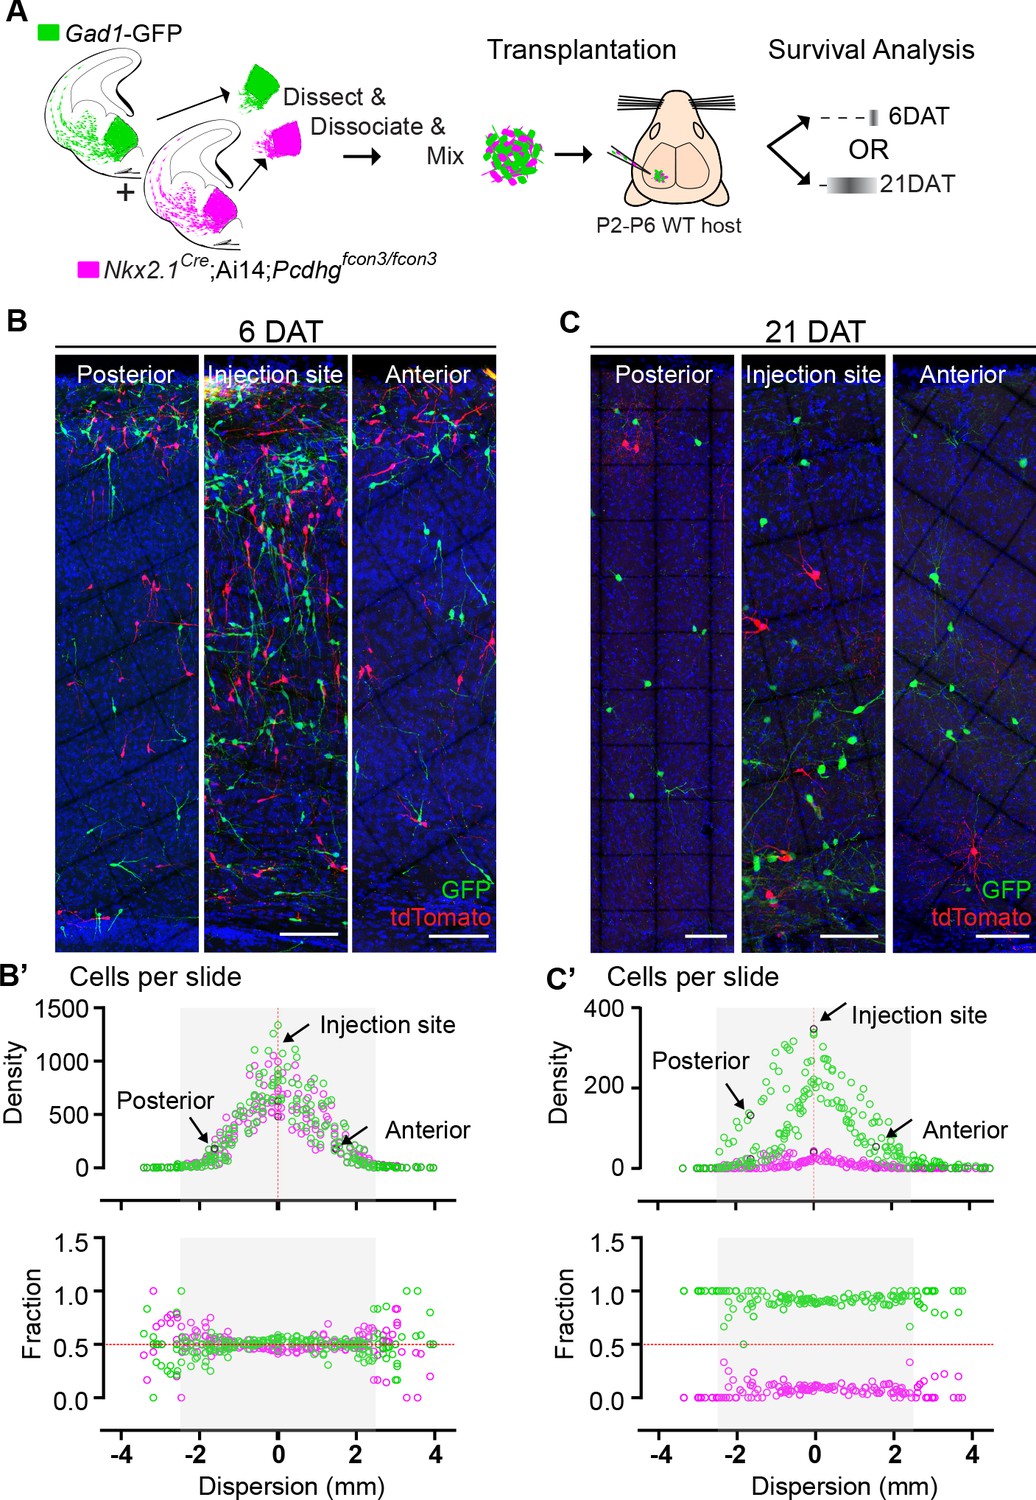
Survival of cIN, WT or mutant for Pcdhg, was not affected by cell density.
(A) MGE cells derived from Nkx2.1Cre;Ai14;Pcdhgfcon3/fcon3 embryos (Pcdhg mutant, magenta) and from Gad1-GFP embryos (Pcdhg WT, green) were mixed in equal numbers and transplanted into WT hosts. The survival of tdTomato and GFP- labeled cINs was analyzed in every other section throughout the brain region of the transplant dispersal. (B) Photographs of representative coronal sections at the injection site, or anterior and posterior to it, from host mice at 6DAT. Similar numbers of tdTomato and GFP-labeled cINs were observed at each location. Scale bar 100 μm. (B’) Dispersion analysis at 6 DAT of the Pcdhg WT (green) or Pcdhg mutant (magenta) cells, represented as density (top) or survival fraction (bottom) as a function of distance from the site of injection in the host recipients. Note that the density of cells decreases as one moves anteriorly or posteriorly with respect to the injection site. At 6 DAT, the dispersal and survival was similar for both WT and Pcdhg mutant cells. (C) Photographs of representative coronal sections at the injection site, or anterior and posterior to it, from host mice at 21DAT. Note the dramatic reduction in the number of Pcdhg mutant cells (magenta) compared to the Pcdhg WT cells (green). Scale bar 100 μm. (C’) Dispersion analysis at 21DAT of the Pcdhg WT (green) or Pcdhg mutant (magenta) cells, represented as density (top) or survival fraction (bottom) as a function of distance from the site of injection in the host recipients. At 21 DAT, the survival fraction for the Pcdhg mutant cells (magenta) was dramatically reduced and similarly affected at different locations with respect to the injection site.
-
Figure 9—source data 1
Dispersal and survival analysis of transplanted MGE-derived cIN precursor cells carrying WT or mutant Pcdhg.
- https://cdn.elifesciences.org/articles/55374/elife-55374-fig9-data1-v2.xlsx
Figure 10 with 1 supplement
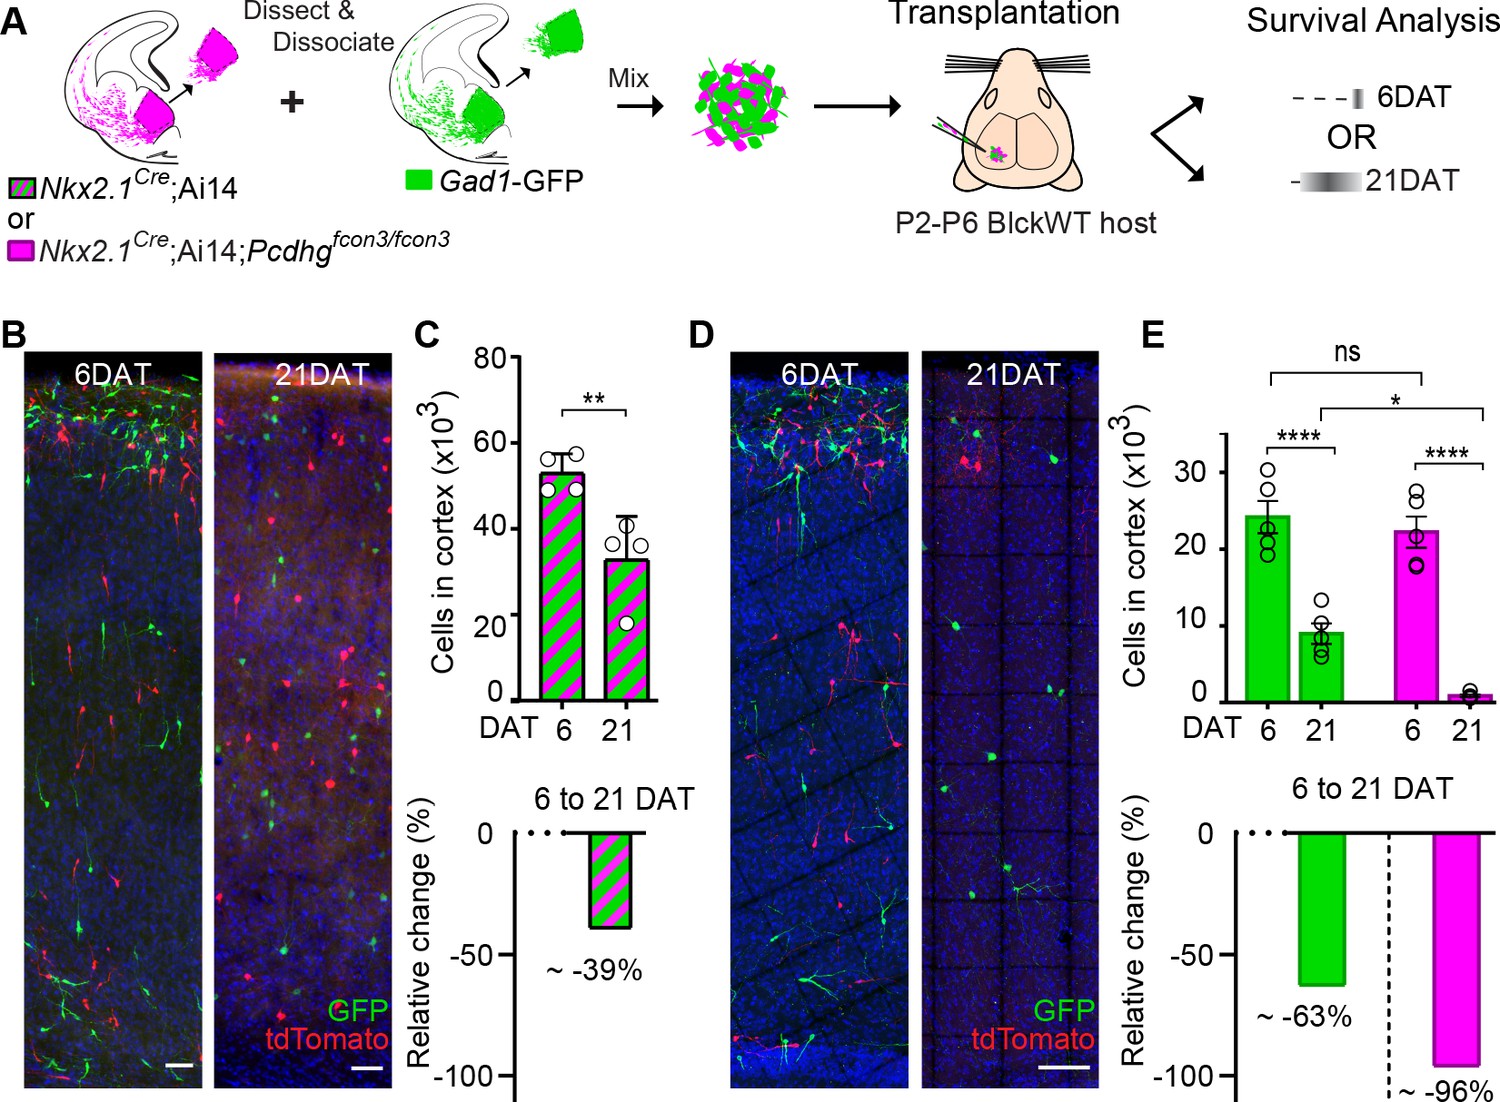
MGE cell transplantation reveals a non-cell autonomous effect of Pcdhg on cIN survival.
(A) Schematic of co-transplantation experiment for quantification of absolute number of transplanted MGE cells derived from (1) Nkx2.1Cre;Ai14 and Gad1-GFP embryos WT for Pcdhg or (2) Nkx2.1Cre;Ai14;Pcdhgfcon3/fcon3 (Pcdhg mutant, magenta) and Gad1-GFP (Pcdhg WT, green) embryos. The total numbers of transplant-derived cINs were counted at 6 and 21 DAT throughout the volume of cortex were transplanted cells dispersed. (B) Photographs of representative coronal sections of co-transplanted tdTomato and GFP-labeled cells, both Pcdhg WT, at 6 and 21 DAT. Scale bar 100 um. (C) Absolute number of surviving tdTomato and GFP-labeled Pcdhg WT cIN at 6 and 21 DAT (top graph) (Mann-Whitney test, **p=0.0286, n = 4 mice per time point from one transplant cohort). The drop in number of transplant derived cells was similar for WT-GFP+ and WT-tdTomato+ (Figure 10—figure supplement 1). A 39% drop in cIN number was observed between 6 and 21 DAT (bottom graph). (D) Photographs of representative coronal sections of transplanted tdTomato-labeled Pcdhg mutant (magenta) and GFP-labeled Pcdhg WT (green) cells at 6 and 21 DAT. Survival of the cINs drops for both genotypes, but the tdTomato-labeled cells were nearly eliminated by 21 DAT. Scale bar 100 μm. (E) Absolute number of surviving cINs at 6 and 21 DAT (top graph)(2-way ANOVA; Fage = 128.65, P value < 0.0001, adjusted p value ****p<0.0001); Fgenotype = 9.74 (p value=0.0066, adjusted p value *p=0.0126); n = 5 mice per time point from one transplant cohort). Comparing 6 and 21 DAT a drop of ~63% and of 96.0% was observed, respectively, for cells WT and mutant for Pcdhg (bottom graph).
-
Figure 10—source data 1
Survival analysis and absolute quantification of transplanted MGE-derived cIN precursor cells carrying WT or mutant Pcdhg.
- https://cdn.elifesciences.org/articles/55374/elife-55374-fig10-data1-v2.xlsx
Figure 10—figure supplement 1
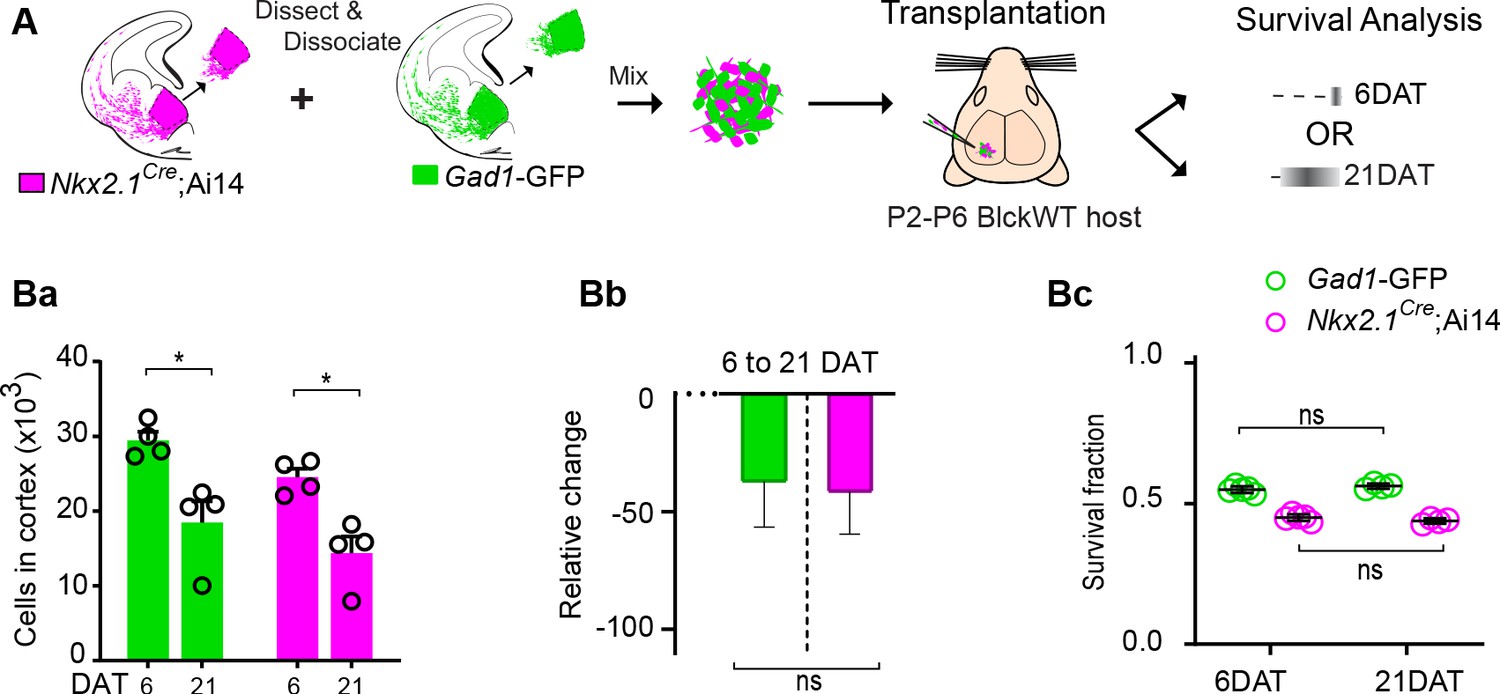
Fluorescent reporter or breeding background does not affect survival of transplanted MGE-derived cINs.
(A) Schematic of co-transplantation of MGE-derived cIN precursors. MGE precursor cells were derived from Nkx2.1Cre;Ai14; (tdTomato+) and Gad1-GFP (GFP+) E13.3 embryos that carry WT Pcdhg. The GFP and tdTomato positive cells were mixed in similar proportions and transplanted into WT black (Blk) six host recipients. Survival of the transplanted cells was analyzed at 6 and 21 DAT. (Ba-Bc) Quantification of the GFP (green bars) and tdTomato (magenta bars) positive cells in the cortex of Blk6 recipient mice at 6 and 21 DAT. The number of GFP+ (green bars) and tdTomato+ (magenta bars) cells decreases over time (Ba), but the relative change in cell number from 6 to 21 DAT (Bb) and the survival fraction (Bc) is similar in both the GFP+ and tdTomato+ population. This indicates that the fluorophore and driver of the fluorophore does not affect survival. Note that a similar survival between 6 DAT and 21 DAT (shown in Bc) is not a reflection of unchanged cell numbers, but rather that GFP or tdTomato cells account for a similar fraction of all the transplant-derived cells (Mann-Whitney test, *p=0.0286 (Ba), n = 4–5 mice per time point).
-
Figure 10—figure supplement 1—source data 1
Survival analysis and absolute quantification of transplanted MGE-derived cIN precursor cells carrying WT Pcdhg but carry different fluorophores.
- https://cdn.elifesciences.org/articles/55374/elife-55374-fig10-figsupp1-data1-v2.xlsx
Figure 11
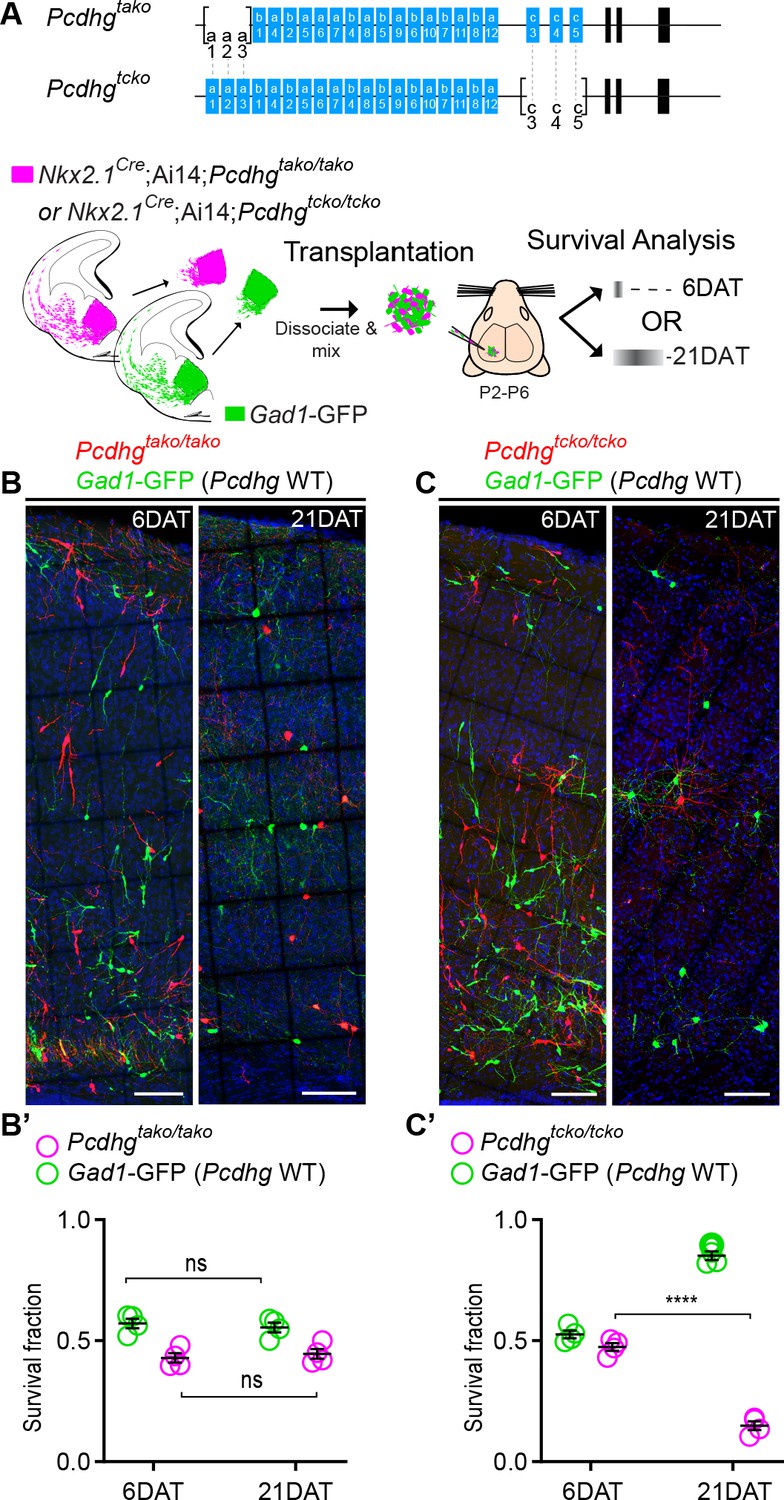
Loss of Pcdhgc3, Pcdhgc4, and Pcdhgc5 is sufficient to increase cIN cell death.
(A) Diagram of the mutant alleles Pcdhgtako (Pcdhga1, Pcdhga2, and Pcdhga3 KO) and Pcdhgtcko (Pcdhgc3, Pcdhgc4, and Pcdhgc5 KO). Below - schematic of transplantation of MGE cIN precursors from Nkx2.1Cre;Ai14;Pcdhgtako/tako (Pcdhga1, Pcdhga2, and Pcdhga3 deleted) and Nkx2.1Cre;Ai14;Pcdhgtcko/tcko (Pcdhgc3, Pcdhgc4, and Pcdhgc5 deleted) embryos. These cells were mixed in equal proportions with MGE cells from Gad1-GFP embryos (Pcdhg WT, green) and transplanted into WT Blk6 host recipients. Survival of the GFP and tdTomato-labeled cells was analyzed at 6 and 21 DAT. (B, B’) Representative photographs of cortical sections from transplanted host animals at 6 (left) and 21 (right) DAT. Note the similar proportions of Pcdhg WT (GFP+) and Pcdhga1, Pcdhga2, and Pcdhga3 deleted cells (tdTomato+) at 6 and 21DAT. Scale bars, 100 μm. (B’) Quantifications of the survival fraction of the GFP (green) and tdTomato (magenta)-labeled MGE-derived cells at 6 and 21 DAT. Note, survival fraction remains similar and constant for both genotypes (Pcdhg WT and Pcdhga1, Pcdhga2, and Pcdhga3 deleted cells) between 6 and 21 DAT (Mann-Whitney test, p=6571, n = 4 mice per time point from one transplant cohort). (C, C’) Representative photographs from coronal brain sections of transplanted host animals at 6 (left) and 21 (right) DAT. Scale bars, 100 μm. Survival of MGE-derived cINs from Pcdhgc3, Pcdhgc4, and Pcdhgc5 deleted embryos (tdTomato+) is markedly different from MGE-derived cINs from Pcdhg WT embryos (GFP+). (C’) Survival fraction at 6 and 21 DAT of the Pcdhg WT (green) and Pcdhgc3, Pcdhgc4, and Pcdhgc5 deleted cells (magenta) (Mann-Whitney test, ****p=0.0286, n = 4 mice per time point from one transplant cohort).
-
Figure 11—source data 1
Survival analysis of transplanted MGE-derived cIN precursor cells deficient in Pcdha1, Pcdha2 and Pcdha3 or deficient in Pcdhc3, Pcdhc4 and Pcdhc5.
- https://cdn.elifesciences.org/articles/55374/elife-55374-fig11-data1-v2.xlsx
Figure 12

Loss of Pcdhg does not affect the morphological maturation of cIN during the period of programmed cell death.
(A) Photographs of representative images and morphological reconstructions of co-transplanted Gad1-GFP cells (Pcdhg WT, left columns) with Nkx2.1Cre;Ai14;Pcdhgfcon3/fcon3 cells (Pcdhg mutant, right columns) at 6, 8, 10 and 12DAT. Scale bars, 50 μm. (B) Quantifications of Pcdhg WT(green) and Pcdhg mutant cells (magenta) from co-transplanted animals, represented as survival fraction from total number of cells per section at 6, 8 10 12 and 21 DAT. Pcdhg mutant cells begin to increase their elimination between 6 and 8 DAT and this increased death occurs through 21 DAT. (C–F) Measurements of neurite complexity during the period of programmed cell death, including neurite length (C), neurite number (D), node number (E) and neurite ends (F) in Pcdhg WT(green) and Pcdhg mutant (magenta) neurons at 6, 8, 10 and 12 DAT. Two-tailed unpaired Student’s t-test, n = 32 (WT), n = 35 (Pcdhg mutant) cells at 6 DAT, n = 27 (WT and Pcdhg mutant) cells at 8 DAT, n = 26 (WT), n = 27 (Pcdhg mutant) cells at 10 DAT, and n = 27 (WT), n = 31 (Pcdhg mutant) cells at 12 DAT; cells analyzed from two transplant cohorts. All statistical comparisons were not significant following Benjamini-Hochberg multiple comparisons correction at alpha of 0.05.
-
Figure 12—source data 1
Morphological reconstruction of transplanted MGE-derived cIN precursor cells carrying WT or mutant Pcdhg.
- https://cdn.elifesciences.org/articles/55374/elife-55374-fig12-data1-v2.xlsx
Figure 13
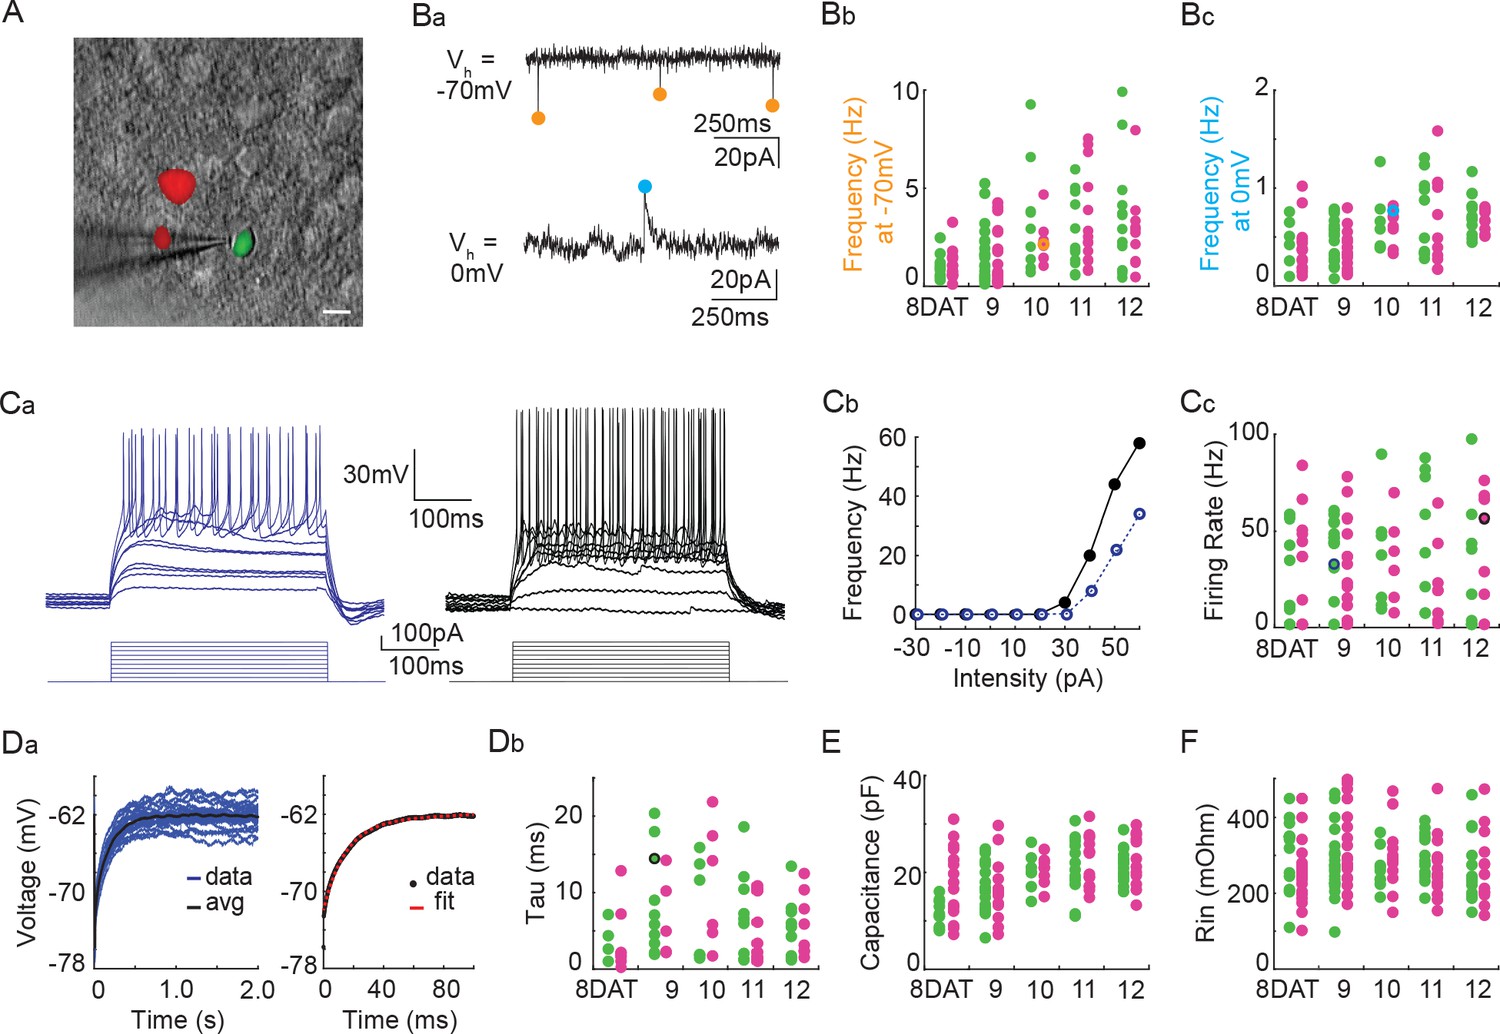
Pcdhg deletion does not affect the physiological properties of cINs during the period of programmed cell death.
(A) DIC image with fluorescence image overlaid showing co-transplanted cINs from the MGE of Gad1-GFP (Pcdhg WT, green) or Nkx2.1Cre;Ai14;Pcdhgfcon3/fcon3 (Pcdhg mutant, red) embryos, recorded in an acute brain slice taken from visual cortex (scale bar 10 µm). (Ba) Representative voltage clamp recordings (1 s) from a Nkx2.1Cre;Ai14;Pcdhgfcon3/fcon3 (Pcdhg mutant) cINs held at −70 mV (top) to record glutamatergic events (orange circles) and 0 mV (bottom) to record GABAergic events (cyan circles). Bb, Bc. Group data from cINs recorded at 8, 9, 10, 11, and 12 DAT showing that co-transplanted Gad1-GFP cINs (WT, green circles) and Nkx2.1Cre;Ai14;Pcdhgfcon3/fcon3 cINs (Pcdhg mutant, magenta circles) have similar rates of glutamatergic events (measured at −70 mV, Bb) and similar rates of GABAergic events (measured at 0 mV, Bc). The voltage clamp recordings from (Ba) are represented within the group data by the orange (−70 mV) and cyan (0 mV) circles in Bb and Bc) respectively. Ca, Cb. Representative current clamp traces showing a range of firing rates from a Gad1-GFP cIN (WT, blue trace) and a Nkx2.1Cre;Ai14;Pcdhgfcon3/fcon3 (Pcdhg mutant, black trace) cIN responding to intracellular current injections (Ca), and the corresponding FI curves (Cb). (Cc) Group data from cINs recorded at 8, 9, 10, 11, and 12 DAT showing that co-transplanted Gad1-GFP cINs (WT, green circles) and Nkx2.1Cre;Ai14;Pcdhgfcon3/fcon3 cINs (Pcdhg mutant, pink circles) have similar maximum spike rates. The current clamp traces from (Ca and Cb) are represented within the group data by the blue and black circles. (Da) Left: Gad1-GFP (WT) cIN voltage responses to repeated current injections (blue traces). Right: The membrane time constant (Tau) is calculated by fitting an exponential to the average voltage trace (black line). (Db) Group data from current clamp recordings of co-transplanted Gad1-GFP cINs (WT, green circles) and Nkx2.1Cre;Ai14;Pcdhgfcon3/fcon3 cINs (Pcdhg mutant, magenta circles) at 8, 9, 10, 11, and 12 DAT shows that Pcdhg deletion does not affect membrane time constant. The current clamp recording from (Da) is represented within the group data by a black circle. (E and F) Group data from current clamp recordings of co-transplanted Gad1-GFP cINs (WT, green circles) and Nkx2.1Cre;Ai14;Pcdhgfcon3/fcon3 cINs (Pcdhg mutant, magenta circles) at 8, 9, 10, 11, and 12 DAT shows that Pcdhg deletion does not affect either capacitance (E) or input resistance (F). Cells analyzed in A–F were taken from at least three transplant cohorts.
-
Figure 13—source data 1
Analysis of the intrinsic electrophysiological properties of transplanted MGE-derived cIN precursor cells carrying WT or mutant Pcdhg.
- https://cdn.elifesciences.org/articles/55374/elife-55374-fig13-data1-v2.xlsx
Author response image 1
Tables
Table 1
Group data for the frequency of spontaneous excitatory and inhibitory synaptic currents (Hz), max firing rate (Hz), tau (ms), capacitance (pF), and input resistance (mOhm) from Figure 13.
The mean, standard deviation, sample size, and statistical tests are reported. Comparisons were not statistically significant following Benjamini-Hochberg multiple comparisons correction at an alpha of 0.05.
| Frequency of spontaneous excitatory synaptic currents (Hz) | Frequency of spontaneous inhibitory synaptic currents (Hz) | |||||
|---|---|---|---|---|---|---|
| Pcdhgfcon3/fcon3 | WT | Mann-Whitney | Pcdhgfcon3/fcon3 | WT | Mann-Whitney | |
| Mean ± SD | Mean ± SD | p value | Mean ± SD | Mean ± SD | p value | |
| 8DAT | 1.0 ± 0.7 (n = 18) | 1.0 ± 0.7 (n = 9) | 0.890 | 0.4 ± 0.2 (n = 18) | 0.4 ± 0.2 (n = 6) | 0.463 |
| 9DAT | 1.4 ± 1.4 (n = 19) | 1.6 ± 1.4 (n = 21) | 0.432 | 0.4 ± 0.2 (n = 15) | 0.4 ± 0.2 (n = 18) | 0.347 |
| 10DAT | 2.2 ± 1.0 (n = 9) | 3.4 ± 2.8 (n = 9) | 0.652 | 0.6 ± 0.2 (n = 9) | 0.6 ± 0.3 (n = 7) | 0.859 |
| 11DAT | 3.2 ± 2.3 (n = 14) | 2.5 ± 1.8 (n = 13) | 0.298 | 0.6 ± 0.5(n = 11) | 0.7 ± 0.4 (n = 11) | 0.711 |
| 12DAT | 2.6 ± 2.1 (n = 11) | 3.3 ± 2.8 (n = 14) | 0.597 | 0.7 ± 0.1 (n = 10) | 0.7 ± 0.2 (n = 13) | 0.436 |
| Max Firing Rate (Hz) | Tau (ms) | |||||
| Pcdhgfcon3/fcon3 | WT | Mann-Whitney | Pcdhgfcon3/fcon3 | WT | Mann-Whitney | |
| Mean ± SD | Mean ± SD | p value | Mean ± SD | Mean ± SD | p value | |
| 8DAT | 21.8 ± 23 (n = 16) | 21.5 ± 22.9 (n = 12) | 0.789 | 3.6 ± 4.3 (n = 8) | 3.8 ± 2.6 (n = 4) | 0.683 |
| 9DAT | 29.1 ± 25.1 (n = 17) | 35.0 ± 22.3 (n = 19) | 0.416 | 6.8 ± 5.3 (n = 5) | 8.7 ± 6.7 (n = 10) | 0.717 |
| 10DAT | 35.7 ± 22.8 (n = 6) | 37.7 ± 28.6 (n = 7) | 1.000 | 11.0 ± 8 (n = 6) | 7.8 ± 6.7 (n = 6) | 0.387 |
| 11DAT | 24.5 ± 24.4 (n = 11) | 36.3 ± 34.9 (n = 12) | 0.534 | 5.7 ± 4.3 (n = 10) | 7.3 ± 5.7 (n = 9) | 0.707 |
| 12DAT | 35.0 ± 32.3 (n = 10) | 29.8 ± 29.3 (n = 12) | 0.757 | 5.8 ± 4.1 (n = 8) | 5.5 ± 3.9 (n = 9) | 0.880 |
| Capacitance (pF) | Input Resistance (mOhm) | |||||
| Pcdhgfcon3/fcon3 | WT | Mann-Whitney | Pcdhgfcon3/fcon3 | WT | Mann-Whitney | |
| Mean ± SD | Mean ± SD | p value | Mean ± SD | Mean ± SD | p value | |
| 8DAT | 18.3 ± 7.3 (n = 16) | 11.6 ± 2.7 (n = 10) | 0.019 | 257.3 ± 87.1 (n = 23) | 313.6 ± 86.5 (n = 16) | 0.027 |
| 9DAT | 16.4 ± 6.0 (n = 15) | 17.2 ± 5.1 (n = 19) | 0.465 | 327 ± 106.5 (n = 23) | 278.9 ± 83.4 (n = 23) | 0.095 |
| 10DAT | 20.5 ± 2.8 (n = 9) | 20.2 ± 3.9 (n = 7) | 0.837 | 297.5 ± 94.3 (n = 11) | 264.7 ± 52.9 (n = 9) | 0.304 |
| 11DAT | 22.4 ± 5.1 (n = 15) | 20.4 ± 6.5 (n = 13) | 0.503 | 269.1 ± 79.6 (n = 15) | 294.2 ± 59.9 (n = 14) | 0.185 |
| 12DAT | 23.2 ± 5.8 (n = 13) | 21.5 ± 3.4 (n = 15) | 0.338 | 266.5 ± 96.4 (n = 13) | 262.3 ± 83.6 (n = 15) | 0.882 |
Table 2
Ratios are reported for the frequency of spontaneous excitatory and inhibitory synaptic currents where wild type and Pcdhgfcon3/fcon3 co-transplants are compared within the same slice.
The natural log of each ratio was averaged for 8, 9, 10, 11, and 12 DAT and show that slice variation was not significant.
| Frequency of spontaneous excitatory synaptic currents | Frequency of spontaneous inhibitory synaptic currents | ||
|---|---|---|---|
| LN(Pcdhg fcon3/fcon3/WT) | LN(Pcdhg fcon3/fcon3/WT) | ||
| Mean ± SD | Mean ± SD | ||
| 8DAT | −0.305 ± 0.425 | 0.162 ± 0.793 | |
| 9DAT | 0.177 ± 0.468 | 0.018 ± 0.550 | |
| 10DAT | 0.321 ± 0.706 | 0.301 ± 0.436 | |
| 11DAT | 0.120 ± 0.927 | −0.075 ± 0.262 | |
| 12DAT | −0.523 ± 0.943 | −0.072 ± 0.128 |
Key resources table
| Reagent type (species) or resource | Designation | Source or reference | Identifiers | Additional information |
|---|---|---|---|---|
| Genetic reagent (mouse) | Gad2Cre | PMID:21943598 | Also referred to as Gad2-IRES-Cre knock-in | |
| Genetic reagent (mouse) | Nkx2.1Cre | PMID:17990269 | Also referred to as C57BL/6J-Tg(Nkx2-1-cre)2Sand/J | |
| Genetic reagent (mouse) | PVCre | PMID:15836427 | Also referred to as B6;129P2-Pvalbtm1(cre)Arbr/J | |
| Genetic reagent (mouse) | SstCre | PMID:21943598 | Also referred to as Ssttm2.1(cre)Zjh/J | |
| Genetic reagent (mouse) | Ai14 | The Jackson Laboratory | Also referred to as Ai14 , Ai14 D or Ai14 (RCL-tdT)-D | |
| Genetic reagent (mouse) | Gad1-GFP | The Jackson Laboratory | Also referred to as G42 line. | |
| Genetic reagent (mouse) | Bax-/- | The Jackson Laboratory | Also referred to as B6;129-Baxtm2Sjk Bak1tm1Thsn/J | |
| Genetic reagent (mouse) | Pcdhaacon/acon | PMID:28450636 | Referred to as Pcdhαf/f and Pcdhα-/- in original publication. | |
| Genetic reagent (mouse) | Pcdhbdel/del | PMID:28450637 | Referred to as Pcdhß-/- in original publication. | |
| Genetic reagent (mouse) | Pcdhgtako/tako; Pcdhga1, Pcdhga2, and Pcdhga3 mutant; Pcdhga1, Pcdhga2, and Pcdhga3 KO | PMID:22884324 | Referred to as Pcdhgtako/tako in original publication. | |
| Genetic reagent (mouse) | Pcdhgtcko/tcko; Pcdhgc3, Pcdhgc4, and Pcdhgc5 mutant; Pcdhgc3, Pcdhgc4, and Pcdhgc5 KO | PMID:22884324 | Referred to as Pcdhgtcko/tcko in original publication. | |
| Genetic reagent (mouse) | Pcdhgfcon3/fcon3 | PMID:19029044 | Referred to as Pcdh-γfcon3 in original publication. | |
| Antibody | anti-GFP (chicken polyclonal) | Aves Lab | Cat# GFP-1020, RRID:AB_10000240 | IF(1:2500) |
| Antibody | Anti-Reelin (mouse monoclonal) | MBL International | Cat#: MBL, D223–3, RRID:AB_843523 | IF(1:500) |
| Antibody | Anti-PV (rabbit antiserum) | Swant | Cat#: PV27 , RRID:AB_2631173 | IF(1:1000) |
| Antibody | Anti-PV (mouse monoclonal) | Sigma-Aldrich | Cat#: P3088, RRID:AB_477329 | IF(1:500) |
| Antibody | Anti-SST (rat, polyclonal | Santa Cruz Biotechnology | Cat#:sc-7819, RRID:AB_2302603 | IF(1:500) |
| Antibody | Anti-cleaved caspase 3 (rabbit polyclonal) | Cell Signaling Technology | Cat#: 9661L, RRID:AB_2341188 | IF(1:400) |
| Antibody | Anti-phosphohiston-H3 (rabbit polyclonal) | EDM Millipore | Cat#: 06–570, RRID:AB_310177 | IF(1:500) |
| Antibody | Anti-NKX2-1 (rabbit polyclonal) | Life Technologies | Cat#: sc-13040, ARRID:AB_793532 | IF(1:250) |
| Chemical compound, drug | DNAse I | Sigma Millipore | Cat#: 260913-10MU | 180 ug/mL |
| Commercial assay or kit | QuantiTect Rev. Transcription Kit | Qiagen | Cat#: 205311 | |
| Software, algorithm | Stereo Investigator | MBF bioscience | ||
| Software, algorithm | Neurolucida | MBF bioscience | ||
| Software, algorithm | custom software written in MATLAB | ‘other’ | Larimer, 2020. mPhys. MATLAB Central File Exchange. (https://www.mathworks.com/matlabcentral/fileexchange/21903-mphys). 1.2.0.0. |
Appendix 1—table 1
Clustered protocadherin primer sequences for RT-PCR gene expression analysis in Figure 1.
| Gene name | Oligo name | Sequence | forward/reverse |
|---|---|---|---|
| Pcdhga1 | Pcdhga1 | CACGAGAGCTGTGAGAAACAGG | F |
| Pcdhga2 | Pcdhga2 | CTGATTTCCTCTCAGCACCTCAG | F |
| Pcdhga3 | Pcdhga3 | GAAACGAAAGAAGACCCCACGC | F |
| Pcdhga4 | Pcdhga4 | CTCCTGGTATCTCAAGACTTGC | F |
| Pcdhga5 | Pcdhga5 | CACACAAAGAAGAGCCCGGAGA | F |
| Pcdhga6 | Pcdhga6 | GCAAAGAGGAAGACTCTCTTGA | F |
| Pcdhga7 | Pcdhga7 | TCAAGAATGTAAGGGTGAAGCC | F |
| Pcdhga8 | Pcdhga8 | CATCCATAGATTTCCATGAGAATAA | F |
| Pcdhga9 | Pcdhga9 | TCAGTTGAGCCCAAGTTTCCT | F |
| Pcdhga10 | Pcdhga10 | CCAAGTGTCCTGTAGAAGACGC | F |
| Pcdhga11 | Pcdhga11 | GCGAGCCTCTCCTGATAACTG | F |
| Pcdhga12 | Pcdhga12 | CTTTTACCATCGGGTGATTCGG | F |
| Pcdhgb1 | Pcdhgb1 | CAGGATCTCCTGTGCGATGATC | F |
| Pcdhgb2 | Pcdhgb2 | GACTCTTGGGTACCAGGTACTC | F |
| Pcdhgb4 | Pcdhgb4 | TGATCAGTTGAAATCAGGACAAGA | F |
| Pcdhgb5 | Pcdhgb5 | CCTTCTTTGCCCTGAGTCATC | F |
| Pcdhgb6 | Pcdhgb6 | CTTAATTCCGCTTCACCTTGG | F |
| Pcdhgb7 | Pcdhgb7 | AAAGATAGCTCCTCGGCACTG | F |
| Pcdhgb8 | Pcdhgb8 | CGAGACCTTTGTACGGAAGC | F |
| Pcdhgc3 | Pcdhgc3 | GCTGCGAAGTTGTGATCCTGTG | F |
| Pcdhgc4 | Pcdhgc4 | CAAGCTGTCCACCCTCTGATCTT | F |
| Pcdhgc5 | Pcdhgc5 | GCCTTGCGTTCCCGCTCTAGTA | F |
| PcdhgCon | PcdhgCon | GTAAACTGGGGTCCGTATCGAG | R |
| Pcdhga1 | PcdhgA_1 | TTTTGTCAGCACCCCAGTC | F |
| Pcdhga2 | PcdhgA_2 | TTTCCTCTCAGCACCTCAGTC | F |
| Pcdhga3 | PcdhgA_3 | GTGGGAAAAGCGAGCCTCTTA | F |
| Pcdhga4 | PcdhgA_4 | AGCTGTGGGAAGAGTGATCC | F |
| Pcdhga5 | PcdhgA_5 | AGAGCTGTGAGAAGAGTGAGC | F |
| Pcdhga6 | Pcdh_γA6 | CATCAGTCAGGAGGGCTGTG | F |
| Pcdhga7 | PcdhgA_7 | ATCAGCCAAGATAGCTGTGAG | F |
| Pcdhga8 | 2 PcdhgA_8 | CATCCATAGATTTCCATGAG | F |
| Pcdhga9 | 2Pcdh_γA9 | TGTGGGAAGAGTGAACCTCTG | F |
| Pcdhga11 | 3Pcdh_γA11 | GAAAAGCGAGCCTCTCCTG | F |
| Pcdhgb1 | PcdhgB_1 | TGTGCGATGATCCTTCTGTG | F |
| Pcdhgb2 | 3Pcdh_γB2 | GACTCCGGAAGTTGCTCCTC | F |
| Pcdhgb4 | 2Pcdh_γB4 | CAGGACAAGATCTACAATTTGC | F |
| Pcdhgb5 | 4- PcdhgB5 | TCTGGACAAGGCCTTCTTTG | F |
| Pcdhgb6 | Pcdh_γB6 | GATCGTTTCCGGTAGTTCTCC | F |
| Pcdhgb7 | 2- PcdhgB7 | TCCAGCCGCACAAGATATTC | F |
| Pcdhgb8 | 2- PcdhgB8 | CGAGACCTTTGTACGGAAGC | F |
| Pcdhgc3 | PcdhgC_3 | TGCGAAGTTGTGATCCTGTG | F |
| Pcdhgc4 | PcdhgC_4 | CAAGCTGTCCACCCTCTGATC | F |
| PcdhgCon | Pcdhg_COM-R | GAGAGAAACGCCAGTCAGTG | R |
| Pcdha1 | 2-PcdhAlpha_1 | AAAGAAGTGACCACGCAGAAG | F |
| Pcdha2 | PcdhA2-F | GGAATCAGCAGAAGAGAGACAA | F |
| Pcdha3 | PcdhAlpha_3 | ACACCATGCCCAGTTAATCAAG | F |
| Pcdha4 | PcdhAlpha_4 | TCTGATTCAAGGGACAGAGAGG | F |
| Pcdha5 | Pcdh_α5 | TTCAGTCCCAGCCTACCTCA | F |
| Pcdha6 | Pcdh_α6 | TGAGCATCAGGATTTGAACG | F |
| Pcdha7 | Pcdh_α7 | GGGTCCCAGCTCTACAGATAAC | F |
| Pcdha8 | Pcdh_α8 | TTCTTTGGACTCCTCCGAGA | F |
| Pcdha9 | PcdhAlpha_9 | CCGAAGTGGGAATGGAAAGT | F |
| Pcdha10 | PcdhAlpha_10 | CAGTGTTCCTCCTGGTTTGG | F |
| Pcdha11 | Pcdh_α11 | TCCCAACCTGGGTAGAGATG | F |
| Pcdha12 | PcdhAlpha_12 | TGCAGAGGACACATGTCAGAG | F |
| Pcdhac1 | PcdhAlpha_C1 | TGCCAGTATCCTGTGTTCAGA | F |
| Pcdhac2 | Pcdh_αc2 | AACTCACCGGCCAAAGTAGG | F |
| PcdhaCon | Pcdh_α-CR | TGCTCTTAGCGAGGCAGAGTAG | R |
| Pcdhb1 | pcdhb1_F | TAGTTGCCGAGGGTAACAGG | F |
| Pcdhb1 | Pcdh_ß1_R | GGGTCAGATTTGCCACAAAG | R |
| Pcdhb2 | 2Pcdh_ß2_F | AATGGTTTGCTCCATCCAAG | F |
| Pcdhb2 | 2Pcdh_ß2_R | GATCCAGGGCTGTGTTTGTC | R |
| Pcdhb3 | PcdhB3-F | TCAGGGAAATGCACAGTCATAG | F |
| Pcdhb3 | PcdhB3-R | CACAGTTTCTGCTGAATTCTCG | R |
| Pcdhb4 | pcdhb4_F | TCTGGGATGACCACAGTTCA | F |
| Pcdhb4 | pcdhb4_R | TGCACCTCATAGAGCGATTG | R |
| Pcdhb5 | 3Pcdh_ß5_F | TGTGCTCACGCTCTACCTTG | F |
| Pcdhb5 | 3Pcdh_ß5_R | CTCACTCCCACGAACATCAG | R |
| Pcdhb6 | PcdhB6-F | GTCAAGGACAATGGAGAACCTC | F |
| Pcdhb6 | PcdhB6-R | CTTCATCCTGTGAAGAGTCGTG | R |
| Pcdhb7 | pcdhb7_F | GACCTCATGGAGAAGCTGGA | F |
| Pcdhb7 | 2-pcdhb7_R | GAGTTGTTGGCTCACTGCAA | R |
| Pcdhb8 | 2-pcdhb8_F | ATTCCATGCCAGAAGAAACG | F |
| Pcdhb8 | 2-pcdhb8_R | TAGTGGTCAGTTCCCCAACC | R |
| Pcdhb9 | 2-pcdhb9_F | AACAAAGGAAGCAGACAAGAGC | F |
| Pcdhb9 | 2-pcdhb9_R | TCACCGTGTTGCTCATAATCTC | R |
| Pcdhb10 | 2PcdhB10-F | GGTATTTGAGCGTGATCTAGGG | F |
| Pcdhb10 | 2PcdhB10-R | AGAGGGCGCTTCTTCTTCTAGT | R |
| Pcdhb11 | 3Pcdh_beta11_F | CGACCACTCTCCAGAGTTCC | F |
| Pcdhb11 | 3Pcdh_beta11_R | GCTGCCTTCAGAGGAAACAC | R |
| Pcdhb12 | pcdhb12_F | CTGGGATATATGGCAATGTCG | F |
| Pcdhb12 | pcdhb12_R | GTCAGACGGATTTCTCCTGTG | R |
| Pcdhb13 | 2PcdhB13-F | GATAACGCTCCAGAAGTGATCC | F |
| Pcdhb13 | 2PcdhB13-R | CTGCTGGTTATTTCCAGAGTCC | R |
| Pcdhb14 | 2-pcdhb14_F | CCCAGCACACCATAACAGTG | F |
| Pcdhb14 | 2-pcdhb14_R | GATGGTGCCTATGTGCAATG | R |
| Pcdhb15 | PcdhB15-F | CTCAGTCCGCTTACTGGAGAAT | F |
| Pcdhb15 | PcdhB15-R | AATGGTCTTTCCAACAGCAACT | R |
| Pcdhb16 | pcdhb16-F | TCATCCGTGAGAACAACAGC | F |
| Pcdhb16 | pcdhb16-R | GCAGCAGCGAGTAAGTGATG | R |
| Pcdhb17 | PcdhB17-F | AAGAGAGCACTTGACAGGGAAG | F |
| Pcdhb17 | PcdhB17-R | AGACCTGCACTGTTATGGTGTG | R |
| Pcdhb18 | PcdhB18-F | TGCATGGAGTCATACTTTGGAC | F |
| Pcdhb18 | pcdhb18-R | TAGCCATGTTTAGAAAGCAGCA | R |
| Pcdhb19 | 3Pcdh_beta19_F | TTCGCTCTTCCTCCTCTCTG | F |
| Pcdhb19 | 3Pcdh_beta19_R | AGTTCCCGCACTGTTAATGC | R |
| Pcdhb20 | PcdhB20-F | GAAGTGATCATGTCGTCGGTTA | F |
| Pcdhb20 | PcdhB20-R | CTTCCGTTGTCTCCAGAGTCTT | R |
| Pcdhb21 | 2Pcdh_beta21_F | ACAGCACTCGGGCTTTCTAC | F |
| Pcdhb21 | 2Pcdh_beta21_R | GGCAGCTCAGAGAGTGGTTC | R |
| Pcdhb22 | 2Pcdh_beta22_F | GCTCTGCTAGCGTCACACTG | F |
| Pcdhb22 | 2Pcdh_beta22_R | ATCACCTTCCTGGTGACTGG | R |
Additional files
Download links
A two-part list of links to download the article, or parts of the article, in various formats.
Downloads (link to download the article as PDF)
Open citations (links to open the citations from this article in various online reference manager services)
Cite this article (links to download the citations from this article in formats compatible with various reference manager tools)
Clustered gamma-protocadherins regulate cortical interneuron programmed cell death
eLife 9:e55374.
https://doi.org/10.7554/eLife.55374


